
This chapter will cover the platform capabilities around diagnostics and troubleshooting, including performance monitor counters, Windows event logs, the logging infrastructure, and exception handling patterns. It will also cover best practices for logging from within your application code, as well as tips and tricks for troubleshooting common problems.
Setting the Stage: Tools and Techniques
Many of the diagnostic techniques described in this chapter require analyzing log files and Windows instrumentation. In order to efficiently access and analyze this information, appropriate tools are required. To set the stage for these efforts, several key tools, including PowerShell, Microsoft’s new .NET-based scripting language, will be introduced and their basic operations explained.
Introducing PowerShell
Microsoft Windows PowerShell is Microsoft’s next-generation command-line shell and scripting language, designed to help IT professionals streamline their lives. Based on .NET technology, PowerShell has become the de facto automation framework for Exchange Server 2007, and is poised become the go-to tooling for a host of other Windows server technologies (including IIS).
This section is not intended to make you an expert on PowerShell, but provide a gentle introduction to some canned commands that can simplify certain key diagnostic tasks. For more information on PowerShell and its capabilities, refer to Pro Windows PowerShell, by Hristo Deshev (Apress, 2008), and www.microsoft.com/windowsserver2003/technologies/management/powershell/default.mspx.
Downloading and Installing
To install PowerShell, follow these steps:
- Browse to the PowerShell download URL,
www.microsoft.com/windowsserver2003/technologies/management/powershell/download.mspx.- Download the appropriate installation file for your operating system (XP/Vista/Server 2003, and 32/64 bit).
- Run the installation package.
Optionally, download and install the open source PowerShell GUI tool, PowerGUI, from http://powergui.org/index.jspa.
![]() Note PowerShell is included with Windows Server 2008 as an optional feature. To install PowerShell on Windows Server 2008, open the Server Manager (under Administrative Tools), click the Features node, and then click Add Features. From the Add Features Wizard, click the check box next to Windows PowerShell.
Note PowerShell is included with Windows Server 2008 as an optional feature. To install PowerShell on Windows Server 2008, open the Server Manager (under Administrative Tools), click the Features node, and then click Add Features. From the Add Features Wizard, click the check box next to Windows PowerShell.
The Basics
PowerShell is sufficiently large and powerful to need its own series of books; the scope of Power-Shell content in this book is a simple introduction to performing some core tasks related to BizTalk RFID and to provide a starting point for your own exploration of using PowerShell for management tasks.
To start a PowerShell console, navigate to the Start menu (All Programs on Vista) ![]() Windows PowerShell 1.0, and click Windows PowerShell. This will open up what appears to be a familiar command-line prompt. Many of the familiar command-line operations, such as
Windows PowerShell 1.0, and click Windows PowerShell. This will open up what appears to be a familiar command-line prompt. Many of the familiar command-line operations, such as cd (change directory) and dir (list directory), work in a similar fashion in this new environment. Some of the key cmdlets (specialized classes in PowerShell that implement a particular operation) to get started with are shown in Table 10-1.

Filtering Log Files
The primary use of PowerShell in these examples will be to capture, filter, and analyze information in the various log files. As detailed in a later section, the BizTalk RFID log files consist of data records in columns separated by | characters. The standard columns are thread ID, log level, timestamp, description, and component.
While basic text filtering is reasonably effective for extracting error information, tasks such as extracting all of the commands executed in a single thread require more finesse. Exercise 10-1 provides a walkthrough of using PowerShell to perform basic filtering on a log file, while Exercise 10-2 demonstrates how to use PowerShell to browse Windows Management Instrumentation (WMI) data.
Exercise 10-1. Filtering a Log File Using PowerShell
This exercise will demonstrate how to filter text from a log file using PowerShell, specifically extracting all of the error lines from a log file.
- Start a PowerShell console by clicking Start
All Programs
- Change the working directory to the BizTalk RFID Services log file directory by entering the
cdcommand shown here:PS C:> cd 'C:Program FilesMicrosoft BizTalk RFIDLogs'
PS C:Program FilesMicrosoft BizTalk RFIDLogs>- Type the following command into the PowerShell console. This will use the
gc(an alias forGet-Content) cmdlet to pipe the contents of theRfidServicesfile into theSelect-Stringcmdlet. TheSelect-Stringcmdlet will filter out any entries not containing the stringError.
       PS C:Program FilesMicrosoft BizTalk RFIDLogs> gc RfidServices.log |

            select-string "Error"

         11|  Error|110208 16:17:19|Unable to load provider - Symbol

|[ProviderManager]

         11|  Error|110208 16:17:19| Unknown Exception Failed to start HTTP server.

       The requested context
![]() Note The sample output shown will look different on your machine, depending on the number of error records in the file. Other useful search strings are
Note The sample output shown will look different on your machine, depending on the number of error records in the file. Other useful search strings are Info and Warning.
Browsing WMI
So far, there probably hasn’t been any “wow” factor for the use of PowerShell. Browsing directories, listing the contents of files, and filtering text are reasonably basic operations with many different options for tools.
One of the key advantages to using PowerShell, as opposed to data source–specific tools, is its concept of providers (not to be confused with RFID device providers). In PowerShell, a provider is a browsable data source, such as the file system provider in the log filtering examples, or the WMI provider. The same filtering and sorting techniques used on the stream of text from a file may be used to manage WMI-related data.
This paradigm allows the WMI data store to be browsed and queried using the same commands and patterns. Compared to the arcane interface provided by some of the native WMI tools (such as WMIC—see http://msdn.microsoft.com/en-us/library/aa394531.aspx for more details), PowerShell provides an accessible path to the rich information contained within the WMI store.
WMI is arranged as a hierarchy of namespaces that contain a set of classes (which are typically either information sources or events). The scope of information available through WMI is staggering, and beyond the scope of this book.
Exercise 10-2. Browsing a WMI Namespace
This exercise will demonstrate how to list all of the available classes in the RFID WMI namespace using PowerShell.
- Start a PowerShell console by clicking Start
- Type the following command into the PowerShell console. This will use the
Get-WmiObjectcommand to retrieve the list of all classes under therootMicrosoftRfidnamespace (the namespace where all of the RFID-related WMI classes and events live) and assign it to the$rfidClassesvariable.PS C:> $rfidClasses = Get-WmiObject -List -Namespace "rootMicrosoftRfid"- Check the number of classes available in the RFID namespace by executing the following command; as shown in the output from the command, there are 110 items in the namespace.
PS C:> $rfidClasses.Count

110- To see the complete list of available events, execute the following command. Note that the complete output from this command is not displayed.
PS C:> $rfidClasses

ManagementEvent                                ServerManagementEvent

ServerProviderManagementEvent       ProviderStartedEvent

ProviderStoppedEvent                           ProcessManagementEvent

ProcessDefinitionModifiedEvent           ProcessStoppedEvent

ProcessBindingModifiedEvent               ExceptionInEventQueuerEvent
Capturing WMI Events
The previous section demonstrated how to enumerate the list of available events in the RFID WMI namespace. However, without a way to monitor and capture events, this rich source of diagnostic information cannot be leveraged.
There are a number of ways to accomplish this task, including .NET applications (well suited to formal monitoring applications) and PowerShell (more suited to ad hoc and exploratory work, as is common when tracking down issues). Exercise 10-3 demonstrates how to capture and display WMI events using a .NET console application.
Exercise 10-3. Capturing WMI Events Using a .NET Application
Browsing Performance Counters
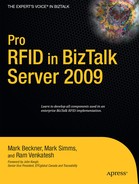
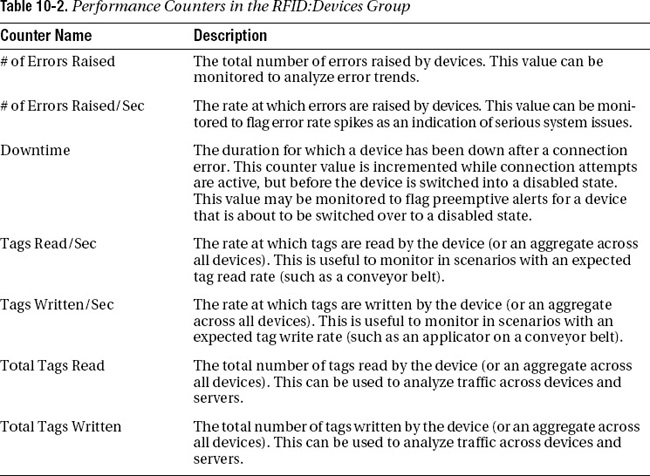
BizTalk RFID uses a variety of performance counters to track key metrics related to performance, events, processes, and devices. Tables 10-2 and 10-3 provide a breakdown of the key performance counters in the RFID:Devices and RFID:Processes groups.
Exercise 10-4 provides a walkthrough of how to view the RFID process counters using Windows Performance Monitor.
Exercise 10-4. Viewing RFID Process Counters
This exercise will demonstrate how to view RFID related process counter information using Performance Monitor (perfmon).
- From the Vista search bar or a console window, type perfmon, and then press Enter.
- From the Reliability and Performance Monitor, select Monitoring Tools, and then Performance Monitor.
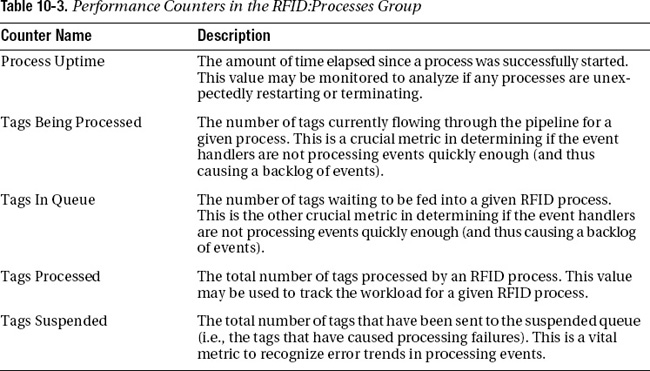
- From the Performance Monitor, click the Add button (or press Ctrl+Shift+I) to bring up the Add Counters dialog, as shown in Figure 10-1.
- From the list of available counters, click the caret (^) to open the list of individual counters in the RFID:Processes group. Click the Tags Processed counter. Under the “Instances of selected object” list, click <All instances>. Click Add to add that list to the “Added counters” list.
- After adding all of the counters you want to track, click OK.
- Using any of the techniques you’ve learned throughout the course of this book, push some tags through any process (either with a real or simulated reader, or by using the View Tags
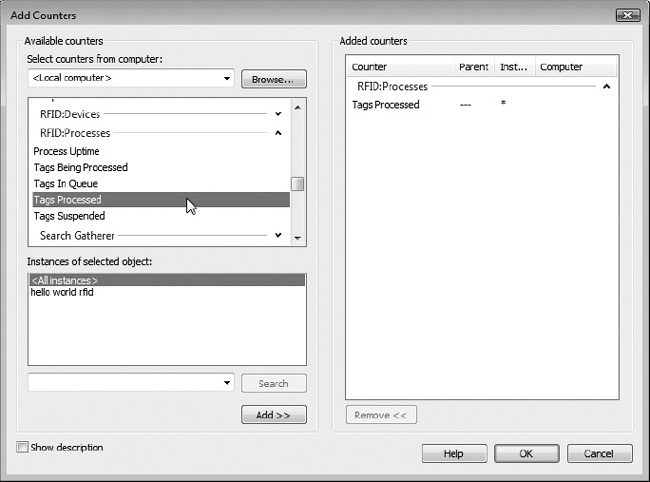
- As tags are added to the process, the results should be reflected in the performance counter graph, as shown in Figure 10-2.
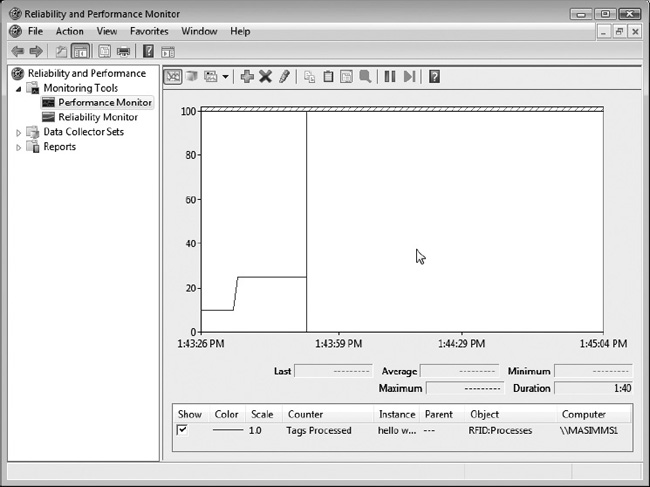
Figure 10-2. Displaying the Tags Processed performance counter
Tailing a Log File
Another important tool to have when developing or diagnosing issues with BizTalk RFID is one that allows you to view the contents of a log file as they appear (i.e., viewing the “tail” of the file). There are a number of utilities that provide this functionality; one that we have found to be very useful is BareTail, from Bare Metal Software (www.baremetalsoft.com/baretail/).
This utility (which comes in free and registered versions) provides several useful features, such as dynamic viewing of file contents, keyword highlighting, and the ability to view multiple files in a tabbed format. Since BizTalk RFID performs log file rotation during restart, the ability to automatically reopen a file is very useful (i.e., when the log file is rotated, open the new log file without requiring any user intervention). Figure 10-3 shows BareTail being used to trace the RfidServices log (the BizTalk RFID service log file) and a provider log, with error records highlighted in red.
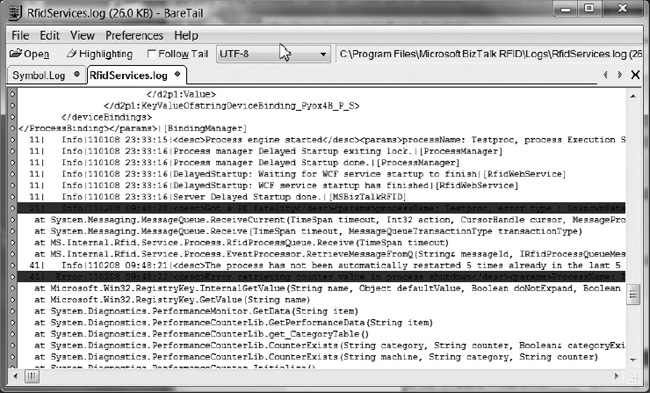
Figure 10-3. Using BareTail to view server log files
Peeking Inside a BizTalk RFID Application
BizTalk RFID applications have a lot of moving parts; both physical (readers, tags, assets, networking equipment, power) and virtual (providers, logical devices, processes). Troubleshooting these systems can be challenging without knowing the available diagnostic tools and instrumentation, as well as how to approach troubleshooting in a consistent, methodical manner.
This section provides an overview of all of the available data-gathering points that allow you to get a glimpse of the inner workings of an RFID application running on top of BizTalk RFID. These information sources will be used in subsequent sections to track down and resolve issues in your applications.
As shown in Figure 10-4, there are many moving parts in a typical BizTalk RFID application, in addition to the management interfaces exposed by RFID Manager and rfidclientconsole.exe (as covered in Chapter 4), and the synchronous command API (as covered in Chapter 6).
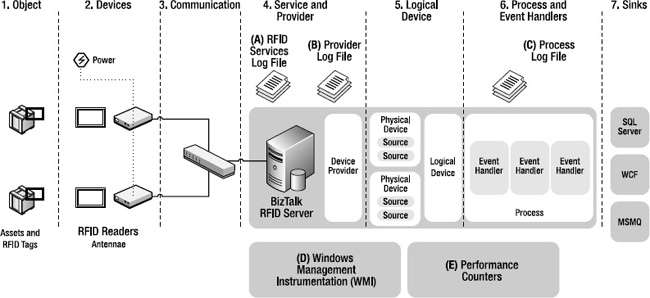
Figure 10-4. BizTalk RFID application instrumentation
The information available from each of these sources is described following.
BizTalk RFID Server Log Files
The BizTalk RFID Server log file (found in BizTalk RFID ServerLogsRfidServices.log) is the primary source of information about the workings of the underlying RfidServices service. The logging level for the BizTalk RFID service may be adjusted between error, warning, info, and verbose, as demonstrated in Chapter 4 via RFID Manager.
For example, as shown in Figure 10-5, the services log directory contains the current RfidServices.log log file, as well as all of the previous provider log files. The provider log files are rotated when the service is restarted.
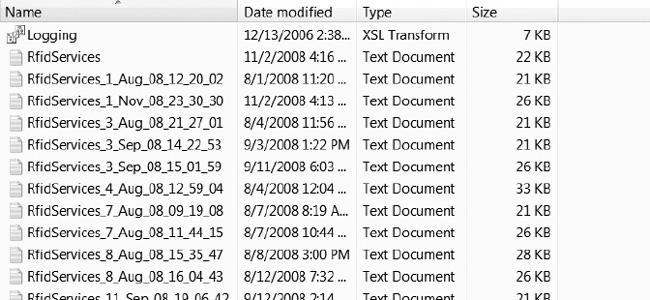
Figure 10-5. RFID service log files
A snippet of the content of this sample services log is shown in Listing 10-4. Therein you can see a snippet of the standard startup sequence.
Listing 10-4. Snippet of a Sample Services Log
4|    Info|110208 16:16:44|Server Info:

BANNER

SERVER NAME: MASIMMS1

SERVER VERSION: 3.6.0.0

SERVER LOCATION: C:Program FilesMicrosoft BizTalk RFIDinRfidServices.exe

FILE VERSION: 3.6.5022.0

OS VERSION: Microsoft Windows NT 6.0.6001 Service Pack 1

NT PROCESS ID: 3340

SERVICE ACCOUNT: MASIMMS1RfidSvcAcc

STORE LOCATION: MASIMMS1

STORE NAME: RFIDSTORE

|[MSBizTalkRFID]

   4|  Info|110208 16:16:45|Got store Info: RFIDSTORE status: 65536 status2:

 1627389952|[MSBizTalkRFID]
4| Info|110208 16:16:50|SKU information: Type=Developer,
MaxDeviceCount=-1|[MSBizTalkRFID]
4| Info|110208 16:16:50|SKU information: IsClusteringSupported=True,
IsMachinePartOfCluster=False|[MSBizTalkRFID]
4| Info|110208 16:16:50|SKU: The expiry date in the registry (as a string)
is -1|[MSBizTalkRFID]
4| Info|110208 16:16:50|SKU: This SKU has no expiry date|[MSBizTalkRFID]
4| Info|110208 16:16:50|Using data dir C:Program Files
Microsoft BizTalk RFID|[MSBizTalkRFID]
4| Info|110208 16:16:50|Resource Manager Startup done|[MSBizTalkRFID]
4| Info|110208 16:16:50|Component Manager Startup done|[MSBizTalkRFID]
4| Info|110208 16:16:50|Starting up security manager|[SecurityManager]
4| Info|110208 16:16:50|Starting up provider manager|[ProviderManager]
4| Info|110208 16:16:51|Started provider manager|[ProviderManager]
4| Info|110208 16:16:51|Provider manager startup done|[MSBizTalkRFID]
The services log file records are composed of several columns delimited by | characters. As shown in Listing 10-4, the columns are the thread ID, the log level, the timestamp, the log message, and the logging component.
Usually, when delving into the provider log file is required, it involves searching for error codes or messages. Use the techniques and tools described in this chapter, such as Windows PowerShell and BareTail, to assist in this task.
Provider Log Files
As all RFID applications are based on the ability to capture information from the physical world via RFID readers and tags, the ability to connect to these devices and receive data is critical to every RFID system. Each registered provider on a BizTalk RFID server has its own log file. (Even if two copies of the same provider are registered, each will have its own log file.) The logging level for each provider may be individually adjusted between error, warning, info, and verbose, as demonstrated in Exercise 4-3 via RFID Manager.
Each vendor has complete control over the information written in the provider log file, including how much information is written at each logging level. These files typically contain information about DSPI layer calls made into the provider for a given reader.
![]() Note All readers running on a specific provider will write into a single log file. The reader name will be one of the header columns for each log file entry.
Note All readers running on a specific provider will write into a single log file. The reader name will be one of the header columns for each log file entry.
These log files are found in the BizTalk RFIDProvidersProvider NameProvider Name.log directory. For example, as shown in Figure 10-6, the LLRP provider directory contains the current LLRP.log log file, as well as all of the previous provider log files. The provider log files are rotated when the provider (or service) is restarted.
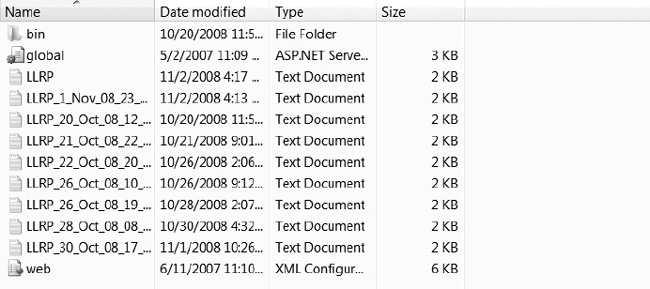
Figure 10-6. Provider log file list
A snippet of the content of this sample provider log is shown in Listing 10-5. Therein you can see a sequence of commands executed against a particular reader.
Listing 10-5. Snippet of a Sample Provider Log
18|   Info|110208 16:17:24|Server Info:

BANNER

SERVER NAME: MASIMMS1

SERVER VERSION: 3.6.0.0

SERVER LOCATION: C:WindowsassemblyGAC_MSILMicrosoft.Rfid.Util

3.6.0.0__31bf3856ad364e35Microsoft.Rfid.Util.dll

NT PROCESS ID: 3340

SERVICE ACCOUNT: MASIMMS1RfidSvcAcc|[LLRP]

  18|  Info|110208 16:17:24|LogLevel: Info|[LLRP]

  18|  Info|110208 16:17:41|About to start dedicated thread

 GetProviderMetadata13|[LLRP]

  13|  Info|110208 16:17:42|DedicThr About to invoke GetProviderMetadata|[LLRP]

  13|  Info|110208 16:17:47|DedicThr Finished invoke GetProviderMetadata|[LLRP]

  18|  Info|110208 16:17:47|Successfully regained control from dedicated thread

GetProviderMetadata13|[LLRP]

   3|  Info|110208 16:17:47|LLRP being intialized|[LLRP]

   3|  Info|110208 16:17:51|Using port 5084 to listen for incoming Llrp connection

|[LLRP]

   3|  Info|110208 16:17:51|Supports IPv4 for listening connection|[LLRP]

   3|  Info|110208 16:17:51|Supports IPv6 for listening connection|[LLRP]

   3|  Info|110208 16:17:52|Found a unicast IPv4 addresses adapter name:Wireless

Network Connection. Address:192.168.1.2|[LLRP]

   3|  Info|110208 16:17:52|Found IPv4 adapter, that is up and supports multicast.
adapter name:Wireless Network Connection, index:33663168|[LLRP]
3| Info|110208 16:17:52|Number of relevant NICs found:1|[LLRP]
3| Info|110208 16:17:52|selectedAdapterId:{F1BBA902-024B-44C6-AFA2-
AACAE9B56A8A}|[LLRP]
15| Info|110208 16:18:02|Starting the WS-Discovery|[LLRP]
The provider log file records are composed of several columns delimited by | characters. As shown in Listing 10-5, the columns are thread ID, log level, timestamp, log message, and logging component (in this case, the name of the provider).
Process Log Files (Event Handlers)
The third key log file when performing diagnostics on a BizTalk RFID application is the process log file, found in BizTalk RFIDProcessesProcess NameProcess Name.log. As with the other log files, the file contents are rotated when the process (or service) is restarted. The logging level for each process may be individually adjusted between error, warning, info, and verbose via RFID Manager in a fashion similar to changing a provider’s logging level.
The contents of these process files are an aggregate of the logging output from each of the event handlers registered in the process. Since multiple instances of the event handlers in a given process may be running in parallel, strictly looking at the log file in temporal order may be confusing (especially in higher-volume scenarios). In these cases, it may be useful to filter by thread ID when tracing the path of a specific event through a process.
Listing 10-6 provides a snippet of the content of a process log, showing the output from the SqlServerSink component. Of particular note are the bolded lines in the log file, showing the received tag ID and data.
Listing 10-6. Snippet of a Sample Verbose Process Log Using the SqlServerSink Component
   1|Verbose|110308 13:52:17|PostEventToSink called with

<tag>

  <rfidEventBase>

    <VendorSpecificInformation>

      <properties></properties>

    </VendorSpecificInformation>

  </rfidEventBase>

  <observation>

    <time>11/3/2008 1:52:17 PM</time>

    <sourceName></sourceName>

    <deviceName>West Door</deviceName>

  </observation>
<tagId>g4k=</tagId>
<tagType>EPC Class 0 tag</tagType>
<tagData>q82DiQ==</tagData>
<tagSource></tagSource>
<tagTime>11/3/2008 1:52:17 PM</tagTime>
<dataSelector>
<tagDataSelector>
<isId>True</isId>
<isData>True</isData>
<isType>True</isType>
<isTime>True</isTime>
<isNumberingSystemIdentifier>True
</isNumberingSystemIdentifier>
</tagDataSelector>
</dataSelector>
</tag>|[SqlServerSink]
|[SqlServerSink]
1|Verbose|110308 13:52:17|Executing command PostTagReadEvent
Parameters
Name @tagID Value System.Byte[] Dir Input
Name @tagType Value 1 Dir Input
Name @tagTypeDescription Value EPC Class 0 tag Dir Input
Name @tagSource Value Dir Input
Name @tagTime Value 11/3/2008 1:52:17 PM Dir Input
Name @tagData Value System.Byte[] Dir Input
Name @processName Value Test Dir Input
Name @deviceName Value West Door Dir Input
Name @logicalDeviceName Value West Door Dir Input
Name @extData Value
<VendorSpecificInformation
xmlns:i="http://www.w3.org/2001/XMLSchema-instance" xmlns="http://schemas.dataco
System.IO.SensorServices.Rfid.Client">
dictionary xmlns:d2p1="http://schemas.microsoft.com/2003/10/
Serialization/Arrays" />
</VendorSpecificInformation> Dir Input
|[SqlServerSink]
1|Verbose|110308 13:52:17|Removing item 7563067 from the processEventFTQ q|[Test]
![]() Note One practical impact of enabling verbose logging on a process is that the volume of information logged can become very large very quickly. This can have substantial performance implications, especially in low-latency applications.
Note One practical impact of enabling verbose logging on a process is that the volume of information logged can become very large very quickly. This can have substantial performance implications, especially in low-latency applications.
WMI for RFID
BizTalk RFID–related management events and information live in the
ootMicrosoftRfid namespace within WMI. This management space contains a number of different events that are raised when the triggering BizTalk RFID event is raised, either through a provider or the server itself. Similar to how data-related events are surfaced and channeled through event handlers in processes, management events are surfaced through the WMI channel.
![]() Note Some events are available through both channels; however, event handlers are primarily focused on data-related events in the context of a business process, as opposed to managing a server.
Note Some events are available through both channels; however, event handlers are primarily focused on data-related events in the context of a business process, as opposed to managing a server.
Troubleshooting BizTalk RFID
Since there are so many moving parts in an average RFID system, a methodical or component-centric approach is often helpful in ruling out the usual suspects. While many of the checklists in the following sections may seem terribly obvious, it has been our (sometimes painfully gained) experience that the simplest and most obvious assumptions often cause the most pain.
One other observation you might draw from these checklists is that certain symptoms may be a factor of any number of root causes. The checklists are broken down as shown in Figure 10-7.
![]() Note If you had to pick one thing to remember from this book, remember this: always test your application with real readers, real tags, and real assets in as close to a real environment as you can. All of the bench-top testing with simulators and software can test how the logic of your application will behave. It cannot tell you how your readers will perform on site with noise, dust, and errant forklifts. All of the software in the world cannot help if the readers don’t read in the real world.
Note If you had to pick one thing to remember from this book, remember this: always test your application with real readers, real tags, and real assets in as close to a real environment as you can. All of the bench-top testing with simulators and software can test how the logic of your application will behave. It cannot tell you how your readers will perform on site with noise, dust, and errant forklifts. All of the software in the world cannot help if the readers don’t read in the real world.
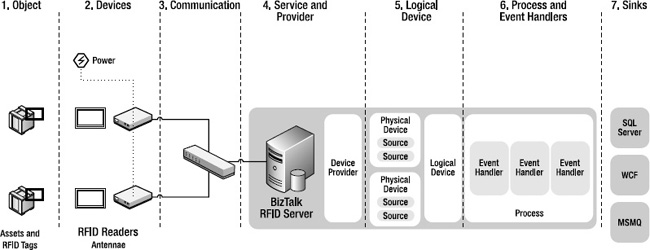
Figure 10-7. Functional components of an RFID system
RFID Devices
The following list details some common symptoms of issues with RFID devices:
- Tag reads are not received in BizTalk RFID processes, or tag read performance is inconsistent.
- Processes or synchronous applications in BizTalk RFID cannot open connections to registered readers.
- Input events, such as breaking a light stack, are not received.
- Output changes, such as light stacks, are not changing state.
The following list outlines some things to check for in case of connectivity or device issues:
- Is the RFID reader receiving power? While this may seem like the most obvious of steps, if the readers don’t have a stable power supply, then no amount of troubleshooting software will result in a working system. Specific questions to ask are as follows:
- Is the status LED of the reader green? Some readers use different LEDs and different light codes to indicate their state—make sure you are familiar with the specifics of your chosen readers.
- Is the power supply secured to the reader? As opposed to most forms of consumer electronics, fixed RFID readers tend to have mechanical supports for the power supply. Be sure to review the operator’s manual for your hardware for the proper method of connecting the power supply.
- Are the antenna cables properly connected to the reader (in the case of readers with external antennae)?
- Are the antenna ports enabled on the reader? Typically, readers will disable ports to which antennae are not connected. Some will periodically scan for new antennae and reenable the ports automatically, whereas others require the ports to be manually enabled.
- Are the correct number of antennae connected to the appropriate ports? Most readers require antennae to be connected in a specific order. Depending on whether the antennae configuration is monostatic, bistatic, or multistatic, different numbers of antennae may need to be connected.
- Is the reader properly configured for the scenario?
- Is the correct protocol enabled? If you have EPC Gen 2 tags but the reader is configured for older UHF protocols, the reader won’t pick up the tags.
- Is the antenna gain set to an appropriate value? If the antenna is turned down too low (or the attenuation is set too high), the antenna will not emit enough power to energize tags.
- For EPC Gen 2 scenarios, key values such as the Q setting are critical. Be familiar with how the various configuration settings for your particular reader affect read performance.
- Are the digital I/O ports properly wired, powered, and grounded?
- Some readers require that the digital I/O ports be supplied with an independent power source. Make sure this source is properly wired and connected.
- Use a meter (such as a multimeter or oscilloscope) to determine if the output ports are changing state (i.e., do not depend on the light stack—it may be nonfunctional).
- If using a switch to test the input port trigger, ensure it is properly grounded to the same ground plane as the I/O ports.
Tags and Objects
After verifying that the reader is powered, the antennae are properly connected, and the reader is properly configured for your tag type and scenario, the next issue sources to investigate are the tags and tagged objects themselves.
Here are some common symptoms of issues with tags and tagged objects:
- Tag reads are not received in BizTalk RFID processes, or tag read performance is inconsistent.
- Writing to tags (commissioning) fails or is inconsistent.
And here are some things to check for:
- Can the RFID reader read the tags in “free space”?
- When holding an RFID tag up to the antenna to check to see if it can be read, be sure not to hold onto the antenna directly. If you do, your body becomes part of the antenna (in an electromagnetic sense) and can soak up the energy that would be used to power the tag.
- If the tag cannot be read in free space, make sure the reader is properly configured (as per the previous section) and the tag itself is valid (either by validating on another reader or using a larger set of test tags).
- Are the tags properly aligned in the read field of the antenna?
- When working with linear antennae (either horizontal or vertically aligned), if the tags are passing through in a perpendicular manner, they won’t receive enough RF to energize. If your scenario has tags passing through in an inconsistent orientation, switch to using circular antennae.
- Is tag shadowing occurring? If you have multiple tags passing through the read field simultaneously but you only see some of the tags, it may be a result of shadowing. Shadowing refers to the situation wherein two adjacent tags are either touching or close enough for their antennae to “meld.” If this is the case, change the orientation and application of the tags to prevent tags from butting up against each other. This issue is common in pallets with stacked boxes.
- Is the material or content of the tagged object interfering with the tag?
- A common result of tagging objects containing metal or water, these materials can detune the tag’s antenna or absorb the RF energy needed by the tag.
- If tags can be read in free space but a drastic performance drop is observed when the tag is applied to the asset, experiment with alternate placement on the object (look for air pockets and other areas on the object that may have a lower water or metal content) or investigate the use of tags with special encapsulations designed for such applications.
Communication
Assuming that the readers are properly reading tags, the next step in the chain is to confirm that there is a valid communication path between the BizTalk RFID server and the reader. Most of this section assumes Ethernet and IP, with special notes for USB and Bluetooth connections.
The following are some common symptoms of issues with communication:
- Applications can execute synchronous commands through BizTalk RFID, but RFID processes do not receive tag read events.
- Processes or synchronous applications in BizTalk RFID cannot open connections to registered readers.
Here are some things to check for:
- For an Ethernet interface, is the link valid? Check the hub and the cable to ensure that the link is active.
- If the RFID reader is using DHCP to receive its address (not recommended without a static lease), does it have the expected address, net mask, and gateway? Most fixed readers support a serial connection—if you cannot get into the reader’s network management console, use the serial console to double-check network settings.
- Can the RFID reader receive a ping from the BizTalk RFID server? Can a telnet connection to port 80 be established (assuming the reader supports an HTTP management interface)?
- If a connection cannot be established, check the appropriate routing tables between the BizTalk RFID server and the RFID device.
- If a connection cannot be established, check the firewall on the BizTalk RFID server.
- If a connection can be established, but no events are received in an RFID process, check the firewall on the BizTalk RFID server. Most RFID readers use a separate notification channel that pushes events into the BizTalk RFID server.
![]() Note Most fixed RFID readers support an RS232 (serial) connection. While this may seem like an old-school throwback, it is often the first and best available option for troubleshooting network connectivity issues. From the serial interface, most readers will allow configuration of the network settings (DHCP, static) as well as the ability to view low-level reader diagnostics.
Note Most fixed RFID readers support an RS232 (serial) connection. While this may seem like an old-school throwback, it is often the first and best available option for troubleshooting network connectivity issues. From the serial interface, most readers will allow configuration of the network settings (DHCP, static) as well as the ability to view low-level reader diagnostics.
Service and Providers
After having confirmed that the reader side of the system is working correctly (readers are available and tags are being read), the next step is to confirm that the BizTalk RFID service and connectivity layer are functioning correctly.
Here are some common symptoms of issues with services and providers:
- In the RFID Manager MMC snap-in, no connection can be established to the target BizTalk RFID service.
- The connection to the reader fails during initial setup in RFID Manager.
- The service is running, but providers or processes start up and immediately shut down.
Here are some common things to check for:
- If the BizTalk RFID service isn’t running, start it either from Administrative Tools
- Information about service failure on startup will be in the event log and the RFID Services log.
- If you have verified network connectivity with the reader but cannot connect through BizTalk RFID, then the provider/reader firmware may not be compatible.
- Check the provider installation documents to ensure that your firmware version is compatible with the provider version.
- Download and install new versions of the provider and/or firmware if necessary.
- An excellent resource to inquire about hardware- and provider-related issues is the MSDN forum for BizTalk RFID (
http://social.msdn.microsoft.com/forums/en-US/biztalkrfid/threads/).- One of the specific challenges that can arise is on Windows Server 2003 installations, in which IIS acts as the isolated process host. In some situations (especially on shared boxes with other IIS-hosted applications), the application pool that supports BizTalk RFID may be corrupted or changed. One of the key symptoms of this is that the bits hosted in IIS (the processes and providers) start up, but immediately shut down again. To diagnose if IIS changes are related to weirdness in the BizTalk RFID application, look at the IIS version log to determine if any recent changes have been made. To enable configuration change versioning (formally known as metabase auditing) on IIS 6.0 or greater, please consult the IIS documentation.
![]() Note One practical result of the dependency on IIS is that backing up the IIS metadata store is an important part of backing up your BizTalk RFID configuration. Especially when working in a shared server environment with other administrators in which users have access rights to the IIS server, ensure that the IIS metabase and application pool settings are not corrupted.
Note One practical result of the dependency on IIS is that backing up the IIS metadata store is an important part of backing up your BizTalk RFID configuration. Especially when working in a shared server environment with other administrators in which users have access rights to the IIS server, ensure that the IIS metabase and application pool settings are not corrupted.
Logical Devices and Process Binding
At this point, we have validated that the readers are reading and connected to BizTalk RFID. Logical readers are used to create logical groupings of information sources that are abstracted from the physical readers and antennae. Used properly, logical devices are a powerful tool for mapping event sources into processes and creating metadata based on that association (such as a location or portal).
However, if the appropriate sources or devices are not properly bound to the target RFID process, events (e.g., TagReadEvent and TagListEvent) will not show up in said process. Some common symptoms of issues with logical devices and binding are as follows:
- Tag read events are visible from the View Tags dialog, but are not processed by your event handlers.
- Given a reader with two antennae bound to an RFID process, tag read events from one antenna are received, but not the other.
Here are some things to check for:
- If using a hard link, are the sources explicitly bound to the process?
- Open up the process definition in RFID Manager and examine each logical device.
- Verify that the individual sources are hard-linked into at least one of the logical devices.
Event Handlers
At this point, events are flowing through into your process and being picked up by the event handler. However, the event handlers do not appear to be processing, filtering, enriching, or posting to sinks properly. At this point, be happy—it’s a software problem. Here are some common symptoms of issues with logical devices and binding:
- Events are flowing into a process, but are not properly filtered (all tags are filtered, the wrong tags are filtered, etc.).
- For the stock
SqlServerSinkevent handler, events are not being posted to the rfidsink database.- The process starts up, but shuts down with an exception message in the process error log.
- For custom event handlers, the event handler code never seems to trigger.
Here are some things to check for:
- Event handlers deemed “sinks” are intended to be the end of the line for events; that is, they do not pass events on to the next handler in the chain. If you have a component that is not receiving any events, make sure that it is not chained after a sink.
- The OOB event handler
SqlServerSinkis the usual suspect of sinks in most applications. It’s a very robust event handler, but there are a couple of things to watch out for:
- The
SqlServerSinkevent handler creates the rfidsink database. This means that the RfidSvcAcc account (or the hosting process account identity) needs to have sufficient privileges in the target database to create the database, establish the schema, and so on.- If portions of the incoming tags are invalid (such as an empty
DateTimefield or a value ofDateTime.MinValue), theSqlServerSinkevent handler will throw an unhandled exception and kill the process.- When developing custom sinks, there are a couple of important considerations, especially if you aren’t seeing events show up:
- The most efficient way to debug an event handler during development is to attach the Visual Studio debugger. On Windows XP/Vista machines, this is fairly simple (attach to
RfidServices.exe); however, on Windows Server 2003 machines, the process name can be somewhat difficult to track down.- The best way to handle this is to embed a
Debugger.Launch()statement within theInitmethod of your event handler (only during development).- Ensure that you have event handler methods assigned to each of the appropriate event types you want to capture (
TagListEvent,TagReadEvent[], etc.).- When filtering tags, remember that the event collections you receive cannot be directly edited. You need to create a new collection, add in the tags you want to keep, and pass the new collection along the pipeline.
- Logging is the lifeblood and dynamic savior of your event handler. If the event handler takes an action that would be a valuable diagnostic tool in the field, log it.
- The only exceptions that an event handler is allowed to throw are those derived from
RfidException. Exceptions not deriving fromRfidExceptionthat are uncaught and bubble up to the service will cause the process to be shut down.
- When calling into other pieces of code, ensure that all exceptions are caught and rethrown wrapped in an
RfidException.- The event handlers are running with the identity of the hosting account (usually RfidSvcAcc). When making calls to external services or data stores (such as SQL, MSMQ, WCF, etc.), the privileges that the event handler has while running are different from those that your development account has during testing.
- Ensure that the RFID process account has all of the requisite permissions to access external services and data stores. This is a very common source of security and permissions issues.
- Event handlers are inherently multithreaded (i.e., multiple instances of the event handler run in parallel to improve throughput). If the event handler uses any shared resources (such as a tag table), make these resources thread safe through a
Monitoror other synchronization object.
Sinks and External Applications
By this point, all of the RFID-specific aspects of your application should be working. However, until events can be reliably delivered to external systems, the application isn’t truly complete. Most of the issues encountered when posting data to external applications are security- or connectivity-related. Here are some common symptoms of issues with logical devices and binding:
- Events are flowing into a process, but do not show up in a target MSMQ queue.
- This is either a formatting or a permissions issue. By default, when an MSMQ queue is created, permissions need to be explicitly added. Ensure that the RfidSvcAcc account is added with write permission.
- Events are flowing into a process but do not show up in a target SQL table.
- Ensure that either the RfidSvcAcc account has the appropriate privileges in the target table (for Windows authentication in the connection string) or the connection string contains the correct embedded user authentication.
- Ensure that the SQL commands are valid.
Conclusion
Diagnosing issues in a BizTalk RFID application can be potentially overwhelming. However, by breaking down the system into its components and isolating issues, the complexity can be managed and overcome.
Always test in as real an environment as possible before going live—this means real hardware, real tags, real objects, and as real a physical environment as possible. RFID applications aren’t just software projects—the “physics” side of RFID can sink any project if due care and attention are not given.
In any troubleshooting scenario, always remember these basic principles:
- Challenge every assumption. Continually question what you know and how you know it. Positive thinking, such as “of course that outlet has power,” may help you feel better about the situation, but it won’t get you any further toward resolving the problem.
- Start with the basics, work from the tags out, and independently verify each link in the chain. Validate that readers can see tags, readers can communicate with middleware, and middleware can process events.
- Use the right tool for the job. Each of the links in the RFID application chain have hooks for observing and validating their behavior. Use the hook—be it a log file, interactive RFID reader console, or network trace—that provides the highest amount of information for the least amount of noise.
The techniques and processes demonstrated in this chapter are an excellent starting point in identifying, understanding, and resolving issues with RFID applications.
Through the course of this book, you have learned how to develop, deploy, and diagnose an end-to-end RFID-enabled distributed system. Take this new knowledge and go forth into this untamed vastness, bringing the order of asset visibility where now lies only the chaos of clipboards!
All melodrama aside, you should now have a solid foundation for implementing real-world asset visibility applications using RFID on the BizTalk Server platform. Put this knowledge to work developing applications that bridge the digital and physical worlds. For more information about RFID and BizTalk Server, visit the BizTalk Server Developer Center on MSDN at http://msdn.microsoft.com/en-us/biztalk/default.aspx.
CASE STUDY: TRACING FISH FROM THE CRADLE TO THE OVEN
Industry: Fishing.
Overview: An Asian fish producer uses BizTalk RFID to track fish from the hatchery, through the sales channel, to the end customer. Additionally, it tracks core information pertaining to the life cycle and environment of the fish itself. An RFID tag is embedded on the fish while alive, and travels with it during its life, through the time it is caught, up until the delivery to the purchasing distributor or restaurant. Key environment variables are tracked, including water temperature, chemical content of the water, air temperatures, and feeding history. All of this information is available through a reporting dashboard that enables all parties involved to have insight into all available details about the individually purchased fish.
Results: Having detailed information about the individual fish allows for a greater price margin to be placed on it, especially for high-end lines. End customers, who value specific traits in what they are about to digest, are inclined to pay a premium for fish that are of a specific quality with a known history. Additionally, having the ability to track the fish from the hatchery to the end destination ensures improved efficiencies in handling, distribution, and delivery.