![]()
Quality of Service
In my experience, the main causes of SharePoint performance and response issues noticed by users are not a result of SharePoint being at fault at all. They are a result of network or SQL Server issues. In my early years, I would often be frustrated when trying to troubleshoot the vague message from the help desk that “SharePoint was slow.” All of the SharePoint and Windows event logs were fine. Eventually, some network or SQL Server guy would casually mention that they were having some performance issues that day. That SharePoint is so dependent on these two other tiers is now something I am well aware of, so it’s one of the first places I go if I think the quality of service problem is being caused by something outside of the application itself.
The evolution of computers and networks toward Internet-based applications leaves no doubt about the important role they are playing in organizations expecting a more service-oriented architecture (SOA). The quality of these new services will be a key issue for their wide deployment, and this quality is determined by the opinion of the users in your organization. The best quality of service (QoS) is not the highest but the most suitable to the different users’ needs. In order to provide a suitable level of QoS, the SharePoint administrator needs to know which relevant network parameters have impact on the quality as it is perceived by the users.
A SharePoint farm does not exist in isolation; its main dependency is the network it is sitting on. While high availability and disaster recovery for Windows networks are beyond the scope of this book, I can talk about network QoS in relation to SharePoint. All your user requests for pages go via the network. If it is performing slowly, then SharePoint will appear slow. If it slows to the point where it affects user experience, the perceived availability of SharePoint is affected. By understanding and improving the environment SharePoint exists in, you can make SharePoint more highly available. This chapter will look at the methods you can use to improve the quality of service you offer your users. Some of them include:
- WAN optimization
- Centralized versus regional SharePoint deployment
- Caching
Why Quality of Service Is Essential
QoS is composed of the mechanisms that give network administrators the ability to control the mix of bandwidth, delay, variances in delay (jitter), and packet loss on their network in order to:
- Deliver a network service such as Voice over IP (VoIP).
- Define different service-level agreements (SLAs) for divisions, applications, or organizations.
- Prioritize traffic across a WAN.
QoS gives the network administrator the ability to prioritize traffic and allocate resources across the network to ensure the delivery of mission-critical applications, especially in heavily loaded environments. Traffic is usually prioritized according to protocol. So what is the benefit of prioritizing traffic?
A simple metaphor is the high-occupancy vehicle lane (also called an HOV or carpool lane) on the highways in America. If you’re not from the USA or otherwise unfamiliar, in a large multilane highway, one lane is marked with a white diamond and the only traffic allowed in this lane are vehicles with more than two or more occupants.
For business applications, you want to give high priority to SharePoint if it has become a mission-critical application. All other traffic can receive equal treatment. Mission-critical applications are given the right of way at all times. Video and audio streaming applications take a lower priority. Bandwidth-consuming applications, such as file transfers, can receive an even lower priority. In Figure 5-1, the cars on the right are SharePoint traffic that has been given its own on ramp and special lane (with white diamonds) to travel in where there is less traffic. The cars on the left represent file transfers, video, and audio files.
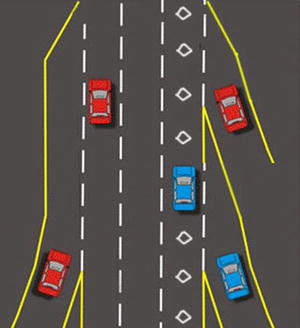
Figure 5-1. Cars on the left are low priority traffic, cars on the right are high priority
There is a wide range of QoS services. Queuing, traffic shaping, and filtering are all essential to traffic prioritization and congestion control. These also determine how a router or switch handles incoming and outgoing traffic. QoS signaling services determine how network nodes communicate to deliver the specific end-to-end service required by applications, flows, or sets of users. QoS is required wherever there is congestion. QoS has been a critical requirement for the WAN for years. Bandwidth, delay, and delay variation requirements are at a premium in the wide area.
LAN QoS requirements are emerging with the increased reliance on SharePoint as a mission-critical application and the growing popularity of voice over LAN and WAN, which use more bandwidth. The importance of end-to-end QoS is increasing due to the rapid growth of intranets and extranet applications like SharePoint that have placed increased demands on the entire network.
But before we attempt to resolve these issues, let’s first look at user perception of poor QoS and its causes.
Perceptions and Causes of Poor QoS
When a user clicks on a link and it takes anything over 10 seconds, they perceive this as a problem with SharePoint. The target should be 1 to 2 seconds for standard pages, but even that is too much if many pages are required to do a simple task. For example, a user has to search for a site, add a task to it, and then update a calendar. That task should take them only 5 minutes, but if it requires them to render 15 different pages that each take 5 seconds to load, every minute has an additional 25% just waiting for pages to appear! This is because there are on average 3 page loads per minute to make up 15 pages in 5 minutes. If each page load takes 5 seconds, that’s an additional 15 seconds on top of 60 seconds, hence 25%. From a perception point of view, this is very frustrating: over a minute extra on a 5-minute task is unacceptable.
If loading a single page takes up to 30 seconds, you know you have a problem beyond just a nonoptimized network or application. What are the most common causes of delays? Delays can occur at any of the following levels:
- Client: Time it takes to render the page by user’s device and browser.
- Client-side LAN: Serving the page to the user’s device on their local network.
- WAN: Transferring the data over the wider network.
- Server-side LAN: Transferring data from server network.
- Server: Accessing and transferring data from the server.
Delays at all of these levels can be potentially caused by the following factors:
- Client:
- CPU/processor delay
- Virtual/physical memory limits
- NIC configuration, network drivers, and TCP/IP configuration
- Older client application versions
- Proxy server configuration
- Client-side LAN:
- Switch configuration
- Overutilization
- WAN:
- Link speed (bandwidth)
- Delay (latency)
- Packet loss, retransmissions, timeouts
- Network throughput
- Round trips
- Server-side LAN:
- Switch configuration
- Contention for uplink
- Server:
- CPU/processor delay
- Virtual and physical memory limits
- NIC/network drivers and TCP/IP configuration
- Network speed (10/100/1000MB)
- Server software layer
Examining a typical performance delay produces a result like the one in Figure 5-2. The largest portion of the delay occurs because of the wide area network (WAN).
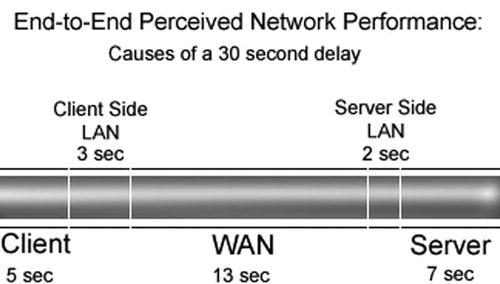
Figure 5-2. WAN causes largest portion of delays
While any or all of these can be the cause of your delays, the most likely culprit is the WAN. Let’s use an example of a manager in London opening a SharePoint page on a server in Sydney. Users in Sydney report this takes 12 seconds, but for the London user it takes over 2 minutes. Why should that be?
Applied Scenario: Flowers and Elephants
Fancy Flowers is a florist supply company. They have two offices, one in London and another in Sydney. The buyers are based in London and the flower suppliers in Sydney. When the flowers bloom, the suppliers upload photos of examples to the Fancy Flowers SharePoint portal called the Daisy Chain. Buyers in London open the images and place orders to buy the flowers.
This is the core business benefit of SharePoint to the company. It is essential to the buyers that the images open quickly. The buyers are currently complaining the photos are taking too long to open and this is seriously impacting their ability to order flowers quickly while they are still fresh. The photographs have to be high resolution; the average size is 4MB.
The suppliers upload the photos to the regional SharePoint server based in Sydney and when they open the photos, they open in about 12 seconds; in London, they take about 2 minutes to open. It is therefore taking 10 times longer to open the files in London. Buyers have to review hundreds of flowers so this is seriously impacting their efficiency while they wait for the photos to open.
The buyers are waiting for the photos to download to their client machine from the server all the way over in Sydney. Both offices are running on the same server hardware and client machines, as well as client software. This means you can rule out these items as being at fault. The next culprit to look at is the pipe, or bandwidth between the two offices.
The bandwidth available in both offices is 3Mbps (megabits per second). To calculate what that means in terms of download time, you do this: 3Mbps is .375MB per second, which is 4MB in 12 seconds. This is what users in Sydney are seeing, but not the users in London. The only difference is the distance between the Sydney server where the photos are stored and the London office. It is an approximately 10,000-mile (16,000 kilometer) journey each way between the two offices. Is this causing the delay? Figure 5-3 shows the journey the data was taking.
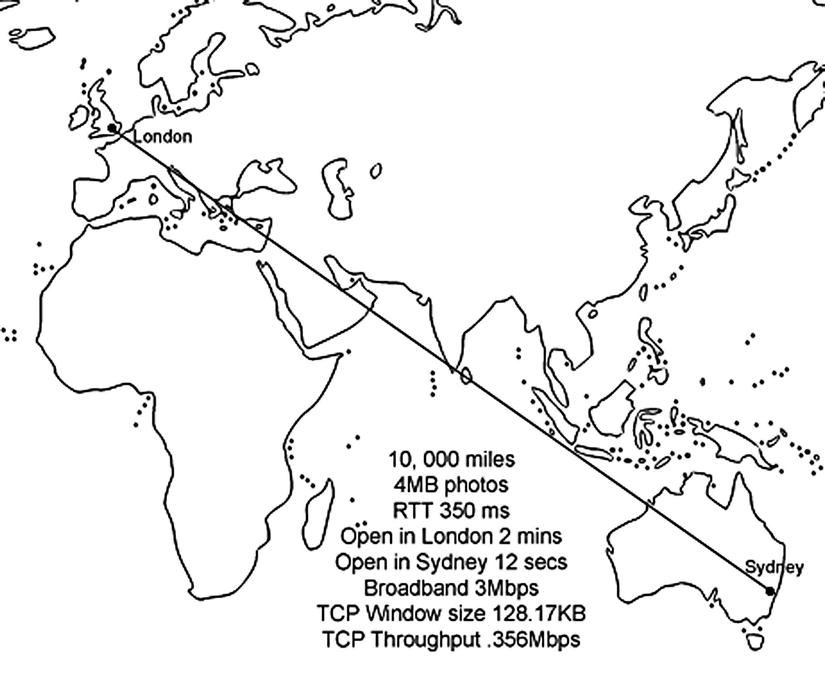
Figure 5-3. London to Sydney
Fiddlers, Pipes, and Pings: Measuring Tools
I’m sure you have seen the pipe metaphor being used to describe bandwidth. The image is of a big pipe between the offices with data flowing along it at the speed of light, since these are fiber optic cables. If light travels 186,282 miles (about 299,792 kilometers) in a second, why does it take 2 minutes to download a photo of an orchid?
As you should know by now, this is too simplistic a metaphor. A better metaphor might be water flowing down a hill: it twists and turns around obstacles, slows down and speeds up depending on the terrain, and some of it doesn’t get there at all.
For a start, light in a fiber optic cable is not traveling through a vacuum, so it’s only going 2/3 the speed of light, but the real delays are the hops between multiple routers and switches. A tool like Fiddler 2 (Figure 5-4) allows you to follow the course of your data as it makes the journey from source to destination (it’s freeware, available at www.fiddler2.com/fiddler2/).
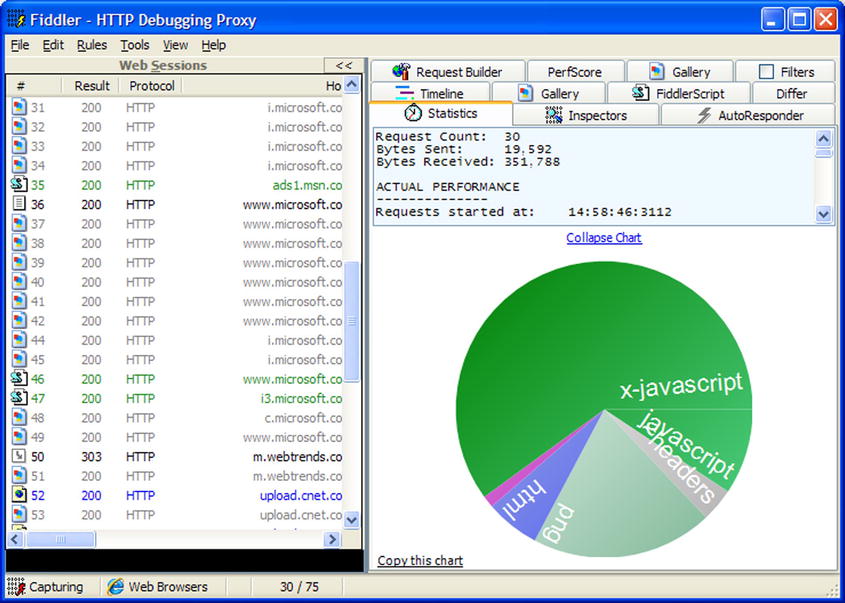
Figure 5-4. Metrics from Fiddler 2
Ping, a tool for measuring latency, indicates that the round trip time (RTT) from London to Sydney is 350ms. Strictly speaking, latency measures the time the trip takes one way, not round trip, but in the real world, the return journey is more important. If you recall the water-rolling-down-a-hill metaphor, you know some is lost along the way. In communication networks, the average rate of successful message delivery is called throughput. The Ping in Figure 5-5 is from Ireland, where I am writing this, to Apress in the US, likely in Virginia (I got this information from WHOIS). According to www.mapcrow.info, this journey is 4,240.70 miles (6824.56 kilometers), which is less than half the distance from London to Sydney (10,000 miles/16,000 kilometers) so this ping time roughly checks out with the ping time from Sydney to London and back of 350ms.

Figure 5-5. Metrics from a Ping. Average roundtrip from Ireland to Apress in US: 110ms
We will have to dig deeper to find the real reason data takes so long to transfer over physical distance. All web traffic, which includes SharePoint, travels via the Hypertext Transfer Protocol (HTTP), but that in turn travels over the Transmission Control Protocol (TCP). TCP is what really dictates how fast the traffic originating from SharePoint can travel.
TCP sets limits on the amount of data a computer can accept without acknowledging the sender. Think of it as the maximum number of party invitations from one person you can get without sending back any RSVPs. If the sender has not received acknowledgment for the first invitation (packet of data) sent, it will stop sending any more until it gets a reply. After a certain length of time, if it has not received a reply, it may resend. Why does it do this? Why not just assume the data was received and just keep sending? It doesn’t for the same reason you ask for RSVPs: you want to be sure the message has definitely been received. This is how TCP keeps data transmission reliable.
To get your real throughput, you use an equation like Figure 5-6. Don’t worry if you’re not very mathematically minded; I’m not either. I’ll not be including many formulae in this book.

Figure 5-6. The amount of data you get is limited by the TCP buffer and latency
Because of this waiting for a reply to maintain quality of communication over quantity, the full bandwidth available might not even be used. This buffer, for TCP, by default is only 64KB. So, it sends 64KB, then waits for a reply; if it gets one, it sends another 64KB. You can see that the latency of 350ms, or a third of a second for each packet to get from Sydney to London, is going to add up. This web site quickly calculates it for you: www.speedguide.net/bdp.php (Figure 5-7). Note that RWIN is the abbreviation for TCP Receive Window, which is the amount of data that a computer can accept without acknowledging the sender. BDP stands for the bandwidth-delay product.

Figure 5-7. Calculating BDP. Note that 1,000 kilobits is a megabit but 1,024 kilobytes is a megabyte
In this scenario, 3Mbps × 350ms = 128.17KB, which is double the 64KB size that is the recommended amount. But it’s not something you can control. Windows Server 2008 tries to automatically find the optimum TCP Window/RWIN/BDP size. It begins at ∼17.5Kbps and can go up to 16Mb. This can’t be manually tweaked, so you have to rely on the system to choose the right balance of speed and reliability.
Let’s work out the throughput and see if it explains the 2-minute download time in London vs. 12 seconds in Sydney. In Figure 5-8, you divide the TCP Window Size (128,170) by the round trip time in seconds (.35) and get a TCP throughput of .366Mbps.
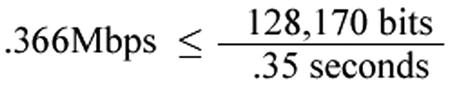
Figure 5-8. Calculating BDP
To work out how many kilobytes per second (Kbps) that is, multiply it by 1,024 (remember, there are 1,024 kilobytes in a megabyte, but only 1,000 megabits in a kilobit) then divide it by 8 (there are 8 bits in a byte). The result is 45.568Kbps. At that rate, a 4MB photo (which is 1,024 × 4 = 4,096 kilobytes) will take 87.43 seconds (divide 4,096 by 46.848). So that’s about a minute and a half. The other 30-ish seconds could be accounted for by lost packets and the fact that latency does fluctuate. Remember in Figure 5-2 there were other causes of delay, not just the WAN. The London latency figure of .35s RTT gives a best-case throughput of almost 9 seconds, not far behind the 12 seconds they experience.
Exploring Possible Solutions
There’s obviously a problem: QoS is too low for the users because it takes too long to open a photo. The problem has been isolated: it’s not with SharePoint or even with web applications in general; it’s even lower down the stack at the TCP and network layer. You now understand better why you have a problem, and you have some metrics to measure it better. The hard metrics you can’t control or change are:
- The sizes of the files: 4MB.
- The distance between the flower suppliers who upload the photos and the buyers who download them.
- How quickly the suppliers need to upload the photos and how quickly the buyers need to see them.
So what can you do to improve the quality of the service? The first thing most people would suggest is to increase the size of the pipe. In tests for the previous versions of SharePoint, Microsoft indicated that latency affects WAN performance until bandwidth becomes restricted at 512 kilobits per second and lower; a T1 line with a latency of 500 milliseconds provides about the same performance as a T3 line with the same amount of latency. For best performance over a WAN, Microsoft recommends that you target a bandwidth range of 3Mbps (Dual T1) or greater. Since you already have that, adding bandwidth will not significantly help with the time it takes to open a photo.
What if you used content deployment to transfer the photos from a site collection in Sydney to one in London overnight? The problem here would be what constitutes “overnight.” At 8 a.m. Monday, when the work week starts in Sydney and the producers are uploading new photos of flowers, it is still nine hours earlier, or 11 p.m. Sunday night in London. By the time the producers have uploaded a day’s worth of photos in Sydney at 6 p.m. their time, it is now only 9 a.m. and the buyers want to see them.
There is no window of opportunity to transfer them overnight. As you can see in Figure 5-9, London is always “behind” Sydney. If the earth rotated the other way, or if London were a great place to grow flowers, then there would have been a nine-hour window to transfer the photos gradually to London while Sydney slept.

Figure 5-9. There is no time for a bulk asynchronous transfer
But as it is, every minute spent transferring the photos is taking up time the buyers need to assess them. For example, suppose you had 100 photos uploaded on a Monday by the flower producers in Sydney. They are uploading to a server in Sydney, so the speed is fast for that task. They are providing the information as soon as the first flowers bloom, which is optimum. It takes 2 minutes each to transfer one photo to a buyer’s machine in London. Users don’t normally think of viewing an image as downloading it, but that is what is required. This assumes optimum download speed, no interruptions, and no data loss. So 100 photos × 2 minutes = 200 minutes, which is 3 hours 20 minutes. If the photos were transferred via content deployment after the Sydney day was over at 6 p.m. on a Monday (which is 9 a.m. Monday in London), the staff in London would still not be able to see any of them until 12:20 p.m. their time. They may as well have downloaded them themselves one by one. They have still lost 3 hours 20 minutes of time in which they should have been considering which flowers to order.
The photos are 4MB and that is large for an image. On most web sites, images are optimized using software for that purpose so they are reduced to maybe 100KB in size. The Sydney office doesn’t have the staff or software/training to optimize these images.
The process has to be quick because of the nature of the product. While they send a photo of an open flower, they are selling buds because that is what will be shipped to allow time for them to open in the UK. (This is a made-up scenario, by the way. I don’t really know how this happens in real life. The key point here is to illustrate a time-sensitive process.)
Here’s the (made-up) simple approval and alert workflow process:
- A producer takes a digital photo of a flower in the field with a digital camera once they have a bloom.
- They connect the camera to a laptop on their truck in the field connected via Wi-Fi to the Internet.
- Using a VPN connection, they upload the photos to the Fancy Flowers Daisy Chain portal.
- They then add metadata like cost, quantities, and any other pertinent details.
- The Sydney office receives an alert by e-mail that there is new content in the picture library.
- They review the photos and metadata, and flag them as ready for review by the buyers.
- The buyers can place orders immediately on the portal by selecting Order alongside the flowers they want.
- This sends an e-mail alert via a workflow to alert the producers (the flower growers) to begin packing the flowers.
- It also alerts the cargo plane company that the flowers will soon be arriving at their depot to be flown to the UK.
Adding an extra step where the suppliers would be required to open the photos in image processing software and convert them to lower resolutions had been tried in the past and did not work. There were multiple time-wasting issues. Sometimes the photos were just made smaller by height and width to make their file size smaller and thus became too small on the screen to see clearly; sometimes the wrong images were uploaded. The issue was these are flower growers, not photo specialists. This also placed a burden on the Sydney office to correct the photos or ask producers to re-upload images. This slowed the process of getting the photos in front of the buyers far more than the 2 minutes it takes a photo to load. Another alternative is needed.
If you can’t change the earth’s rotation, where flowers are grown and purchased, or the process of getting the photos into SharePoint, what else can you do?
WAN Acceleration
The next option is WAN acceleration. WAN acceleration technologies are devices, sometimes referred to as WAN optimization controllers (WOC), put in the path of the data traffic to attempt to speed it up. There are multiple vendors providing this but they all use some combination of the following techniques.
You now know that throughput is determined mainly by the TCP receive window (RWIN) and the Round Trip Time (RTT), also referred to as latency. What can these technologies do to affect throughput in a positive way?
The first is data reduction. The WOCs examine all the data in real time being sent through them across the WAN. This information is stored in local data stores on each WOC. Then, when duplicate information is detected, references are sent to the appropriate WOC instructing it to deliver the information locally rather than resending it across the WAN. This has the potential to reduce over 90% of WAN bandwidth. But it is at its most effective when there are thousands of users requesting the same pages.
WAN accelerators also offer latency mitigation. You know that each data packet is like an invitation; another is not sent until an RSVP has been returned. This acknowledgment (sometimes called an ACK) slows down the data transfer process if the servers are far apart. In this case, the roundtrip is taking 350ms—almost a third of a second—and this is slowing down the data transfer. With WAN acceleration, WOCs act as a local post office, acknowledging the data transmissions from the server sooner. As a result, the WOC can maintain or increase TCP window sizes, which increases application throughput. All this reduces impact on the application performance across the WAN.
The problem with cold transfers like these photos is that the data still has to flow over the small WAN link. So, before WAN acceleration, a single buyer in London on this 3Mbps circuit could max a TCP session at, say, 2Mbps because of WAN delay. But, add WAN acceleration in and this 2Mbps shoots right to 3Mbps. At this point, the circuit can’t transfer any more. But the user doesn’t really notice the difference because it’s not that much more bandwidth AND now you have induced a WAN bottleneck. QoS kicks in and starts dropping packets, which backs off TCP transfers of this user and then the other users/buyers in London. As a result, the users don’t notice the difference. Also, because you hastened the bottleneck on the small WAN circuits, buyers are still frustrated waiting for the photos to load.
WAN accelerators also offer a feature called packet coalescing. Think of this as wrapping up lots of letters into a bundle and sending them together to speed up the RSVP/ACK process. Some applications are considered “chatty” because they use lots of smaller packets to communicate. Added together, these packets can consume substantial bandwidth—something in limited supply. WOCs can combine multiple packets traveling between the same two sites into a single packet, reducing application response times and bandwidth.
The WAN accelerator (WOC) can be placed on the route of your traffic or off to the side. These are referred to as in-path and off-path (sometimes out-of-path). With in-path design (Figure 5-10), the WOC is inserted between the WAN router and LAN switch. That means all traffic will go through the device. The advantage of this approach is it allows for automatic traffic optimization. The device opens its own TCP connection to its peer and will send to its peer only the traffic that can be optimized. All other traffic is routed normally.

Figure 5-10. All traffic is via the WOC
MPLS and PBR are also options. Multiprotocol Label Switching (MPLS) is a networking mechanism that transports data from one network node to the next with the help of labels. These labels identify what is in the packet to speed up the forwarding of it to the right destination. Think of it as the address on the envelope. Policy Base Routing (PBR) is where the network administrator wants to set further routing rules for packets based on other criteria like where the packet came from. Think of it as using the return address on an envelope. An in-path design is the simplest to deploy for branch offices with one MPLS network or for a medium-to-large location with two MPLS networks.
With off-path (Figure 5-11), the WOC is not in the direct line of traffic in order to optimize it. The traffic must be redirected to the WOC by means of a PBR statement. The advantage of this approach is it is nonintrusive: it allows transfer from one mode to the other by only changing the configuration. The disadvantage, of course, is that is necessitates more configuration and good application knowledge (ports/protocols to be used). As a result, off-path designs are more complicated. Care must be taken to standardize on an off-path design to ensure full optimization is achieved and impact to production traffic is minimal.
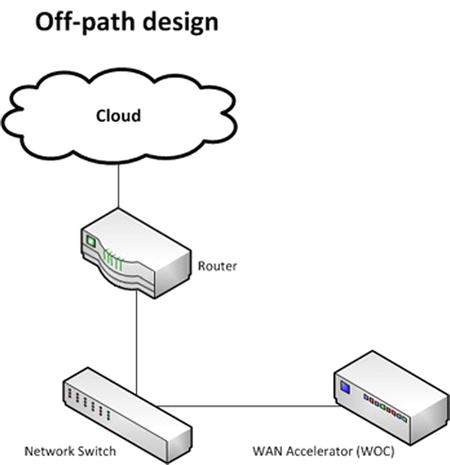
Figure 5-11. Traffic is redirected to the WOC
With off-path designs, the load balancers take on two different roles:
- Traditional load balancing: When all traffic is redirected, via a PBR or other means, to the LB, and the LB evenly distributes traffic loads among the various WOCs within a cluster.
- In-path load balancing: When both inbound and outbound traffic is intercepted by the LB when positioned inline on the network path. The LB will then send the traffic to various WOCs in a disproportionate traffic load distribution.
In the case of Fancy Flowers, they have one MPLS network connecting London and Sydney, so the best place to test the WOC would be directly in the path of the traffic going out of Sydney. Before testing the WAN accelerator, the Fancy Flowers team had a benchmark; they knew it took 2 minutes to open a photo in London. After adding the WOC it still took 2 minutes! This was because the files are cold, not cached.
For example, if the WOC keeps a local copy of the home page of the Sydney branch of Fancy Flowers on the Daisy Chain portal, after the first person from London visits there, that page will be stored on the WOC in the server room in London. Then any subsequent visit to that page by a London user will load faster as the requests don’t have to go back and forth to Sydney to load the page, images, stylesheets, et cetera. This means they are saving bandwidth between London and Sydney that can be used by other applications. Once a page has been cached, it is sometimes referred to as warm, as if the page has been “warmed up” by the first visitor who visited it “cold” because it was not cached on the WOC.
The problem in this scenario is that the Fancy Flowers buyers in London are almost always visiting “cold” pages. That is because the 100 or so pictures are uploaded in the morning in Sydney and then looked at by the 5 buyers in London when they start work. There has been no time or prior visits from London to warm up the pages.
After testing, Fancy Flowers decided that the cost of WAN acceleration was not giving them a sufficient benefit to warrant the cost. The main problem was the distance, and WAN acceleration didn’t add any benefit with cold files.
The Middle Ground
The main part of the problem is the distance. The solution that ultimately halved the time it took the buyers in London to open a photo was to set up a SharePoint portal, an extra daisy on the chain, halfway between London and Sydney. It is possible to test the RTT from London to various cities in the world by using the Speed Test web site’s (www.speedtest.net) interactive map that allows you to ping from your location to anywhere in the world. The results of some cities are listed in Table 5-1.
Table 5-1. Testing Latency from London to Various Locations
| City | RTT of ping in milliseconds from London |
|---|---|
| Cairo | 80ms |
| Dubai | 175ms |
| Mumbai | 320ms |
| Bangkok | 330ms |
| Sydney | 350ms |
Based on this analysis, a host provider is selected in Dubai (Figure 5-12) to provide a SharePoint server to store the photos. This is inexpensive as only a small number of user accounts are created for the producers and the buyers. The amount of capacity required is also low—and cheaper than storing the photos on the Fancy Flowers SAN. It also has the benefit of increasing security. The flower producers no longer have to be given VPN access directly to the Fancy Flowers network.
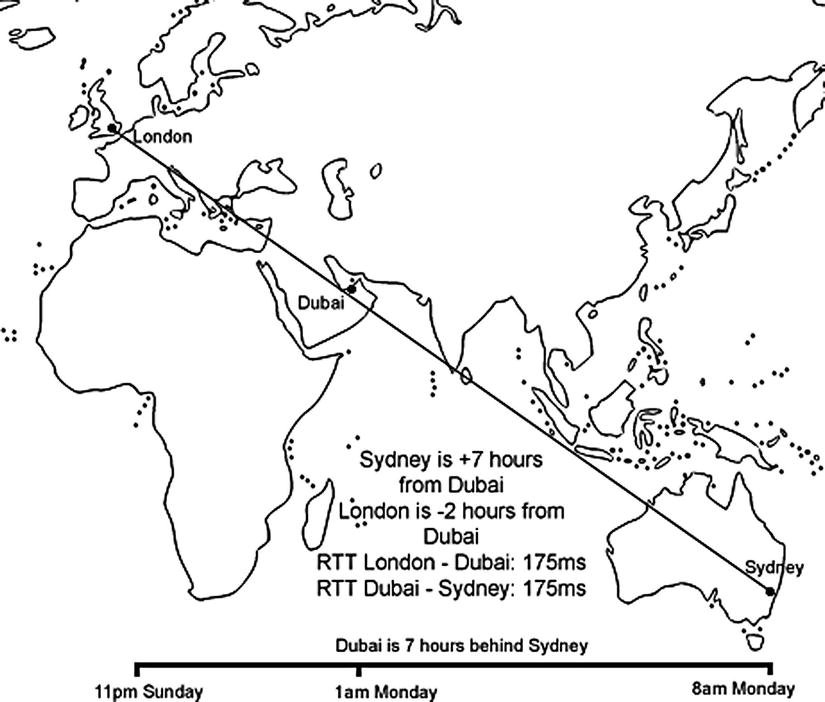
Figure 5-12. Latency reduced by adding server in the middle
The time it takes to upload the photos by suppliers did increase to about 1 minute. But this is not seen as onerous by them as they know the buyers won’t see them until after 6 p.m. their time, which is 9 a.m. London time. The main advantage is to the buyers in London: the time taken to open a photo is reduced by more than 50%, and the buyers really notice a difference!
Let’s work out the new throughput. In Figure 5-13, you divide the TCP window size (128,170) by the new round-trip time in seconds (.175) and get a TCP throughput of .732Mbps.

Figure 5-13. Calculating BDP with the new RTT
Again you calculate how many kilobytes per second (Kbps) that is. You multiply it by 1,024, then divide it by 8. The result is 93.696Kbps. At that rate, a 4MB photo (which is 1,024 × 4 = 4,096 kilobytes) will take 43.71 seconds (divide 4,096 by 93.696). QoS more than doubled, network security increased, and there’s even a savings on the cost of storing the photos on the SAN. A good result all around!
Centralized vs. Regional SharePoint Deployment
In the Fancy Flowers story, the content was added in one part of the world and viewed in another. That isn’t generally the case. Most collaboration is done between people in the same region, and some of that content is of interest to the broader global community within the organization, particularly through search. This section will look at the advantages and disadvantages of distributing your SharePoint architecture across the globe. As you saw in the case of Fancy Flowers, placing the content close to the people who need to see it provides a higher QoS. This is a good general principle.
The services architecture in SharePoint means you can centralize some services while keeping others regionalized. By adding scaled-down SharePoint Foundation deployments to the mix, you can have cheaper local collaboration and less complexity. The options that suit your organization will depend on your users’ needs and the QoS you wish to provide.
Table 5-2 names and describes the service applications in SharePoint Server that you can deploy across farms. The logic in each case makes sense: for example, you would want to be able to synchronize search data, metadata, or web analytics across farms.
Table 5-2. Which Service Applications Can Be Deployed Cross-Farm?
| Service Application | Purpose | Storage |
|---|---|---|
| Business Data Connectivity | Provides connections to line-of-business data systems. | DB |
| Managed Metadata Service | Hub for managing taxonomy, keywords, and tags. Content types sync across site collections. | DB |
| Search | Crawl content and serve search queries. | DB |
| Secure Store Service | Single sign-on authentication to external systems. | DB |
| User Profile | Manages user data for My Sites, User Profile pages, social tagging, and other social networking functionality. | DB |
| Web Analytics | Provides traffic, search and inventory reports (SharePoint 2010 only, not in 2013) | DB |
In the case of the service applications that can’t be deployed across farms, they tend to rely on caching to track data they need while showing you their content, as in the case of Access, Excel, and PerformancePoint. Services like the State Service do need a database, but are very farm specific. Table 5-3 shows the types of services that would not need to be as available across multiple farms.
Table 5-3. Which Service Applications Can’t Be Deployed Cross-Farm?
| Service Application | Purpose | Storage |
|---|---|---|
| Access Services | Provides a browser interface for Access databases. | Cache |
| Excel Services Application | Provides a browser interface for Excel spreadsheets. | Cache |
| InfoPath Forms Services | Provides a browser interface for InfoPath forms. | Cache |
| PerformancePoint | Pivot data, extract facts, and dimensions. Builds KPIs, scorecards, and dashboards. Connects to Analysis Service cubes. | Cache |
| State Service | Stores related temporary HTTP session data | DB |
| Usage and Health Data Collection | Produces various usage and health reports based on collected farm wide data. | DB |
| Visio Graphics Service | Viewing and refreshing of published Visio diagrams in a web browser. | Blob cache |
| Word Automation Services | Viewing and refreshing of published Word documents in a web browser. | Cache |
| Microsoft SharePoint Foundation Subscription Settings Service | Provides multi-tenant functionality for service applications. | DB |
Knowing your service applications is a crucial part of understanding how to deploy SharePoint in a way that makes the QoS and the user experience good. The simplest is not always the best. The goal is greater communication and productivity, which sometimes means more than one hub.
Single Hub
A single hub is when the SharePoint farm and all service applications are run from one location (Figure 5-14). The advantage of this approach is less complexity, which means less cost. The disadvantage is the QoS for the users far from the hub (like Sydney) is very poor. It also means all metadata and search content is consolidated. Overall, though, the benefits to the IT department in terms of management and the Finance department in terms of cost are outweighed by the loss of potential return on investment to the business from the platform as users far from the hub will not be motivated to share and collaborate.
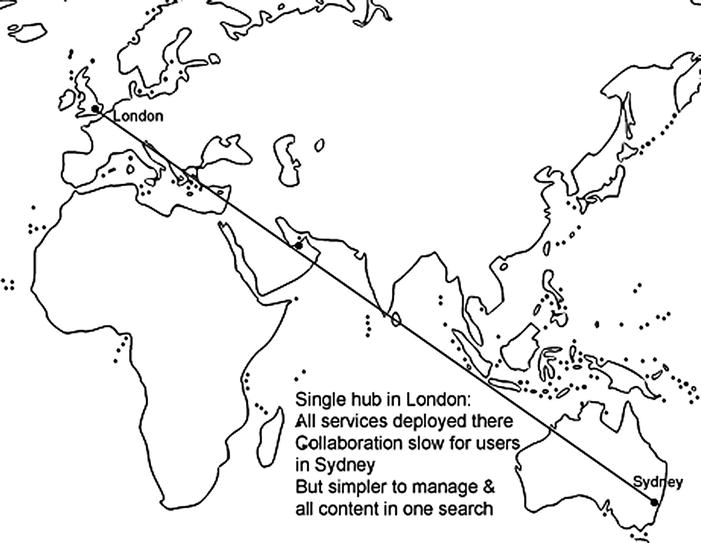
Figure 5-14. Simple for the administrators, slow for the distant users
Central Hub with Spokes
A central hub with spokes gives regional users good QoS for collaboration by placing a farm in their region, Sydney in this scenario (see Figure 5-15). They use this for local collaboration. Their My Sites are also hosted here as most of their social networking is also local. It is possible to share user profiles across farms, but currently, using the User Profile service application across WAN links is not supported. That is because this service requires direct database access. So for WAN environments like this scenario, the User Profile Replication Engine (UPRE) is recommended instead. The UPRE is part of the SharePoint Administration Toolkit (http://technet.microsoft.com/en-us/library/cc508851.aspx). It replicates user profiles and social data (such as social tags, notes, and ratings) between User Profile Service applications. This replication can be one-way or bidirectional. The Fancy Flowers folks decide to use this approach because they find the time zone differences between London and Sydney prevent knowledge sharing and good communication between the branches. They develop the My Sites functionality to display updates from all staff to make them more aware of each other and communicate better.
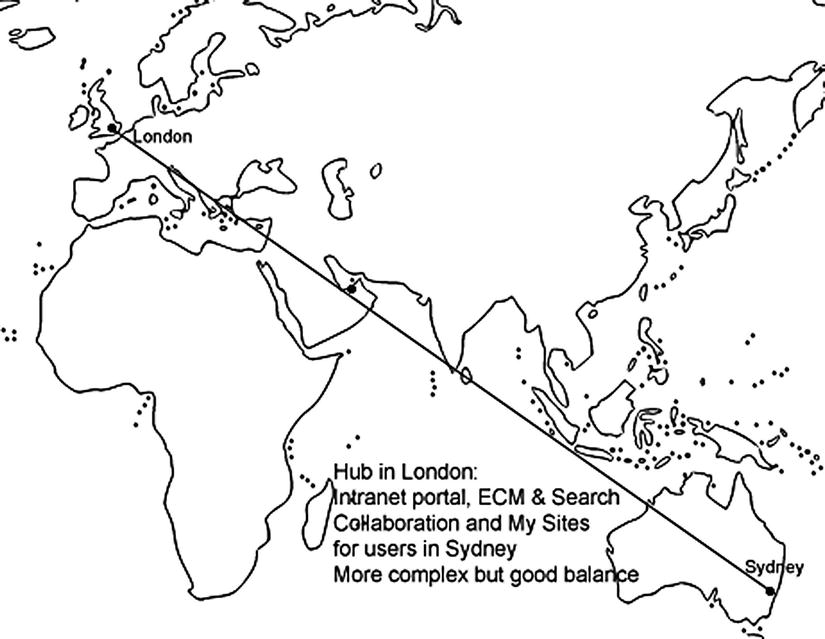
Figure 5-15. More complex but better ROI
The Search service is also centralized in London. This is done by federating the content in the Sydney index rather than crawling it directly. Federation is similar to running multiple searches at once and displaying the results on the same page, but in separate web parts. This makes it easier for users to identify where the content is located. You can crawl content directly across WAN links from a central farm. The search architecture in SharePoint is optimized for crawling over WAN connections. You can even put crawler components on separate crawl servers. These would be dedicated to crawling the remote content and so have less impact on general performance. Since the general intranet pages will change less often and have less editors and more readers, this can be hosted remotely from users, but caching can be used to make access faster as pages will mostly be warm rather than cold.
Just because you can deploy a service across a WAN link doesn’t mean you should. Spreading the web analytics service across a WAN is not recommended possibly because it is chatty and would adversely affect other applications by using all the bandwidth. With the Business Data Connectivity service, QoS is best if the farm is close to the data. The same is true of the Secure Store Service: keep the service close to the application to which it is authenticating. This option is more complex and expensive than a central hub, but your organization may be getting more value from SharePoint as a result.
A third option, which is an economical compromise between the previous two, is to only deploy SharePoint Foundation in your regional office(s), as shown in Figure 5-16. This gives local users the benefit of fast collaboration, but without the cost of the SharePoint Standard or Enterprise licenses. The more local offices you have, the more this will be a consideration. The content in these local offices can still be crawled by the central hub, but users will have to go there to perform a search. Essentially, this is the same as just a central hub, but with separate cheap local collaboration sites.
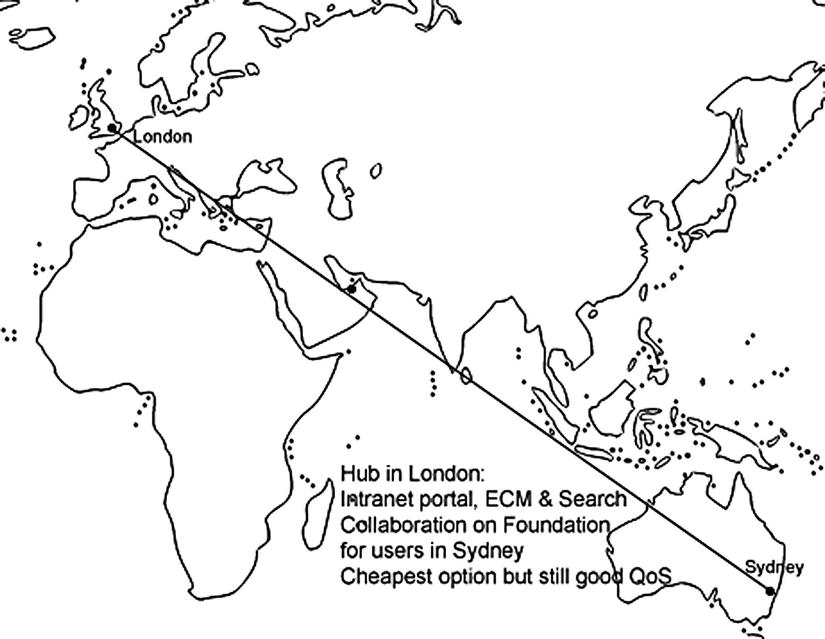
Figure 5-16. Distributed, but less costly
Cache
Hello, I’m Johnny Cash.
—Opening line at many of his concerts and public appearances
Caching has the largest impact where there is a high ratio of content consumers to producers and where the content changes infrequently. This is generally not the case with SharePoint, which aspires to make all users contributors and for updates to be fast and frequent. But caching can be set by the administrator to react differently depending on the profile of the user. If the user is anonymous, it can be assumed the content will change less often for them so the content is kept warm. With authenticated users, the content is assumed to be colder and so the caching is not as frequent. SharePoint gives you a range of options to manage the caching of page output through the web UI without having to resort to editing back-end configuration files (see Figure 5-17).
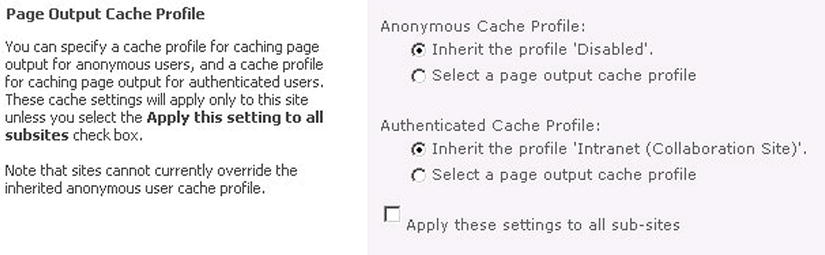
Figure 5-17. Caching is easily set through the Settings pages
Summary
The main ways to improve your quality of service are WAN optimization, designing your farm so that content is near the people who need to see it, and caching infrequently changed pages. WAN acceleration can only help so far with the limitations of latency. But there are options in SharePoint to get a cost-effective compromise between user satisfaction and a not overly complex architecture.
It should be clear that “the pipe” is an overly simple metaphor and that making it bigger is not necessarily the best way to improve QoS. However, I do think that faster broadband in business is lagging behind what is available in the domestic market due to competition and that this will change. For example, I pay very little every month for 20Mbps and many businesses are content with 3Mbps. Also, broadband’s pricing method is unfair because businesses pay no matter how often or how much they use their broadband. This is not the way with electricity or water, and it should be the same for broadband. Why are you paying 24/7 for something you may only use 8 hours a day, 5 days a week? Why does a light user have to pay as much as a heavy user?