![]()
Monitoring
“Well, enough to get out of the way.”
—Frederick Fleet, when asked how much sooner he could have seen the iceberg that sank
Titanic if he’d had binoculars
Your ability to maintain high availability is entirely dependent on your monitoring practices. In nearly every SharePoint disaster I have heard of or had to clean up after, there was a point when someone could have prevented it. Prevention is really what administrators should be rewarded for—not fixing problems that could have been prevented. But that is not how we tend to think. We focus on putting out fires and rarely think about measures to spot them early and save lives. This is a costly way to think; smoke alarms are cheaper than fire engines.
Let’s use the Titanic metaphor to show how you can change your approach to monitoring SharePoint. The monitor is the lookout on your ship, not the tools they use. In the case of the Titanic, the lookouts in the eagle’s nest were given reports that there were icebergs in the area, but they lacked binoculars—not because there were none on board, but because the key for the locker in which they were stored was in the pocket of a crew member who had been reassigned before the voyage. The cold night air made their eyes water and the lack of wind made the icebergs hard to spot as no waves were breaking on their sides. The result: when the warning was given, it was too late. The ship glanced off the side of the iceberg and started to take on water.
Using this example as a lesson for your SharePoint farm, note the following:
- The lookouts knew there were icebergs because they had reports to this effect from other ships in the area.
- They had the tools to spot them (binoculars), but they were locked away.
- Weather conditions meant they could not spot them as soon as usual.
- By the time they did spot the iceberg, there wasn’t enough time to steer clear.
Translating this into lessons for SharePoint reveals the following:
- Monitoring and reporting can warn of disasters.
- People and tools are crucial to preventing disaster.
- Intervening factors outside of your control can make situations worse.
- Knowing a disaster is going to happen is not enough to prevent it. You must also have the means to do so.
Monitoring starts with actively looking, so let’s begin with the routine daily tasks of the lookout for your SharePoint farm. After that, I'll show you the weekly, monthly, and quarterly tasks you can do to proactively prevent disasters.
Monitoring is mainly a task of routine vigilance. You should divide your administration role into tasks you perform regularly and even at a particular time. Beyond this regular schedule there may also be specific dates in your organization when extra watchfulness is required. For example, if your business is a TV sports channel, then your system work during the Super Bowl will be very important. Thinking along these lines, build your own custom task list.
As a SharePoint administrator, your first task every day should be to visit the portal’s main access pages and see if they render for you and as quickly as normal. Access them via a standard PC/Mac on the network, not just directly on the server. Do this in the morning, preferably before any of the users log on. This means starting your day an hour or two before everyone else. After you have built some automatic alerts, this will be less necessary, but for now it’s a good starting point. If something is wrong, you will have an opportunity to diagnose and fix it—perhaps before the broader user community even notices, which is ideal. There should be no worse shame for the owner of SharePoint than to get a call from the help desk or directly from someone in Upper Management to say SharePoint is down—and you didn’t know about it.
You should be checking for performance bottlenecks daily and trying to catch them before they affect your SLA and the users’ experience. I will show you a number of tools you can use to help do this, but remember, the best tool is your own intelligence and proactivity. Checking to ensure that the portal is working is only the very first part of your daily monitoring responsibilities. If you do see a problem, you have maybe an hour or two to resolve it before users notice. If you have been in this situation, you know it’s a stressful one. It’s far better to expend your energy daily identifying problems that could be days, weeks, or months away.
Your servers exist in physical space. Even virtual machines reside on a physical host: it may be part of your responsibly to ensure the server room is secure and at the right temperature, and that no cables are loose or prone to be tripped over. Small things like this can bring down the best-architected farms. Some days will be different: perhaps the COO is making a big announcement at 9 a.m. and thus you can expect a spike in usage. If you notice a fall in usage that has no normal cause, like a public holiday, it may be a sign something is wrong. Checking and rechecking should become a normal routine, and you should begin your day by looking at the automated tasks from the night before, starting with backups.
You should also begin each day by ensuring the backup from the previous night has occurred. If you work for an organization that has offices all over the world, you may also be receiving a handover from the administrator of the previous shift, in which case a clear understanding of what has happened on their shift is essential so you can take over smoothly. Check your latest backup carefully. Make sure there is nothing outside normal parameters: size of backup, time it took, name of the file, et cetera. Test your backups by restoring them to a redundant system. This is useful as occasionally users delete content that can’t be retrieved from the Recycle Bin. An example is if they delete list content in datasheet view. Having the backup from the night before lets you give the user their content back quickly. Sometimes it’s useful to have this restore for security reasons. Users sometimes claim they uploaded something when they didn’t, or didn’t change someone else’s access rights. This is an easy way to see what the site was like the day before.
Data never sleeps. It is constantly changing and generating more of itself and filling your disks’ finite capacity. In SQL Server for SharePoint, data is created in the following places:
- Databases and their Transaction Logs
- Search Indexes
- Logs
Daily, you should be looking at the rate of growth of your disk volumes. Lack of capacity is one of the major causes of system unavailability and poor performance. You can do this using a range of tools: Windows Explorer, Performance Monitor, or Microsoft Systems Center Operations Manager (SCOM). Don’t leave the ordering of new hardware to the last minute. If the rate of growth indicates that your organization will need more capacity in less than three months, order it now. It can take that long to get sign-off, receive the hardware, and install it.
Monitor Reliability and Performance with Windows
Your Windows servers are the main container for your SharePoint farm. As such, having the tools to monitor their integrity is very important to your farm. Windows Server 2008 R2 offers a number of ways to monitor the reliability and performance of your system over time, all accessed via Server Manager. To open Server Manager, go to the Administrative Tools group in the Start menu on each of the servers in your SharePoint farm. You can also search for it in the Search box in the Start menu. Once opened, it looks like Figure 7-1. The first place to look is Event Viewer, under Diagnostics. There are other monitoring tools in here, like Performance Monitor, but check the error log first as it may show you something you didn’t anticipate.

Figure 7-1. Open the Performance Monitor after you visit your portal’s main pages and backups
Check Event Viewer
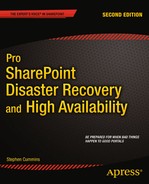
The Event Viewer is your main point of daily communication from your hardware, system, and software—including SharePoint. It should be your main point to check the health of your system. Event Viewer can be accessed as a stand-alone application in the Administrative Tools group in the Start menu on each of the servers in your SharePoint farm, or under Diagnostics in Server Manager. The first place to look in Event Viewer is the Summary of Administrative Events (see Figure 7-2). This section will show you what new errors have occurred in the past hour or 24 hours. These will be the first errors you will want to check out.
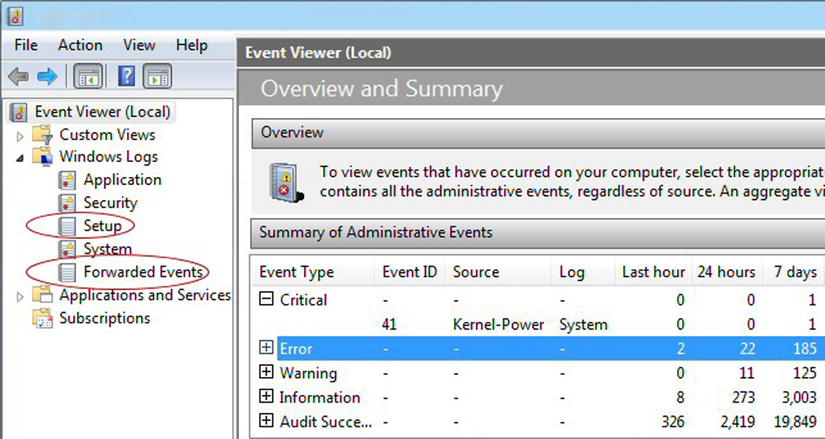
Figure 7-2. The errors from the last 24 hours
You can also filter events by type (Critical, Error, and Warnings) with these steps:
- Expand the Event View folder in Server Manager, or open the Event Viewer directly from Administrative Tools from the Start menu.
- Select the log from which you want to filter events: the most common to look at is Application under Windows Logs.
- Right-click the log and select Filter Current Log.
- In the log Properties window, select the Critical, Error, and Warning check boxes.
- Click OK when you have finished.
The path to the SharePoint-specific Operational logs is shown in Figure 7-3.

Figure 7-3. Check here for specific SharePoint events
Windows doesn’t just allow you to passively consume data on what’s happening in SharePoint; it can also actively inform you of events that could cause trouble down the line. It can even react to events in ways that begin to completely fix the problem. Let’s look at these tools now.
Create a Subscription
The Event Viewer allows you to subscribe to events on multiple servers and attach tasks such as sending an e-mail or running a program in response to particular events. Here are the steps to ensuring you are notified of any Critical or Error events in the logs on your SharePoint servers. The first step is to create a new subscription, as shown in Figure 7-4.
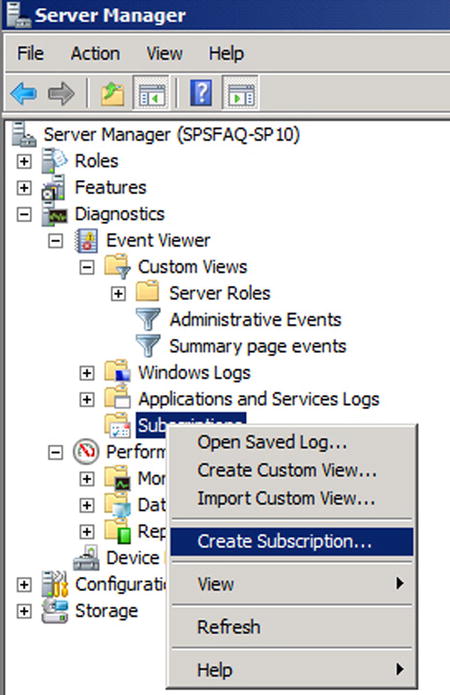
Figure 7-4. Step 1 is to create a new subscription
Next, name your subscription and where the details of the subscription trigger events will be written to. You can also at this point identify multiple source computers for your subscription. Computers that will be sending events to each other must have the proper authentication in place first. Do this by adding the computer account for your “primary” server to the Administrators group on all servers from which you wish to collect events. This may require a reboot. The primary server is just the one from which you manage the subscription, so logically it would be the one from which you access SharePoint Central Administration. The OK button will remain inactive until you select at least one computer (Figure 7-5).

Figure 7-5. Step 2 is to specify from where to collect the data
Next, click the Select Events button, click Edit, and choose the information you want to collect from where. In Figure 7-6 I have chosen Critical, Warning, and Error messages from the Event log for SharePoint in the past 24 hours. You can experiment with more refinement than this to suit your own needs. Figure 7-7 shows the subscription.

Figure 7-6. Step 3 is to specify the criteria for your subscription
Figure 7-7. Your subscription is now displayed
Your subscription will start automatically. Details of what it captures will be displayed in the Forwarded Events Log, as shown in Figure 7-8.
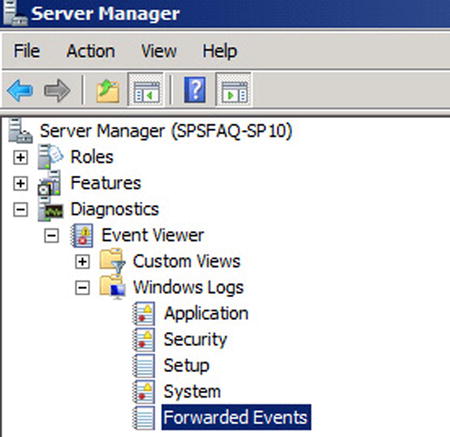
Figure 7-8. Forwarded events are displayed under Windows logs
You now have a way to consolidate specific events across all your SharePoint servers. For more detail you can go here: http://technet.microsoft.com/en-us/library/cc749140.aspx. You may not need sophisticated tools like SCOM if this is sufficient for your organization’s needs. The events you subscribe to are a result of recurring errors, because if you could predict everything that was going to go wrong before it happened, you’d be doing more with your life than administering SharePoint. I have used it in the past to alert me to recurrent problems caused by patching procedures that were not followed; you will build up your own profile.
Alerts: Instant Monitoring
The alerting function is also very useful for receiving messages directly from your servers. It is used to define a counter value that will trigger an alert to send a network message, execute a program, or start a log. This is useful for maintaining a close watch on your system, and one of your daily tasks should be checking for these messages. For instance, you can monitor unusual activity that doesn’t occur consistently and get an alert when the event has been triggered, such as a spike in processor usage or the system using over 80% of memory. Security-related events are good candidates for the alert service as well: you can receive a message immediately if someone other than the approved list of users is accessing the machine.
With alerts, certain checks are much more frequent than daily; they are immediate, but they must be set up in advance. You can also configure the alert service to notify you when a particular resource drops below or exceeds certain values, thresholds, or baselines that you set up. Counter logs can also be viewed in the console, and the counter log data can be saved to CSV and TSV files and viewed in spreadsheet or report software. You can configure the logs to be circular, which means that when the log file reaches a predetermined size, it will be overwritten. Logs can also be linear, and you can collect data for predefined lengths of time. Logs can be stopped and restarted based on parameters you set. You can save files to various formats, such as HTML, or import the entire control OCX into an OLE container. Be careful of logs using too much space; set limits on them or put them on a separate volume where there is plenty of space and back them up to a separate machine. They may be useful after a server crash.
Setting up Tasks: Sending an E-mail Alert
So you have consolidated your events from multiple servers and specified which ones you want to know about. What action do you want Windows to take when they occur? You can ask Windows to run a program, put a message on the screen, or send an e-mail. You can even specify multiple actions. The most common action is to send an e-mail, so I will describe the steps here. To schedule a task for sending out alerts upon the arrival of a subscribed event, start Task Scheduler from Administrative Tools.
On the General tab (Figure 7-9), name your task and specify under what privileges it will run. I have set mine to run whether I am logged on or not. I am also not running it with the highest privileges. Don’t be tempted to do this in a production environment, as it is always best practice to follow the principle of least privilege and it is unlikely this task needs all the privileges the Administrator (in my case) account has. For additional security, you could use an account with limited privileges just for this purpose.
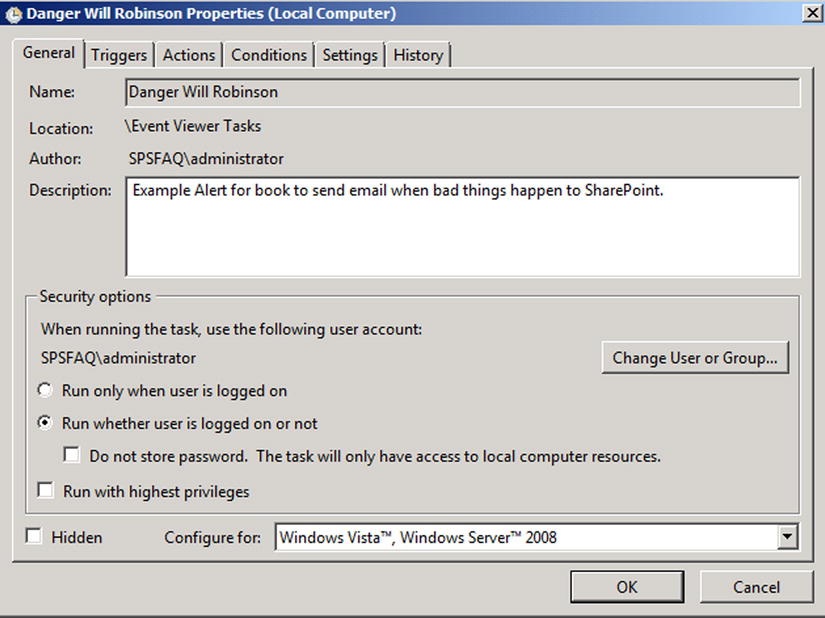
Figure 7-9. General settings
On the Triggers tab (Figure 7-10), I pressed the New button to bring up this dialog. In it I specified my task to run just before I check it in the morning every day. That way, when the e-mail is sent, it will contain the latest information and I will receive it an hour before I arrive at work at 7 a.m. (Set this to suit your own schedule.) I have also ticked the box that says “Synchronize across all time zones.” This is useful if you want to set this task so it is seen in the morning by your administrators in other countries.

Figure 7-10. Triggers settings
On the Actions tab (Figure 7-11), I pressed the New button to bring up this dialog. Here is where you choose your action. The first drop-down also allows you to display a message or start a program. In this case, specify where to send the e-mail and what SMTP server to use.

Figure 7-11. Actions settings
On the Conditions tab (Figure 7-12), you have the option to have the computer wake up to send the e-mail; this may be necessary if it has been idle all night. Otherwise, leave the settings here as the default. Other than the trigger, you may want to send the e-mail if the machine has switched to battery power or has had to use a secondary NIC.
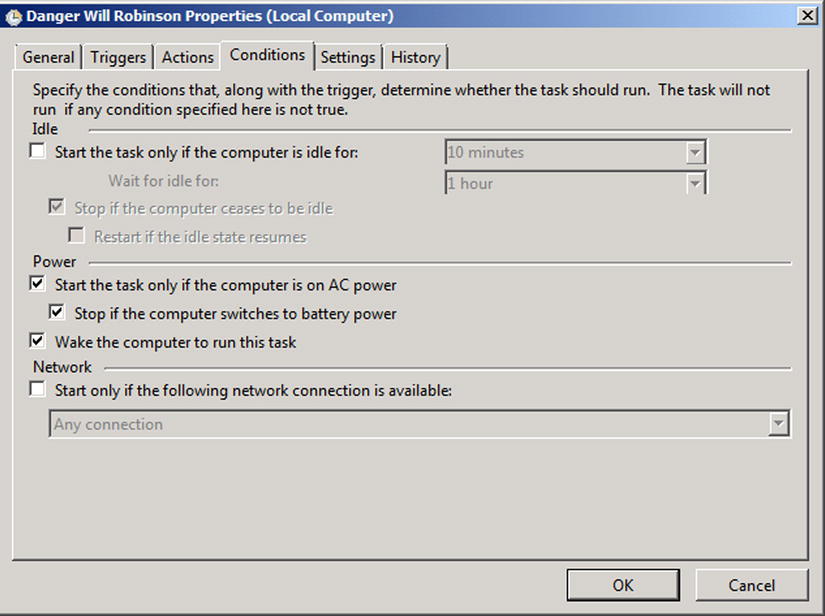
Figure 7-12. Conditions options
On the Settings tab (Figure 7-13), you have options about when and how the alert will run. I set it to retry five times if it fails and to stop if it takes longer than an hour. You can also create one-off tasks that automatically delete after they run. If there is more than one instance of a task, your options are (if the task is already running) to run a new instance in parallel, queue a new instance, or stop the existing one.

Figure 7-13. Settings options
Once you have been prompted to enter your administrator password to create the task, you can manually run it to test it (see Figure 7-14). Multiple tasks will alert you as soon as possible to problems with your SharePoint farm. It may be that one person is not monitoring it 24/7, in which case alerts can be set up to be sent to the appropriate person for that time. Some organizations, for example, have some staff only on call outside of normal business hours, so separate alerts can be configured to be sent to the appropriate person depending on the day/time. The nice thing about this functionality is there is a simple, clear graphical interface to let you create and manage these alerts.

Figure 7-14. Run your task
Your SharePoint system may generate errors, but sometimes you need to be alerted if the hardware is using too many resources such as memory or processing power. In this case, you want to get the alert because you want to catch the problem before it generates errors at the application level. Your goal, like the binoculars on the Titanic, is always to see the trouble coming from as far off as possible to give you the greatest chance to avoid it.
You can also collect data from multiple servers in what are called data collector sets. I will show you how to set up event subscriptions using them to monitor memory- and performance-related counters.
Using Counters
Counters for memory and performance are useful for locating bottlenecks on your system. They will also detect bursts on the servers, which can be caused by sudden activity. This can either be expected, like when a big announcement is posted on the intranet, or unexpected, like a denial of service (DoS) attack. I will show you how to configure some of the more useful counters. Here are the steps to setting up what is referred to as a Data Collector Set:
- Open the Server Manager console.
- Right-click on Data Collector Sets
 User Defined, and create a New Data Collector Set (Figure 7-15).
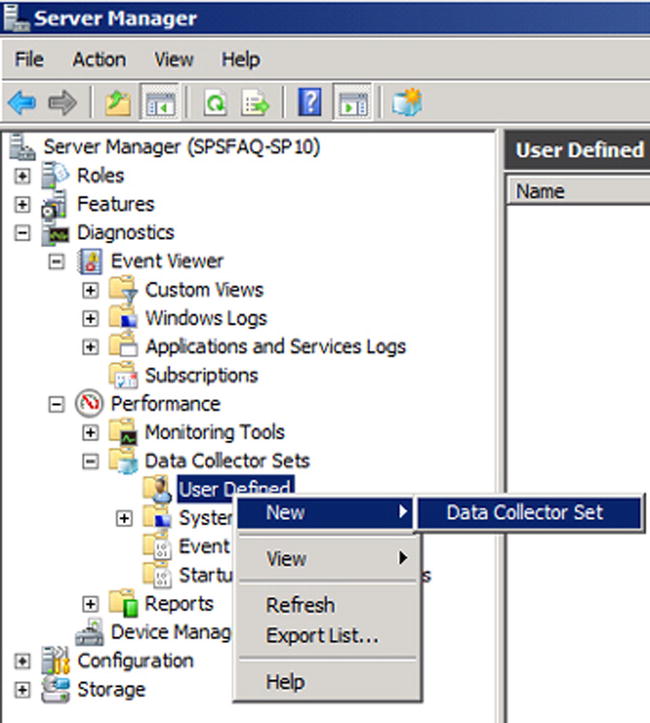
Figure 7-15. Create new Data Collector Set
- Name the Data Collector and choose to Create manually (Advanced).
- After clicking Next, choose the types of data to collect.
- Select Create data logs and Performance counter (Figure 7-16).

Figure 7-16. Create logs for performance data
- On the next screen (Figure 7-17), click Add and select performance counters to monitor. At the top of the screen you can select counters from computers other than the local computer. For each computer you wish to monitor, enter the counters into the same Data Collector Set. So, for example, if you plan to monitor three counters on three machines, nine total elements will be added to the Data Collector Set.
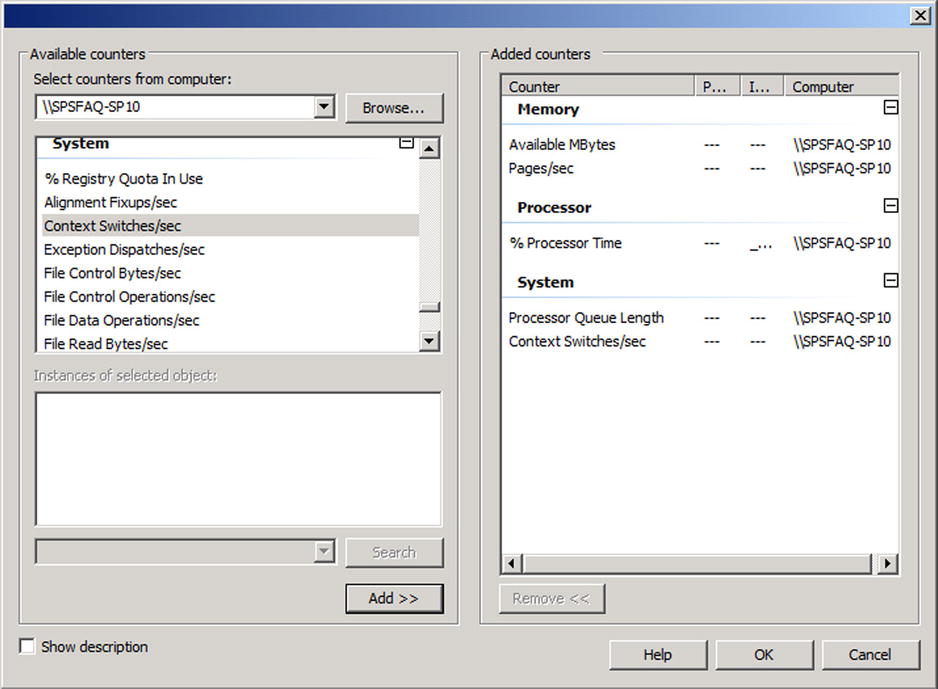
Figure 7-17. Choosing what to monitor
- Finally, click OK. Your monitor will be created at the following path: C:PerfLogsAdmin<Data Set Name><ServerName_Date_Number>DataCollector01.blg
- Double-click this file to open the monitor.
With many hundreds of performance counters available, one of the biggest headaches in setting them up can be simply determining which counters will be most useful. In fact, only a few of the available counters are actually necessary for monitoring entire-server performance. There are other counters that you’ll find useful when these entire-server counters alert you to problems that may be occurring on the server, but you don’t need to run them all of the time. Consider these few as a good starting point for monitoring on all of your servers.
Processor % Processor Time
This counter is the overall measurement of when a server is actively processing useful work. It measures when the processor is doing something other than the System Idle Process. When this counter is high, it means that the processor is actively processing useful work and you have efficient utilization; it’s only a concern if users complain of poor server performance that corresponds with periods of high processor use. However, when this counter spikes to 100% (or 50% in a dual-processor system) it can mean that one process is consuming an entire processor’s resources and thus needs attention.
System Processor Queue Length
This counter shows how many instructions are currently in line for attention by the processor. When this counter goes much above zero, it is often an indication that the processor can’t keep up with the workload you are asking it to perform. A high count here can indicate that you need either a faster processor or fewer services running on the server.
System Context Switches / Sec.
A context switch occurs when a processor switches between which waiting instructions it is processing. As processors are only able to process a single instruction at a time, context switches give the illusion of multitasking. High levels of context switches are problematic because of the resource overhead involved with swapping out what the processor is working on. In situations where too many actions are being required of the processor at the same time, this can be a very high number. Typically, you’ll see very high figures with very old applications or on Terminal Servers where many users are running many processes at once.
Memory Available MBytes and Memory Pages / Sec.
These counters are useful for determining memory use on the server. When a server processes its workload, it loads elements into memory for processing. When that memory begins to fill up, pages are swapped out of RAM to the disk. Since the disk subsystem is significantly slower than solid-state RAM, swapping usually involves a reduction in overall performance. Thus, the count of Available MBytes should be a number greater than zero, while the count for Pages/Sec should be a relatively low number.
When these counters are in those ranges, this means that the server has the correct amount of RAM assigned to it, and it isn’t requiring more memory than available physical RAM. In virtualization environments where memory can be dynamically assigned to servers, it is often a best practice to manage the count for Available MBytes to be relatively close to zero as well. This means that the exact amount of memory required to perform that server’s workload has been assigned to the server, while none is wasted and sitting idle.
You can usefully add other counters for the disk subsystem and networking as necessary. For servers with large amounts of data storage and retrieval, the disk subsystem can often be a significant bottleneck. In environments that do not use gigabit networking, it is possible for the network to be a bottleneck to performance as well. Keep an eye on these to spot problems, so you can suggest solutions when customers want to improve performance.
Once you’ve added the counters, select a sufficiently long sample interval (see Figure 7-18). Smaller intervals provide more granular data, but they take more resources to capture. With more remote computers being sampled, a longer sample interval is often necessary to prevent overloading the server collecting the samples. A good sample interval may be as long as 10 minutes per sample, providing round-the-clock sampling with relatively little impact.
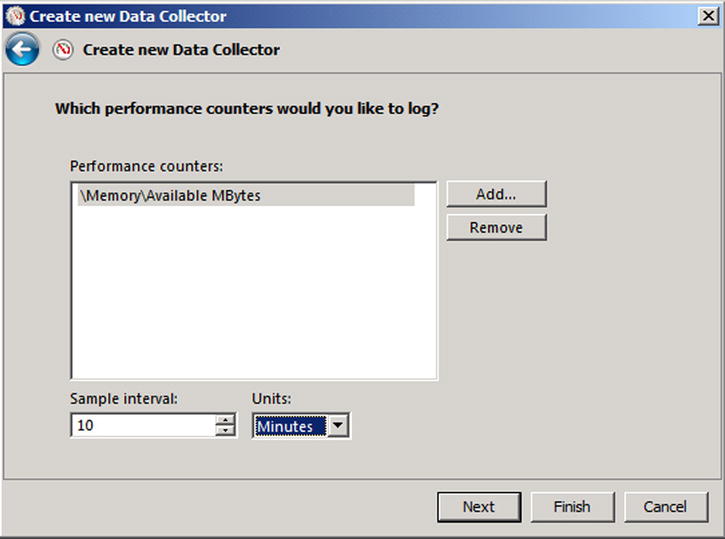
Figure 7-18. Set the sample interval
You also have the option to configure Windows to monitor multiple machines with one Data Collector Set. More detail here: http://technet.microsoft.com/en-us/library/cc749337.aspx. This makes sense because a SharePoint server farm is not one machine in isolation. It is part of a whole. It is also useful to be able to view data from multiple servers in one administration interface. Here are the steps:
- From within the Event Log on your management server, click on the Subscriptions node. A window will appear that asks if you want to enable the Windows Event Collector Service. Click Yes to start the service and configure it to automatically start with the computer. This enables the management server to collect events from other computers.
- Next, from a command prompt on both the management server as well as any other servers you wish to collect events from, enter the command winrm quickconfig. This enables the Windows Remote Management service (WinRM), sets its initial network configuration, and prepares it for use by the Event Log (see Figure 7-19).
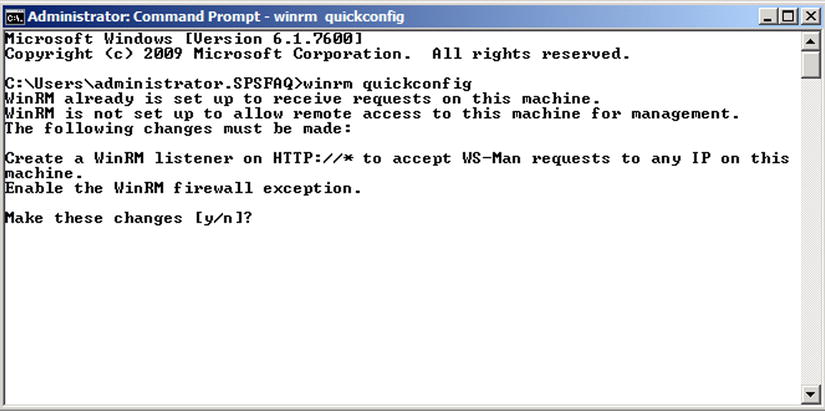
Figure 7-19. Enable WinRM
- Computers that will be sending events to each other must have the proper authentication in place first. Do this by adding the computer account for your management server to the Administrators group on all servers you wish to collect events from. This may require a reboot.
- Finally, back on your management server, right-click the Subscriptions node and choose Create Subscription. In the dialog that opens, enter the necessary information that scopes the type of data you want to collect, how the data will be transferred, and any advanced settings that relate to the speed at which events are transferred. The steps for creating a subscription are in the “Create a Subscription” section earlier in this chapter.
Check Task Manager
Another location to check daily that gives you some immediate feedback is Task Manager. To start Task Manager, take any of the following alternative actions:
- Press Ctrl+Alt+Delete, and then click Task Manager
- Press Ctrl+Shift+Esc
- Right-click an empty area of the taskbar, and then click Task Manager (see Figure 7-20).

Figure 7-20. Starting Task Manager
Task Manager is a tool you can use daily to look out for potential bottlenecks and points of failure in your system. It is particularly useful because it is looking at your machine’s performance in real time. It shows you the status of the programs that are running and allows you to end programs that have stopped responding. You can see graphs and data on CPU and memory usage; you can also view the network status and see how your network adapter is functioning. If you have more than one user logged on to the server, you can see who they are and what they are working on, and send them a message, which is useful if the server is in a remote location and you are only one of a number of people with this level of access to it.
SharePoint’s Monitoring Tools
Eternal vigilance is the price of liberty; power is ever stealing from the many to the few.
—Wendell Phillips
I’m using this quote to refer either to power or to system resources. It is as true of your SharePoint farm as it is of the liberty of people that it is ever being stolen by the few at the expense of the many. You have looked at the Windows tools for monitoring your farm’s health; now let’s drill down further to the tools within SharePoint you can use for monitoring. SharePoint Central Administration (Figure 7-21) has several monitoring tools (namely Health Analyzer, Timer Jobs, and Reporting) to help you maintain the eternal vigilance you will need to keep your farm resources free. First, let’s look at how you might troubleshoot an error and then see where the information comes from.

Figure 7-21. The monitoring options within SharePoint
When something does go unexpectedly wrong despite all your alerts and monitors, it may appear as an error message like that in Figure 7-22. How do you find out what that long, enigmatic Correlation ID means?
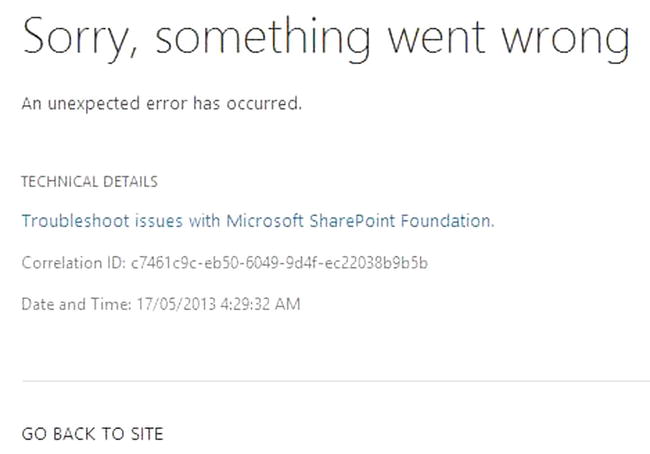
Figure 7-22. The first step is to find what the Correlation ID means
Your first place to look should be the Operational logs in Server Manager (Figure 7-23). Here you will see the most recent SharePoint-related events.

Figure 7-23. Check the logs
If the error is not showing there, you can search the logs directly using Notepad. Locate C:Program FilesCommon FilesMicrosoft SharedWeb Server Extensions14LOGS, open the latest logfile with Notepad, and then search for the correlation ID. Note the 14 in that path refers to SharePoint 2013, it is 12 for SharePoint 2010 and will likely be 15 for the next version. You can also use PowerShell to locate and output the error to a text file. Locate the Correlation ID and corresponding error message with PowerShell. These commands are very CPU heavy, so use them sparingly.
Output to console:
Get-SPLogEvent | ?{$_.Correlation -eq "7cf3fec7-4a71-481a-8ad3-c845190e6947"} | select * | Format-List
Output to text file:
Get-SPLogEvent | ?{$_.Correlation -eq "7cf3fec7-4a71-481a-8ad3-c845190e6947"} | select *
| Format-List | out-File CorrelationID-Error.txt
This will generate a file with the following text:
Timestamp : 06.05.2010 19:02:44

Continuation : False

Process : w3wp.exe (0x0ECC)

ThreadID : 4972

Area : SharePoint Foundation

Category : Runtime

EventID : tkau

Level : Unexpected

Message : Microsoft.Office.Server.Search.Query.SearchServiceNotFoundException: The search request was unable to connect to the Search Service.

Correlation : 7cf3fec7-4a71-481a-8ad3-c845190e6947

Context : {}
Now you have a real message (“The search request was unable to connect to the Search Service.”) that you can understand and use to fix the problem.
The Unified Logging Service
The Unified Logging Service (ULS) is the single, centralized location for logging error and informational messages related to SharePoint Server and Solutions. This means you have one place to look when you need to troubleshoot an issue or monitor the overall health of the SharePoint application. It aggregates logs from the following three locations:
- SharePoint trace logs
- Windows Event Log (which I have discussed already)
- SharePoint logging database
The ULS viewer is an excellent way to get a real-time look at your logs. You can download it from http://archive.msdn.microsoft.com/ULSViewer/Release/ProjectReleases.aspx?ReleaseId=3308 and install it on your SharePoint server. Once installed, click Ctrl+U and then OK to see the data being added to your log in real time (Figure 7-24).

Figure 7-24. Your logs in real time
Try the Toggle Correlation Tree button. This is the one furthest to the right in the screenshot above. You could use the example correlation ID to trace a series of events inside SharePoint. A specific error may occur a number of times in a big ULS log file, but with the correlation ID you can easily track them. Another good feature is notifications. You can set the notification level for ULS Viewer; by default it will pop up and notify you of a Critical message.
Health Analyzer
This tool is used to automate the monitoring of the configuration of your SharePoint farm. It is clever because it does more than alert you to problems like the Event Viewer; it can fix the problems automatically for you. For example, if the logs are set to verbose and are going to fill up the disk capacity, the Health Analyzer can reset them. This is because each rule is in fact a DLL, a compiled program that can execute script. It runs inside a timer job and so is fully automatic.
You will notice it alerts you when you visit SharePoint Central Administration (Figure 7-25). In this example, it is on a red background because the issues are critical but if there are less serious issues, it’s yellow.
![]()
Figure 7-25. A Health Analyzer alert
There are over 60 rule definitions, all listed on the Review Rule Definitions page (Figure 7-26) in Health Analyzer. Each once can be scoped to every server on the farm and have a different schedule.
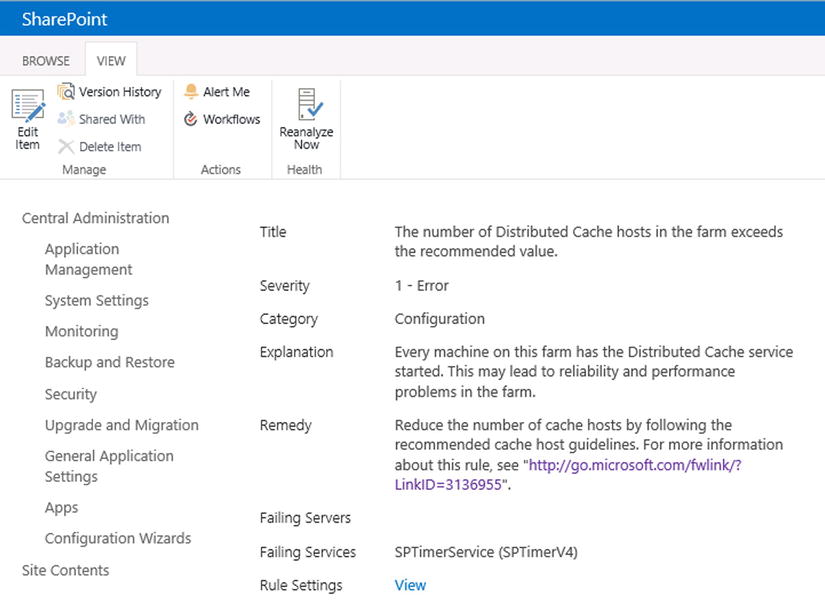
Figure 7-26. Click Alert Me to create a Health Analyzer alert
As before, it is configured through rules that can be evaluated hourly, weekly, monthly, or on demand. You can also configure it to send you alerts either by e-mail or SMS text message. Since some of these jobs only run monthly, if you have just set up your farm, you may want to run them all once to see your farm’s initial health. To do this, run the following PowerShell (with thanks to Matthew McDermott for this):
$jobs = Get-SPTimerJob | Where-Object {$_.Title -like "Health Analysis Job*"}
foreach ($job in $jobs)
{
  $job.RunNow()
}
You can also see in Figure 7-26 the ability to manually rerun an individual rule to see if it is now being followed. This will only queue the timer job to run when resources are available, which may not be instant. The Review Problems and Solutions page, accessed under Health Analyzer in the Central Administration Monitoring section (see Figure 7-21) shows any problems your farm may be having.
Timer Jobs
Timer jobs are the clockwork mechanism of SharePoint—the cogs and moving parts of the system. You can monitor them from the Review Job Definitions page, accessed under Timer Jobs in the Central Administration Monitoring section; you can also manually run them to ensure they are working. The Check Job Status Page lets you see the history of when jobs were last run and if they were successful. This can be useful for troubleshooting.
Diagnostic Logging
There are three settings in diagnostic logging you can set for SharePoint.
- Event Throttling
- Event Log Flood Protection
- Trace Log
These are accessed in Configure Diagnostic Logging under Reporting in the Central Administration Monitoring options. Let’s consider each of these settings.
Event Throttling
Event throttling enables administrators to control the types of events that SharePoint Server logs based on the level of severity. The administration of throttling is divided into destination and category. Destination log entries can be reported in two places. The first is the standard Windows Event Log, which I have already discussed. Administrators can use the Windows Event Viewer application to review entries. The second is the ULS or “Trace Log,” a text-based log format that is specific to SharePoint Server and is stored on the file system.
The event throttling dial can be applied to specific categories that map directly to SharePoint Server functionality. This enables the administrator to increase the logging detail for SharePoint components individually, thereby managing the size of the logs and the amount of information to review. The default settings for all categories are as follows:
During normal operation, these settings are an appropriate balance of detail and performance. During substantial reconfiguration of SharePoint Server, during the installation of custom solutions, or when SharePoint Server is experiencing issues, the throttling dial should be turned down. This ensures as much information as possible is available for troubleshooting. Finally, after completing any troubleshooting, logging can be returned to the default by selecting the “Reset to default” option in the throttling drop-downs. Settings that are not currently configured with the default option will appear in a bold font.
Event Log Flood Protection
Event Log Flood Protection prevents the Event Log from being overwhelmed with many repetitive events. When it is enabled (default), it will start trimming events after the same event is logged five times within two minutes. At this point, it suppresses additional entries. After an additional two minutes, it throws a summary event that describes the number of times that the event would have been repeated. An administrator can modify these thresholds.
Trace Log
The trace logs are the standard log files for SharePoint. They are tab-delimited text and open with any tool that can open text files, but as I mentioned, the ULS viewer is a great way to look at these. By default, trace logs are located in the LOGS directory of the SharePoint root (also called the 14 Hive or 15, etc. in later versions) at C:Program FilesCommon FilesMicrosoft SharedWeb Server Extensions14.
Summary
Mens sana in corpore sano (“A sound mind in a sound body”)
—Juvenal, Satire X
You can see there are two ways to approach monitoring SharePoint: through the general Windows tools like Event Viewer in Server Manager or monitoring in SharePoint Central Administration. Which is better? I think of SharePoint as the mind: it contains the information generated by users and developers. The farm hardware, network, and software is the body: it sustains and holds the SharePoint application. If the body is sound, the mind will be, too. The SharePoint application is so dependent on the network infrastructure that if anything is wrong with SQL Server or Windows or the network, it will affect SharePoint. I tend to keep my monitoring focus on Windows in general as there is more that can go wrong there. If I can’t identify the cause there, I look deeper into the SharePoint logs via the ULS viewer. The information in this chapter gives you the guidance and direction you need to do the same.