
Chapter 3
Features and Their Prioritization
3.1 Introduction
The input for the release planning process is a set of features that are evolving over time due to changing user requirements and better problem understanding. Intuitively, features are key distinctive characteristics of a product. Features are an abstraction from requirements that both customers and developers understand. They are seen as the “selling units” of a product.
Prioritization of features is the process of assigning a priority to them. This is typically done by multiple stakeholders and related to multiple criteria. Prioritization sounds simple but it is not. Already on a conceptual level, you need to specify who is doing the prioritization, what is being prioritized, according to which criteria, and based upon which scale. And how should the different stakeholder opinions related to the different criteria be combined?
Features are the key objects of study of this whole book. There is no universally applied definition of what constitutes a feature. Intuitively, a set of logically related requirements will be called a feature in this book. Features, their definition and their classification are the subject of Section 3.2. Product release planning assumes that the candidate features are well defined as a result of a feature elicitation process. This elicitation is discussed in Section 3.3. Feature elicitation is an ongoing process. Once a set of features is defined for planning purposes, then feature prioritization can be done. Feature prioritization is in the category of a triage decision problem (using the terminology introduced in Chapter 2). Criteria for feature prioritization are the content of Section 3.4. A process and criteria for the selection of stakeholders participating in the prioritization of product features are studied in Section 3.5.
Prioritization precedes assignment of features to releases. The prioritization process can be performed in a variety of ways. [Firesmith ‘04] gives an overview of requirements prioritization criteria and techniques. An evaluation of requirements prioritization techniques has been done by [Karlsson et al. ‘98]. Different prioritization methods were compared in [Berander and Andrews ‘05] in terms of their scale, granularity and sophistication. For our purposes, one prominent technique (the Analytic Hierarchy Process [AHP]) is described in Section 3.6. AHP will be used later in other parts of the book. In Section 3.7, a multi-criteria and multi-stakeholder scoring technique called Multi-score is proposed. This technique is one of the key process phases in the systematic product planning method EVOLVE II as described in Chapter 6. Among others, it offers a variety of options for analyzing the different types of results obtained form the multi-dimensional prioritization process presented in Section 3.8. The different options are the content of Section 3.9.
3.2 Features
Features represent the value-unit to the customer. Definitions of features are abundant in the literature. The notion is perceived differently according to the context of the problem in consideration or the characteristic of the approach. FODA (Feature Oriented Domain Analysis) [Kang et al. ‘90] defines a feature as a prominent and distinctive user visible characteristic of a system. In [Reid Turner et al. ‘99], three informal definitions are proposed: subset of system requirements, subset of system implementation, and aggregate view across life-cycle artifacts. Wiegers has defined a product feature as a set of logically related requirements that provide a capability to the user and enable the satisfaction of business objectives [Wiegers ‘03]. In this book, Wiegers’ definition is followed.
The concept of a feature is applicable and important for any product development paradigm. However, it is especially important for incremental development. As an abstraction of requirements, the identification of features is mainly based on the exploration of requirements. The task is not trivial and needs a systematic approach. This motivates many researchers who deal with feature modeling. The end result of a feature model is a classification scheme. According to their usage, [Griss et al. ‘98] distinguishes three categories of features:
Mandatory features: These are the features used to identify the product. For example, for a mailing system, the mail client must have the ability to type messages.
Optional features: These features, when enabled, add some value to the core functionality. For the example of the mailing system, a dictionary might be an optional feature.
Variant features: These are alternative ways to describe optional or mandatory features. For example, some e-mail clients may offer text editors with varying functionality in terms of importing and exporting files.
Another classification scheme uses the external visibility of features (how a feature is visible to the end user) as the distinguishing attribute [Lee et al. ‘02]. This scheme assigns features into four layers in which the first one is the closest, that is, most visible, to the user.
Capabilities (distinct services, operations or non-functional characteristics, which can be identified by the user),
Domain technology (the way the operations or services are implemented),
Implementation technique (generic techniques used to implement operations or services), and
Operating environments (where the application operates).

Figure 3.1 Classification of features according to usage and external visibility
In Figure 3.1, the two schemes are put together into a joint one. For the actual description of features, different types of information need to be collected in a feature repository. This information typically relates to the name, ID, description, origin, dependencies and status for each of the features. As an example for a description scheme, in Table 3.1, a structure is given which largely follows the scheme suggested by [Regnell and Brinkkemper ‘05]. An example attribute from this scheme is the state of a feature. It refers to the features life-cycle status ranging from candidate to released. To keep the feature repository up-to-date, it needs to be changed whenever some feature-related information (such as its state) changes. While all of these attributes are somehow relevant, it is not expected that all this information is available all the time.
Maintenance of the feature repository is one of the responsibilities of the product manager. Even if not all information is available for all features, it should be as complete as possible. For prioritization and product release planning, a pre-selection of features is typically done to keep the process more time-efficient. At this point it becomes clear how important it is to synchronize the release planning process with other accompanying processes such as effort estimation, needs elicitation, customer relationship management, as well as project tracking and control.
Table 3.1 Feature characterization scheme (based on [Regnell and Brinkkemper ‘05])

3.3 Feature Elicitation
Understanding stakeholders, especially understanding customer needs, is still one of the key success factors for product development. Without the early effort to elicit customer needs, there is a substantial risk that the product delivered is not what the customer needs or what the customer is expecting. This is exactly the motivation for the early effort on feature needs elicitation and prioritization of a set of candidate features.
The process of feature elicitation is the art of determining the needs of the stakeholder [Davis ‘05]. Dieste et al. have conducted a comprehensive analysis of existing elicitation techniques and their performance [Dieste et al. ‘08]. From looking at 30 studies (since 1987), the authors found 43 different techniques. It is widely acknowledged that the term stakeholder needs is a somewhat fuzzy concept. It varies between stakeholders and also varies over time. The difficulty of the elicitation process not only results from the variety of possible techniques, and the question of deciding on which ones to use, but also from the fact that elicitation is so time and context specific.
In the feature elicitation process, a number of inherent difficulties exist:
The stakeholder does not yet know precisely what he or she wants.
The stakeholder changes his or her opinion on what is wanted.
The stakeholder does not properly express what is wanted.
The requirements engineer does not properly understand what the stakeholder wants.
The description and specification given by the requirements engineer are ambiguous and misleading.
Existing elicitation techniques have different capabilities to address some of these difficulties. The portfolio of techniques ranges from the different styles of interviewing (with or without prepared structure), protocol analysis, scenario playing, brainstorming and group meetings to the different types of prototypes offered to the stakeholder in order to better allow him or her to understand and judge features. For further discussion of the strengths and weaknesses of individual techniques, take a look at [Davis ‘05] and [Zowghi and Coulin ‘05].
The actual choice of the technique depends on, and is impacted by the content and the domain of the feature, the depth of knowledge available and requested, the time available for running the process, the number and the size of the features, and the commitment of the involved people. In general, it might be worthwhile to look at a combination of techniques having complementary strengths.
3.4 Criteria for Feature Prioritization
Once a set of candidate features is agreed upon, the question of what constitutes the right features needs to be answered in the specific context of the project. In fact, the question of what is right is harder to answer than actually selecting the features. In what follows, a list of prioritization criteria is provided. Without trying to be complete, the criteria give different interpretations of what might be considered to be attractive.
Customer satisfaction
The needs of the customers are of key importance, and the degree of match between their needs and the proposed features is called customer satisfaction (with a specific feature). An attractive feature will largely match the expectations of the key stakeholders, especially customers and users.
Customer dissatisfaction
If we look at a specific feature ABC, then there is a slight difference between being very satisfied if ABC is delivered in the next release versus being very dissatisfied if ABC is not delivered in the next release. The first statement does not automatically imply the second. In other words, the planning can be directed toward high customer satisfaction or toward low customer dissatisfaction.
Risk of implementation
How risky is the implementation of the feature? How novel is the feature? How well is the process of implementation already known and understood? At which part of the overall project will the feature be implemented? Is its implementation targeted at a stable or more unstable component? How many components are impacted by this implementation? All of these questions are related to the risk of implementation. The lower the risk, the more attractive the feature becomes.
Risk of acceptance
How risky is the acceptance of a feature by customers? Is the feature the result of a careful voice-of-the-customer analysis? Or is it more speculative? Having a lower risk of acceptance will contribute to the attractiveness of a feature.
Financial value
High customer satisfaction typically implies good business value. However, it is not exactly the same. Products can have features that impact the price of the product, but not primarily the customer satisfaction. A feature can eventually be so dominant that its presence strongly supports the acceptance and thus the financial value of the whole release, more or less independent of the remaining features.
Cost
The different features have different (estimated) costs for their implementation. This primarily relates to the total amount of resources requested for a feature’s implementation. Even though the cost is hard to estimate in detail, a sufficiently detailed classification would be useful early-on.
Urgency
To provide the right feature at the right time is another challenge of planning. Certain features are more urgent than others. Urgency can be caused by the needs of the customers or the need to stay competitive in the marketplace.
Readiness
Is the feature ready for implementation? Besides a clear understanding of its functionality, readiness also refers to the status of implementation (e.g., the availability of resources or the healthiness of the target component).
Frequency of use
Is it true that the more features are offered the better the product is? The downside of this premise is that the user has more and more difficulty handling a myriad of features. Looking at the frequency of use would help us to concentrate on the ones most likely to be expected and used by customers [Wiegers ‘00].
Ease of use
Similar to frequency of use, features could be also judged by their ease of use. Sophisticated but difficult to use features can create disappointment on the customer side, and the potential value needs to be balanced against the risk that this value is not materialized.
Ideally, features fulfilling all of the above-mentioned aspects simultaneously with a good or very good rating would be the ones the product manager is looking for. However, such features seldom exist. So, the final decision depends on how important the different attributes are in the context of the project. Furthermore, the cost of implementation of the features will play an important role for making the final release decisions.
Prioritization of features depends on the criterion chosen, but also on the stakeholders selected. Similar to the variation between criteria when looking at just one stakeholder, there is the possibility that for one fixed criterion there are completely different opinions between stakeholders. What we can learn from this is that “the battle for the right features” (as another term for release planning) starts with the proper definition of the features, with a careful selection of stakeholders, and with a company and project-specific commitment on what goals are most important to be achieved.
3.5 Selection of Stakeholders
Once the candidate features are defined and the prioritization criteria are agreed upon, the nomination of stakeholders needs to be undertaken. What is a stakeholder in the process of product release planning? [Sharp et al. ‘99] collected a number of possible definitions of what constitutes a stakeholder. Without going into the details here, the stakeholder term is used for anyone influenced by or influencing the release planning process and its resulting product.
Stakeholders can play very different roles for the definition of the product planned for. They can be related to the design or development of the product, they can have a financial interest by the sale or purchase of the product, they can be responsible for the introduction and maintenance of the product, or they can have an interest in the use of the product. All of these roles and perspectives are relevant, and their opinions often are contradictory. One of the challenges of product release planning is to determine a well-balanced product plan that addresses the most relevant concerns. In Figure 3.2, a number of these roles are arranged in what is called a stakeholder network.
Despite the obvious importance of stakeholders, there is a lack of constructive guidance on how to find “the right set” of stakeholders. [Sharp et al. ‘99] presented an approach addressing this gap. The starting point of their method is to define what they called baseline stakeholders. Under this category, four groups of stakeholders are summarized:
Users and customers,
Legislators (such as professional bodies, trade unions, legal representatives, safety executives or quality assurance auditors),
Developers, and
Decision-makers of a company (such as the CEO or shareholders).

Figure 3.2 The stakeholder network
Once the baseline stakeholders are established, the authors suggest a five-step procedure to add further stakeholders to one of the four established groups. With the stakeholders defined and the criteria set-up, the process gives stakeholders access to a prioritization scheme. This access defines who is prioritizing what and how prioritization is done. A process needs to be prepared where stakeholders can articulate their preferences in a time-efficient manner. Meetings to bring all the relevant parties together are very costly and hard to realize in practice. In Chapter 10, Web-based tool solutions are described allowing stakeholders to provide their priorities and feedback at any time and anywhere. On top of that, if needed, meetings can be held to focus on specific conflicts, narrowing the scope of discussion and thus reducing the total effort needed.
3.6 Prioritization by Comparison: The Analytic Hierarchy Process AHP
3.6.1 Overview
Preferences or relative importance of competing alternatives are often not explicitly known. AHP is a quantification technique of subjective judgments and allows decision-makers to model a complex problem in a hierarchical structure. This structure relates the goal, objectives (criteria) with the possibility to include sub-objectives, and alternatives of the problem.
AHP has been developed at the Warton School of Business by Thomas Saaty [Saaty ‘80]. AHP is based on three basic principles: decomposition, comparative judgment and hierarchic decomposition or synthesis of priorities [Saaty ‘94]. The decomposition principle is used for stepwise refinement of a stated goal against sub-goals (or criteria). The principle of pair-wise judgment is applied to evaluate pairs of alternatives from the perspective of a stated criterion or to judge the importance of sub-goals in the light of the stated goal. Finally, the principle of synthesis of priorities provides an aggregation of the local priorities determined from pair-wise comparison into global priorities for the stated alternatives.
AHP allows decision-makers to assign ratio scale priorities to alternatives applying a sequence of pair-wise comparisons. The comparison itself is based on a nine-point scale expressing the degree of preference between the two alternatives under consideration. Assuming two options (which can be alternatives or criteria) called A and B, a nine-point scale is used based on the following transformation from verbal into numerical judgment: If A is verbal judgment to B, then numerical value. The different combinations between verbal and numerical judgement are summarized in Table 3.2.
A pair-wise comparison matrix is used to determine relative weights of criteria and sub-criteria as well as the evaluations of alternatives. The decision-maker is looking at all pairs from the perspective of just one criterion. At this point, all the other criteria are ignored.
Table 3.2 Nine-point scale for pair-wise comparisons in AHP

At the end of the process, AHP will provide a complete ranking between candidate alternatives. The generation of alternatives is crucial for any decision-making activity. For making good decisions, it should be ensured that all possible candidate solutions are considered. If essential alternatives are missed then the suggested solution will not be the best possible, but just the best among the ones considered. That is why this step is of crucial importance. At the end of this process, a set of (ranked) alternatives is established.
3.6.2 Illustrative example
For illustrative purposes, the question to define some priority level for three groups of features to be developed for the next generation of a product is studied. For finding the right mix between these feature groups, three groups of users are taken into consideration. They represent the layer of objectives:
Novice users (C1)
Advanced users (C2)
Expert users (C3)
The feature group alternatives are:
Group of analysis features (A1)
Group of reporting features (A2)
Group of data exchange features (A3)
The hierarchical structure, representing the three layers and their dependencies, is shown in Figure 3.3. Ignoring the details of all the pair-wise comparisons for the three criteria (user groups) from the perspective of the overall business attractiveness, a vector of normalized degrees of relative importance called Weight(0) is obtained in (3.1).
(3.1) Weight(0) = (0.644, 0.271, 0.085)
The first component of the vector corresponds to the first group of users. It can be concluded that the novice users are considered by far the most attractive group, while expert users are the least attractive among the three. For each of the three criteria, another cycle of comparisons is done for comparison between the groups of features from the perspective of a specific user group. When looking at novice users, the comparison produces in the following results:

Figure 3.3 Hierarchical graph structure
The group of analysis features is equally to moderately preferred to the group of reporting features (value = 2)
The group of analysis features is strongly preferred to the group of data exchange features (value = 5)
The group of reporting features is moderately strongly preferred to the group of data exchange features (value = 4)
These pair-wise comparisons result in degrees of relative importance for the alternatives (groups of features) summarized in a vector Weight(1) given in (3.2).
(3.2) Weight(1) = (0.570, 0.333, 0.097)
In the same way, it is assumed the comparisons were done from the perspective of the other two user groups resulting in weighting vectors Weight(2) and Weight(3) given in (3.3) and (3.4).
(3.3) Weight(2) = (0.100, 0.300, 0.600)
(3.4) Weight(3) = (0.117, 0.683, 0.200)
All these results are combined by multiplication of the vector of weights of the criteria with the matrix composed by the weights of the alternatives as determined from the perspective of the individual criteria. In our example, this results in the global weight vector (0.404, 0.354, 0.242) suggesting the first feature group being overall of highest attractiveness, followed by the second one, and the third one being the least attractive. In our case, this result was obtained from doing 4-3 = 12 pair-wise comparisons and some eigenvalue computations supported by tools such as Expert Choice [www.expertchoice.com ‘08].
3.6.3 Applicability
AHP has been successfully applied in different decision scenarios. For an overview of the great variety of applications, the reader is referred to [Vaidya and Kumar ‘06]. The definite strength of AHP is its conceptual clarity and ease of application. The AHP method is compensatory in the sense that is allows one to consider alternatives from the perspective of different objectives and to bring them together.
There is a well-known scalability problem with the AHP method. The method is comprehensively based on conducting a series of pair-wise comparisons. But already for a relatively small problem with n = 10 alternatives and just K = 5 criteria, a number of K·n·(n-1)/2 = 5·10·9/2 = 225 comparisons needs to be conducted. This is substantial, and it gets easily prohibitive for larger problems. Efforts have been made (such as [Harker ‘87]) to decrease the number of comparisons. On the downside, this reduces the ability to identify inconsistent judgments [Karlsson et al. ‘98].
3.7 Prioritization by Scoring
3.7.1 Scoring with one criterion
Scoring will become an essential element of the prioritization process being part of the EVOLVE II method presented in Chapter 6. Scoring is the (often applied) process of classifying alternatives. This is expressed by assigning a score to them. Scoring can be done in different ways depending on the number of criteria used, the number and role of participants, the process of scoring, the total number of scores available per participant, and the number of scores that can be assigned per individual alternative. In our context, the scorer is a stakeholder in the process of prioritization of features.
For the scoring itself, a scale as defined in Table 3.3 is introduced. With the same arguments as for the AHP process, a nine-point scale is considered sufficiently detailed to differentiate between features. In principle, any other ordinal scale could be used instead. For simplicity reasons, it is also assumed that each stakeholder is scoring each feature. Both the scoring and the subsequent analysis remain applicable for the case that a stakeholder has “no opinion” related to a feature, eventually, because the feature is not understandable to the stakeholder.
Table 3.3 Correspondence between priority level and numerical score

3.7.2 Illustrative example
The feature prioritization case study introduced in Section 2.2.1, Chapter 2, is reconsidered. Eight stakeholders are invited to provide their input into the prioritization process. The stakeholders are selected to represent the most important internal roles in the SIP organization (Product Manager, Chief Executive Officer, Chief Technology Officer, Chief Financial Officer) as well as the four key customers representing different regions called East, West, North and South:

In order to allow differentiation in the importance of stakeholders, a nine-point scoring classification is applied in the same way as defined in Table 3.3. The weights of the eight stakeholders selected for the case study example are given in Table 3.4.
Table 3.4 Degree of importance (weights) for the eight stakeholders

In Table 3.5, the result of the scoring process for 20 candidate features with eight stakeholders is shown. To make the prioritization results more meaningful, an explicit prioritization perspective Frequency of use is given. This will later be combined with a perspective on the features’ value. Typically, different perspectives are relevant, and the results will differ among the different perspectives taken. From the scores given by the stakeholders, it is observed that the feature Cost Reduction of Transceiver received the highest priority from Stakeholder 2. Just looking at the same stakeholder, it can be seen that all features of Group E are considered to be of between low and extremely low importance.
In Table 3.5, the column Weighted average score provides the information about the average score from all eight stakeholders where stakeholder scoring is multiplied by their degree of importance. The feature with ID = 1 has the highest weighted average score.
There are a number of limitations when using this approach. The first limitation relates to the usage of just one criterion. The importance of feature can hardly be judged by just looking at their frequency of use. The second limitation comes from the observation that the number of scores allocated by the different stakeholders varies substantially. Stakeholders 5 and 8 have allocated 65 scores in total. On the other side, stakeholder 7 has spent 114 scores. This means, the scores assigned by that stakeholder will have a higher impact on average. Both of these limitations are overcome by the prioritization method presented in Section 3.8.
Table 3.5 Prioritization of 20 features by 8 stakeholders for frequency of use

3.8 Prioritization Method Multi-Score
Multi-score is an advanced scoring method where scoring is done for each of a set of criteria. Typically, the different criteria will generate different ranking of features. Scoring itself is based on a nine-point scale as specified in Table 3.3.
Cumulative scoring (called 100-Dollar-test in [Berander and Andrews ‘05]) allows only the allocation of a limited amount of scores among the alternatives (features). As an implication, if the total available amount of scores is small enough, cumulative scoring implies that not all alternatives can be ranked as having high importance. Typically, each stakeholder has some high priority alternatives. Then, cumulative scoring enforces the process of thinking about which of the alternatives might be less important (in order to stay within the scoring budget).
Cumulative scoring can become complex if the number of alternatives becomes large. At this point, grouping features might be a useful technique to reduce complexity. With a partition of the set of all features into subsets of smaller size, the idea of cumulative scoring can be applied in hierarchical manner [Berander and Joensson ‘06]: First allocating scores between all the groups, and second allocating scores within each group.
Formulated for the case of prioritization of features, Multi-score contains the following main steps:
Definition of features (prioritization objects) and their groupings (if any)
Nomination of stakeholders (prioritization subjects) and their groupings (if any)
Definition of prioritization criteria and their weights
Definition of prioritization mode with the two dimensions
Decision about cumulative versus non-cumulative scoring and
Definition of scoring assignments: which stakeholder is assigned to which group of features and to which criteria?
Scoring by stakeholders according to the defined mode
Analysis of scores
The scoring is intended to provide the decision-maker (in our case, the product manager) further insight into the preference structure of features, thus facilitating decision-making. For that purpose, a collection of possible analysis options is explained in the next section.
3.9 Voice-of-the-Stakeholder Analysis
3.9.1 Overview
In order to provide a more rigorous description of a variety of analysis options, some key notation is introduced. It is assumed that scoring is performed for all combinations of
Features f(n) (n = 1.. .N),
Prioritization criteria denoted by crit(k) (k = 1.. .K), and
Stakeholders denoted by stake(p) (p = 1.. .P).
Definition (score): A score is a value denoted by score(n,k,p) expressing the judgment of stakeholder stake(p) toward feature f(n) from the perspective of criterion crit(k). □
Once stakeholders have given their scores, data analysis tries to provide insight into the overall preference structure between features. This is also called voice-of-the-stakeholder analysis. Differences and commonalities in the scoring between (groups of) stakeholders, (groups of) features, and between the different criteria are detected and different forms of ranking and comparisons are done.
In what follows, a variety of 10 analysis options will be described. It is the product manager who finally decides which one is chosen in the context of a concrete feature prioritization project.

For each option, its main content is briefly explained in the following subsections. In addition, it is illustrated by an example how the analysis chart created from the stakeholder scores helps us to understand and address the original question. The example is the same features prioritization scenario introduced in Section 2.1, with some detailed data already provided in Table 3.5. Besides the criterion frequency of use, the features were also evaluated from the perspective of their anticipated business value. Business value relates to the expected impact of the feature on revenue of the product.
All the screen-shots shown were generated from the Web-based decision support system called VeryBestChoiceLight [VBCLight], which is described in further detail in Section 10.2.
3.9.2 Ranking of features based upon a single criterion
Analysis Option 1: For a given prioritization criterion and the whole set or a group of features, the features need to be ranked according to their weighted average priorities.
The definition of a weighted average follows the standard formulas given in descriptive statistics [Black ‘06]. The (complete) ranking of features gives the order of their anticipated frequency of use. In Figure 3.4, the ranking results for the criterion frequency of use are presented. According to that, the feature Cost Reduction of Transceiver (ID = 1) is most preferred. The weighted average score of the feature is 6.49. The least attractive feature is MFRM Flight Recorder Enhancements (ID = 20) with a weighted average score of 2.40.
In addition to the ranking of features based on the weighted average score, the disagreement value between stakeholder scores per feature is given. It can be seen that there is substantial agreement between stakeholders that feature f(20) is the least important. The disagreement measure is explained in more detail in Section 3.9.4.
3.9.3 Ranking of features based upon multiple criteria
Analysis Option 2: Instead of looking at just one criterion for ranking the features, it can be important to consider several criteria in conjunction. To keep the method sufficiently simple, the issue becomes ranking the features for the (weighted) sum of all the weighted average priorities.
For the case study example, Figure 3.5 shows that feature f(1) is ranked highest in total, although feature f(9) would be most important when just looking at urgency in isolation. For what is called indirect criteria such as risk or volatility, it is true that the lower the score, the higher the priority of the feature (which is opposite from direct criteria). To combine different criteria, the weighted average value z of an indirect criterion needs to be transformed into another value z’ = 10 − z. This needs to be done in order to keep the semantics between the criteria consistent.

Figure 3.4 Ranking of features based upon their frequency of use

Figure 3.5 Ranking of features based on the sum of weighted averages of stakeholder scores for two criteria
3.9.4 Ranking of features based upon the level of disagreement between stakeholders for single criterion
Analysis Option 3: For deciding about features, besides their weighted average stakeholder scoring, it is also important to know about the level of disagreement between stakeholders related to the feature. If there is a stronger level of disagreement, this should initiate some further analysis into its root-cause.
The level of disagreement is measured by the statistical standard deviation [Black ‘06]. For our example, Figure 3.6 offers a ranking of the features in decreasing order for the scores on frequency of use given in Table 3.5. It becomes clear that the feature 3 of N Band Class Support (ID = 12) overall creates the highest controversy among stakeholders. This might be used by the product manager as an indication to further look into the definition of this feature (if it unambiguously defined) or to discuss the controversial opinions directly with the stakeholders. On the other hand, a low level of disagreement (as for features f(4), f(16), f(17) and f(20)) is an indicator of reliability in the consideration of the features’ priority.
3.9.5 Ranking of stakeholder scores for a fixed feature based upon single criterion (Pareto analysis)
Analysis Option 4: For a given feature f(n) and a given prioritization criterion crit(k), all the priorities score(n,k,1) ... score(n,k,P) provided by the P stakeholders are considered. The question is how the stakeholders are ranked based on their score given to this feature.
Figure 3.7 illustrates the analysis. Based on the priorities described in Table 3.5, stakeholder priorities assigned to feature f(7) are ranked. All the stakeholders who have provided their priority are ranked in decreasing order. Besides the ranking, the Pareto chart also shows the range of scores assigned to this feature (in this case, from 7 to 1).
The graph is accompanied by a line graph, which shows the cumulative totals of scores, taken from left to right. For example, the cumulative percentage of the total number of scores gives the information that 51.28% of the total amount of scores is provided by the top three stakeholders, and that 76.92% of the total amount of scores being given to this feature are provided by the top five stakeholders. In case of a larger number of stakeholders, and especially in the case of stronger variation between stakeholder scores, the results of the Pareto analysis are considered a valuable piece of information in the context of stakeholder prioritization analysis.

Figure 3.6 Ranking of features based on the level of disagreement between stakeholders for single criterion
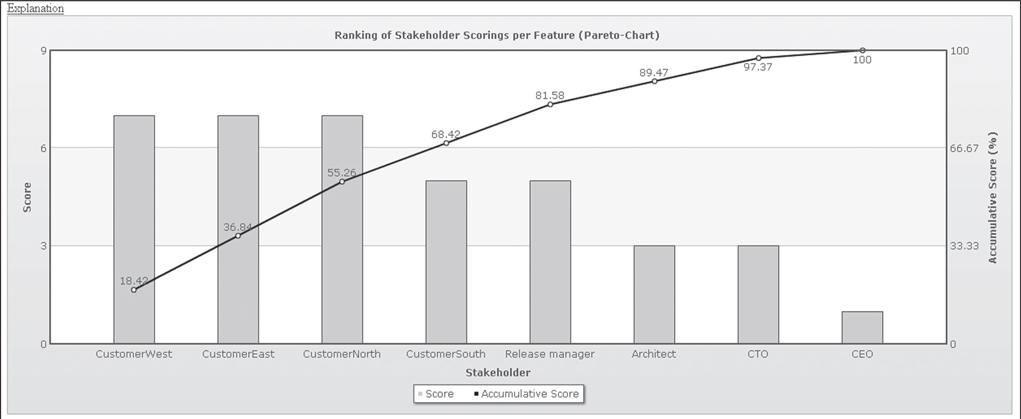
Figure 3.7 Ranking of stakeholder priorities for feature f(7)
3.9.6 Comparison of stakeholder scores for a fixed feature based upon multiple criteria
Analysis Option 5: For one specific feature under consideration, the question under consideration is to compare the scores given to this feature between the different stakeholders and between the different criteria.
This analysis allows both the comparison of the scores between both the stakeholders and between criteria. For a fixed feature and a fixed criterion, the user can compare the scores of the different stakeholders. On the other hand, for a fixed feature and a fixed stakeholder, one can see how the different criteria were ranked.
Looking at the Telco example project data again, feature f(8) is considered as an example. In addition to the evaluation of the feature in terms of frequency of use, Figure 3.8 also shows the stakeholder scores for urgency. It can be seen that there is a discrepancy between the scoring for the two criteria as most of the stakeholders have considered urgency more critical than the actual expected frequency of use. The only exception to that is the CEO stakeholder who has the opposite opinion in that matter.
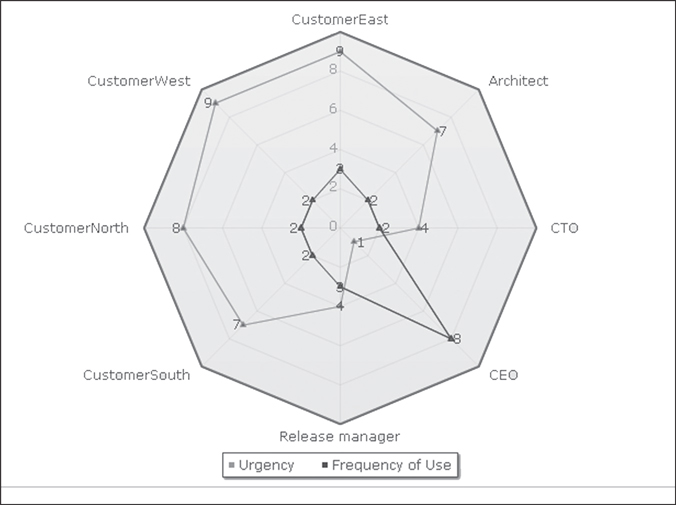
Figure 3.8 Comparison of stakeholder priorities for feature f(8)
3.9.7 Trade-off analysis for stakeholder scoring
Analysis Option 6: For a given set of features, the question here is to compare the features in terms of their weighted scoring averages gained for two selected criteria.
Comparison of all objects in terms of two criteria is called trade-off analysis. It allows us to look at the weighted average scores of all (or a selected group of) features. The trade-off analysis shows which features perform favorably for both criteria, which ones perform below average for one of the two criteria, and which ones are below average for both criteria.
Figure 3.9 illustrates this analysis for our example by showing the trade-off analysis when looking at both urgency and frequency of use. Consequently, the feature Cost reduction of transceiver in the upper left quadrant looks most promising, while features positioned in the lower left quadrant look to be the least promising ones when taking both criteria into account.
3.9.8 Comparison of weighted averages of stakeholder scores for feature groups based upon multiple criteria
Analysis Option 7: For this analysis option, feature groups are considered. The question is to compare the weighted average scores defined for the groups of features. The comparison is between groups for different criteria.
For each group, the weighted average score for both criteria of our illustrative example is shown in Figure 3.10. It is observed that the urgency score is consistently higher for all five groups compared to the frequency of use score. The features of Group A have received the highest average priority rating in both criteria. The difference between the two criteria is biggest for Group E (Robustness features).
3.9.9 Per feature scoring comparison between groups of stakeholders
Analysis Option 8: The question is to compare between the features in terms of the frequency of scores assigned to this feature. This information gives an aggregated view of all the frequency distribution of individual stakeholder scores.
To make this comparison easier, the original nine-point scale is transformed into a more coarse-grained three-point scale. The three classes are defined in (3.5) to (3.7):
(3.5) Class A (Low): Priorities 1, 2 and 3 of the nine-point scale
(3.6) Class B (Average): Priorities 4, 5 and 6 of the nine-point scale
(3.7) Class C (High): Priorities 7, 8 and 9 of the nine-point scale
To facilitate the comparison, features are arranged in decreasing order in terms of their weighted average stakeholder priority. The results of our illustrative example are provided in Figure 3.11. The criterion used is frequency of use. For example, the first feature (ID = 1) has been prioritized by 37.5% (i.e., 3 out of 8 stakeholders) of the stakeholders as of being in category high. The rest of the stakeholders have classified the feature as having average priority, with no one scoring it as low. These portions of the three categories change when you compare to lower ranked features.
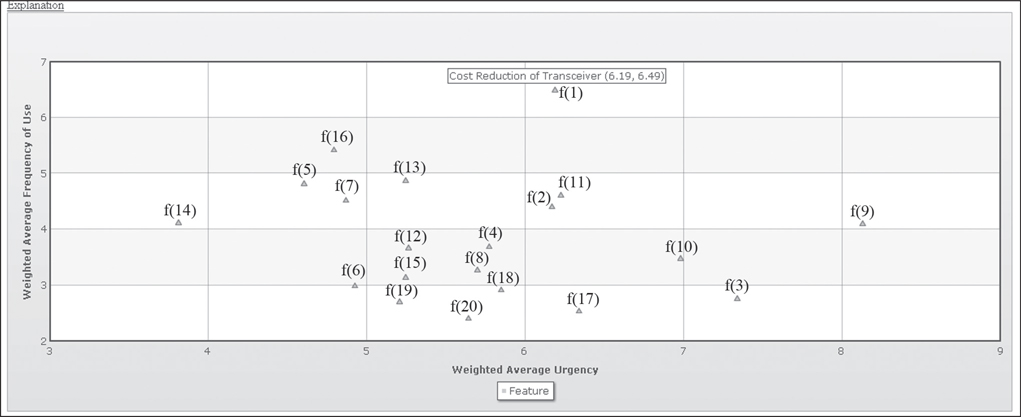
Figure 3.9 Trade-off analysis for frequency of use versus urgency criteria

Figure 3.10 Comparison of weighted averages of stakeholder scores for five feature groups and two criteria

Figure 3.11 Frequency distributions of scoring categories low, average and high for the data from Table 3.5
3.9.10 Comparison of frequency of scoring between groups of stakeholders
Analysis Option 9: For a given criterion, the question is to perform a per feature comparison of the frequencies in scoring categories as defined in (3.5) to (3.7) between two given groups of stakeholders.
The motivation for this question might be that the product manager wants to find out commonalities and differences in the priority profiles between groups of stakeholders. The profiles might vary for different groups of clients. Similarly, a comparison between internal and external stakeholders might be of substantial interest.
In Figure 3.12, the comparison is made between internal stakeholders (CEO, CTO, release manager, chief architect) and external stakeholders (four sales representatives). For all 20 features, the difference between the absolute number of occurrences is studied for all three defined categories. Only bubbles of those features are shown where any deviation occurred. The bigger the bubble in a category, the more significant is the difference between the two stakeholder groups in their scoring related to this category. For example, if feature f(7) Patching Improvements/Upgrade Enhancements is considered, differences in all three categories can be observed. The largest differences for this feature are in the high and low categories. This is a clear indication that there are good reasons to perform a root-cause analysis to better understand the reasons for the deviations. On the other hand, only minor differences (in the low and average category) were observed for features f(5) and f(19).
If the perception of importance of features considered between internal and external stakeholders is significantly different, then it cannot be automatically assumed that the internal stakeholder represents all stakeholders (as it is sometimes the case in reality).
3.9.11 Comparison of frequency of scoring between groups of features and between groups of stakeholders
Analysis Option 10: A given set of (groups of) features is considered. The question of investigation is to compare the frequency of scoring between different groups of stakeholders for the different groups of features under the premise that the prioritization criterion is fixed.
This question is motivated by the study of scoring patterns between groups of features and groups of stakeholders. If a group of features is selected, then it would be interesting to see if there is a pattern between the frequencies of scoring when comparing the scores of different groups of stakeholders.
The question is illustrated in Figure 3.13. It is observed that the distribution for the fourth group of features looks quite different between internal and external stakeholders. Of the internal stakeholders, 25% have assigned high scores to features from this group, while there is no high score from the external stakeholders for this feature group. On the other side, the scores for the third group of features look quite similar between the two groups of stakeholders.

Figure 3.12 Per feature comparison of scoring categories between internal and external stakeholders

Figure 3.13 Comparison of frequency distribution of urgency scores for two groups of stakeholders and five groups of features
3.9.12 Summary
In total, 10 different analysis options for stakeholder scoring have been presented. In Table 3.6, a classification of all the different options has been made. While the list is not intended to be complete, it offers a variety of alternatives the decision-maker can chose from to make final priority and release decisions.
Table 3.6 Classification of options for analyzing stakeholder scores
