
Chapter 12
Case Study: Staffing For Product Releases
12.1 Introduction
With all the knowledge gained about methods for staffing, the question becomes: How does all this apply in a concrete case study project? John, the product manager at our sample telecommunications company SIP Inc., is working closely with Jane, one of the project managers of the company. Jane’s responsibility is to ensure that the plans created and revised by John are properly scheduled, and that the assignment of developers to perform the individual tasks is feasible and efficient. Staffing for product releases needs to be done almost continuously. Jane has to make weekly staffing decisions related to the following questions:
Which features will be implemented next?
Which tasks are assigned to whom?
In which order should the tasks be performed?
How do we react to changed plans?
How do we react to changes on the availability of personnel?
The main interest in this chapter is on staffing of plans that have been obtained as the result of strategic planning. At the strategic level, resources were considered in a cumulative way, without looking into the details of an individual task to be done at a specific interval. The different levels of skill of the developers have been left out of consideration as well.
Hiring and staffing decisions have a strong impact on project performance and success. Because of their importance, there is a growing interest in providing rigorous support. In [Choi et al. ‘08], continuous simulation based on system dynamics [Abdel-Hamid ‘89] is studied. As discussed by [Malinowski et al. ‘08], there are two difficulties in this decision-making process. The first difficulty refers to the proper evaluation of the degree of fitness of a single candidate with a required profile. The second difficulty is related to the decision of how well a given candidate would fit into an existing team when looking at the sum of the team competencies. Both questions are addressed in this chapter.
Different scenarios for operational staffing are studied. Although inspired by staffing for product releases, the scenarios are applicable more broadly. Starting with a baseline staffing plan, five scenarios for proactive and reactive staffing are studied in this chapter. Proactive staffing tries to go through different scenarios up-front to better understand their possible impact and to come up with actions for risk mitigation. Re-active staffing refers to the need to change things in the course of ongoing development. More specifically, the scenarios are devoted to the following topics:
Scenario 1: Study the impact of modified productivity of developers
Scenario 2: Study the impact of periods of absence of developers
Scenario 3: Study the impact of revised effort estimates
Scenario 4: Study the impact of adding a new feature
Scenario 5: Decision support for finding the best new hire for joining a given pool of developers.
The baseline for all these scenarios is explained in Section 12.2. Main solution steps, their results and their applicability are described for all five scenarios in Sections 12.3 to 12.7.
12.2 Baseline
12.2.1 The baseline scenario data
Most of the project information related to the Telco case study project has already been given in previous chapters. As described in the product roadmapping case study of Chapter 11, five optimized strategic plans were created. The structure of the five plans was given in Section 11.6. In consideration of all the implicit concerns, alternative x3 was considered to be the most attractive one among the five plans generated. Consequently, it is taken as the starting point for staffing.
The goal of this case study is to go through the process of implementing all the tasks related to the features assigned to R14 of the final release planning alternative x3 from Chapter 11. These are the tasks related to the features f(1), f(3), f(9), f(10), f(11), f(12), f(18) and f(19). The four types of tasks relevant for the features are called design, hardware development, software development and testing.
There are eight tasks-related dependencies per feature:
The design task of a feature should never start later than the two development tasks.
The hardware development and software development should not start later than testing.
The design task of a feature should never end later than the two development tasks.
The hardware development and software development should not end later than testing.
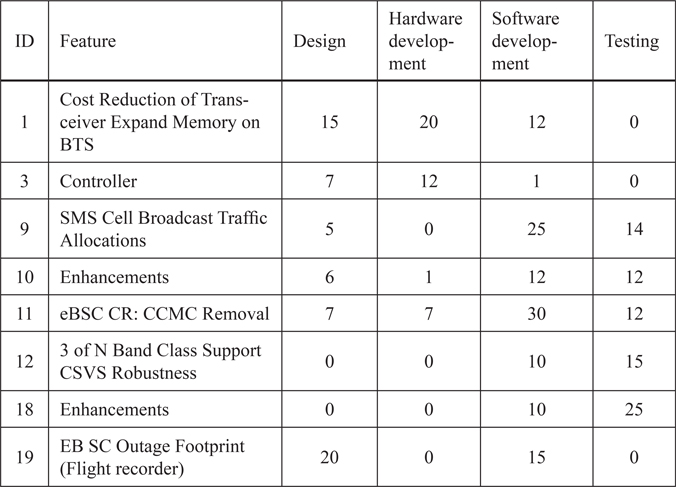
The features and their estimated effort (measured in person days) for the different resource types are given in Table 12.1. What can be seen is that not all features require the performance of all the four tasks. For example, f(1) does not require testing and f(9) has no hardware development. Similarly, features f(12) and f(18) only require software development and testing.
Table 12.1 Features and their effort consumptions considered for staffing
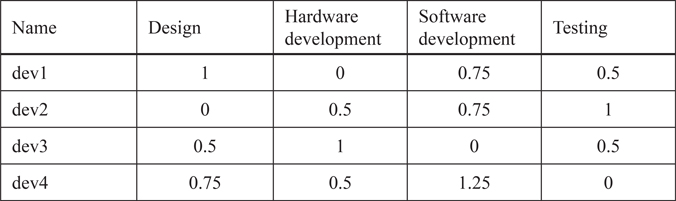
For implementation of the tasks, a pool of four developers is available. The productivity profile of the developers is shown in Table 12.2. Initially, the developers are assumed to be available without any interruptions (periods of absence).
Estimation of productivity of developers is a difficult ask. It can be based upon former work experience. One method determining the relative productivity levels would be the application of pair-wise comparison between developers as done by the Analytic Hierarchy Process AHP described in Section 3.6.
As introduced in previous chapters, average productivity is expressed by a factor equal to 1. Productivity above average is described by a factor > 1. Correspondingly, productivity below average is described by a factor < 1. Overall productivity is defined on a ratio scale, that is, the ratio prod(1)/prod(2) of two measures prod(1) and prod(2) describes how much (in %) more (> 1) or less (< 1) productive prod(1) is compared to prod(2).
Table 12.2 Productivity profile of the four available developers
12.2.2 Baseline scenario plans — manual versus optimized
The staffing problem for make-span minimization is to find an assignment of developers to tasks such that the overall duration for completing all tasks is minimized. For any feasible plan, all precedence relationships between tasks need to be fulfilled. Initially, the application of the manual planning procedure is simulated. Jane has used a spreadsheet to calculate and maintain all the data. For any task of consideration, Jane is always trying to assign the developer being most productive in this type of task. Features are ordered decreasingly according to their perceived value. The ones with the highest value are implemented first. Following this process, Jane provides a manual staffing plan, which takes 96 days. In total, this process has taken her about five hours of time.
What is shown next is the result of the application of the intelligent planning tool RASORP for the same problem. In general, the results generated from RASORP can be exported in such a way that they allow subsequent representation in Microsoft Project®. The Gantt chart displayed is using the project management tool Microsoft Project®. As a result of running RASORP for the baseline planning scenario, the plan shown in the Gantt chart in Figure 12.1 is generated. As opposed to manual generation of plans, the optimized plan can be generated in a few seconds. This advantage becomes more significant the more scenarios for re-planning are conducted.
What can be seen is that implementation of the feature f(1) called cost reduction of transceiver starts March 12, 2010 with work on the design task. This job is assigned to developer dev(1). The task ends April 1, and the whole feature is implemented until April 13, which is determined by the hardware development. The assignment of dev(1) to the design task looks reasonable, as this is the developer most capable in design. The same is true for assignment of dev(3) and dev(4) to hardware and software development, respectively.
From looking at the tasks associated with the same feature, all the precedence relationships formulated above are fulfilled. For example, for cost reduction of transceiver, design starts before the two development tasks, and is also finished not later than the development tasks. The design effort for the same feature is 15 person days. As the assigned developer dev(1) has an average productivity, the duration of the whole task is 15 working days. The whole project requires 82 working days.
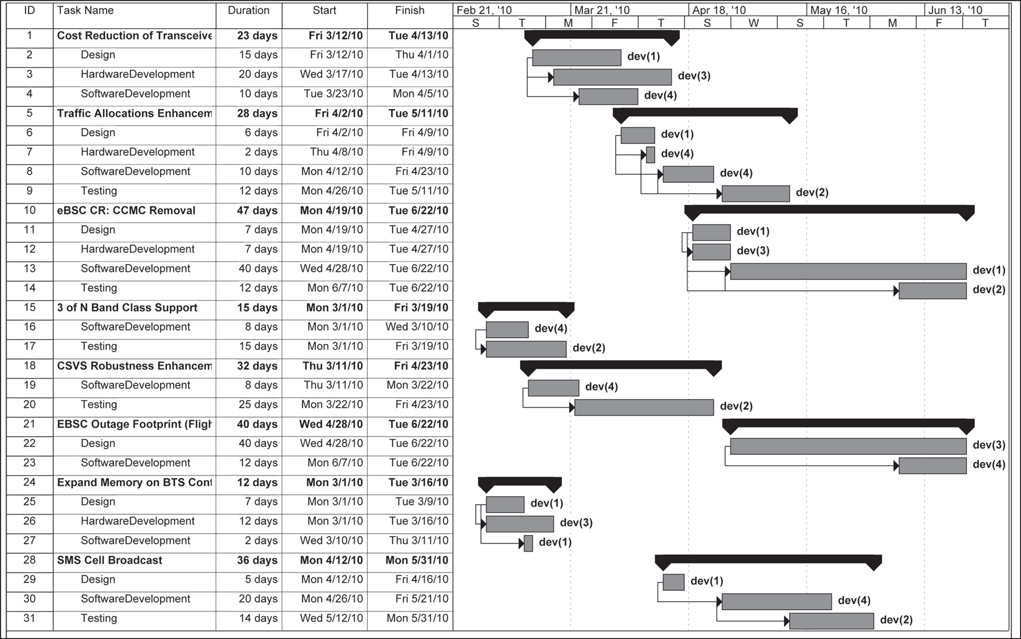
Figure 12.1 Optimized baseline staffing plan
The project is expected to be finished on June 22, 2010. That means that the make-span has been reduced from 96 (manual plan) to 82 (optimized plan) days. For better comparison, the results of the manual and optimized plan are shown in Figure 12.2. The first number in each segment refers to the feature number, the second one to the task number. A comparison between the two plans reveals that the optimized one creates less idle time for developers. This has been achieved by assigning tasks to developers other than the top one (in terms of productivity). As a result, the total amount of idle times is reduced. Idle times for dev(1), dev(2), dev(3) and dev(4) according to the manual plan are 6, 31, 29 and 23 days, respectively. These periods are substantially reduced by the optimization, resulting in 0, 4, 3 and 12 days of idle time, respectively. While reducing idle time is not the primary goal, it is a good indicator of the quality of the plan, especially if developers are assigned mainly to tasks in which they are most productive.
12.3 The Impact Of Improved Productivity
Staffing is an ongoing effort. Computer-based tools such as RASORP can be used to explore scenarios proactively as well as to re-plan a once established staffing agenda. The first scenario is devoted to better understanding of the impact of having improved productivity of the developers. This is motivated by the question whether investment into training of personnel or hiring of new personnel pays off. It is assumed that the productivity in testing of dev(1) has been improved from 0.5 to 1.0. Similarly, productivity of dev(2) in terms of software development has increased from formerly 0.75 to now 1.0. Both increases can be the result of training or hiring better skilled developers.
How do these two improvements impact the staffing plan created in the baseline scenario? The Gantt chart resulting from this planning scenario is shown in Figure 12.3. Looking at the developers dev(1) and dev(2), it becomes clear that their assignments to tasks have changed. In the baseline plan, dev(2) was exclusively working on tasks devoted to testing. With the increased productivity in software development, the optimized plan assigns this developer to five tasks, where three of them are devoted to testing and two to software development. This increased flexibility in properly assigning the developer to different tasks contributes to better results for the overall make-span of the schedule. The same arguments apply for developer dev(1).
As a consequence of the more flexible usage of developers dev(1) and dev(2), the remaining two developers are assigned differently as well. The total duration of implementing all tasks has been reduced from 82 to 74 working (or 12 calendar) days. The project is predicted to be finished on June 10, 2010.
The scenario gives some principal insight into the impact of changed (improved) performance of developers. More detailed models could look into the performance in dependence of different tasks and into the effect of learning within the same project.
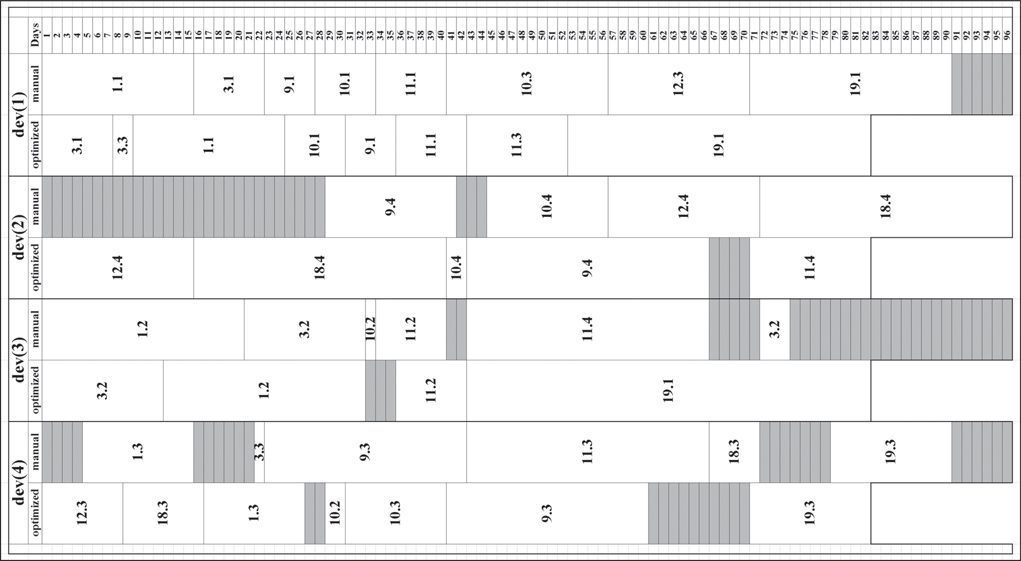
Figure 12.2 Comparison of manual versus optimized baseline staffing plan. Grey boxes refer to idle times
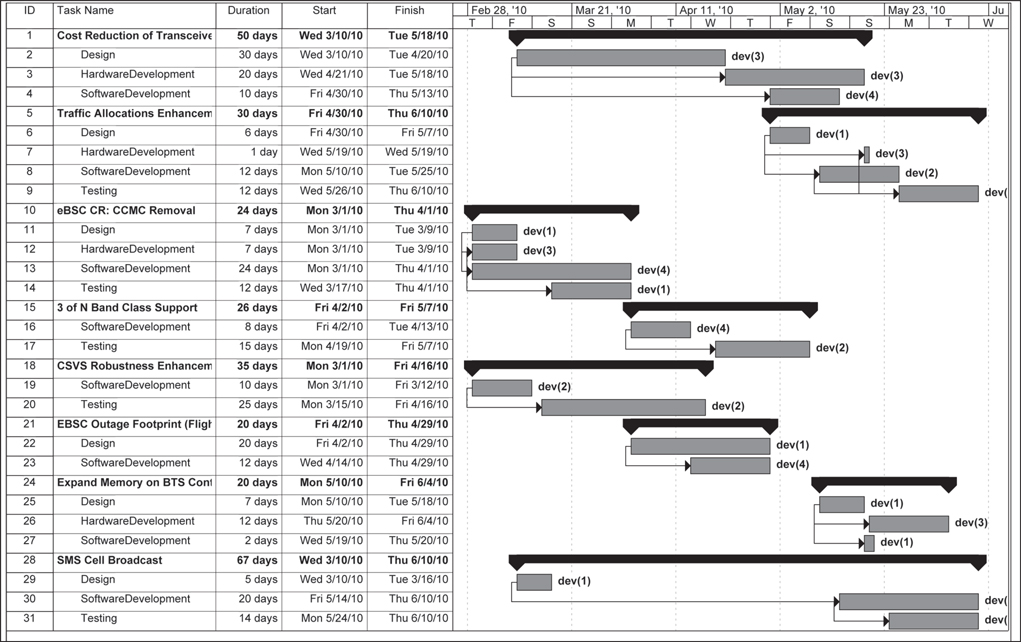
Figure 12.3 Staffing plan for increased productivity of dev(1) and dev(2)
12.4 The Impact Of Predicted And Unpredicted Absence Of Developers
As the second scenario, the impact of periods of absence is studied. Again, the baseline staffing plan serves as a reference point. Another assumption is that no additional developer would be available at this point in time for replacement. For the scenario studied here, dev(1) is assumed to be absent during time interval [40,60]. Similarly, dev(4) is away during [17,40]. These absences will certainly delay the whole plan, especially with considering the dependencies between tasks. For this case study the computation shows the plan will be delayed by 30 days and finished in 112 days, if the project manager sticks to the baseline plan.
Assume the project manager knows about these absence periods in advance. This is called predicted absence. Correspondingly, if the absence occurs unpredicted, this is called unpredicted absence. It will be shown in this section that (i) RASORP can be very helpful in reducing the effort for accommodating both types of changes, and (ii) provides clearly better options as manual re-staffing. The two arguments are illustrated for the two periods of absence introduced above.
Figure 12.4 shows the Gantt chart of the plan generated from RASORP (in conjunction with MS Project®) for the case of predicted absence. Compared to the baseline plan, the assignment and timing of the tasks have been changed dramatically. For example, designing feature f(1) is done by dev(1) in the baseline plan while it’s done by dev(3) in the revised plan. Similarly software development of feature f(19), which was supposed to be done by dev(4) at t = 71 in the baseline plan, is now be done by dev(2) at t = 26. Overall, the staffing optimization tool has been able to accommodate predicted changes in the availability of the developers.
The case of making the same periods of absence for developers dev(1) and dev(4) being unpredicted is now assumed to be treated manually, applying the same idea of greedy planning as demonstrated in Section 12.2 for the baseline plan. As a result, project duration of 131 days is obtained. Although there some changes in the assignments, e.g., testing of feature f(11), which is done by dev(1) in the new plan vs. dev(2) in the baseline plan, these changes still cannot mitigate the absence of developers in the same way as the optimization method does.
The above scenario is intended to be illustrative. The expectation is that the impact of optimized staffing and re-staffing becomes the more severe, the larger and the more complex the problem. Size here is measured by the number of tasks, the number of features and the number of developers. Complexity refers to constraints between tasks and the number of periods of absence. The more difficult case of unpredicted absence in reality has the additional difficulty of being eventually unknown in its duration.
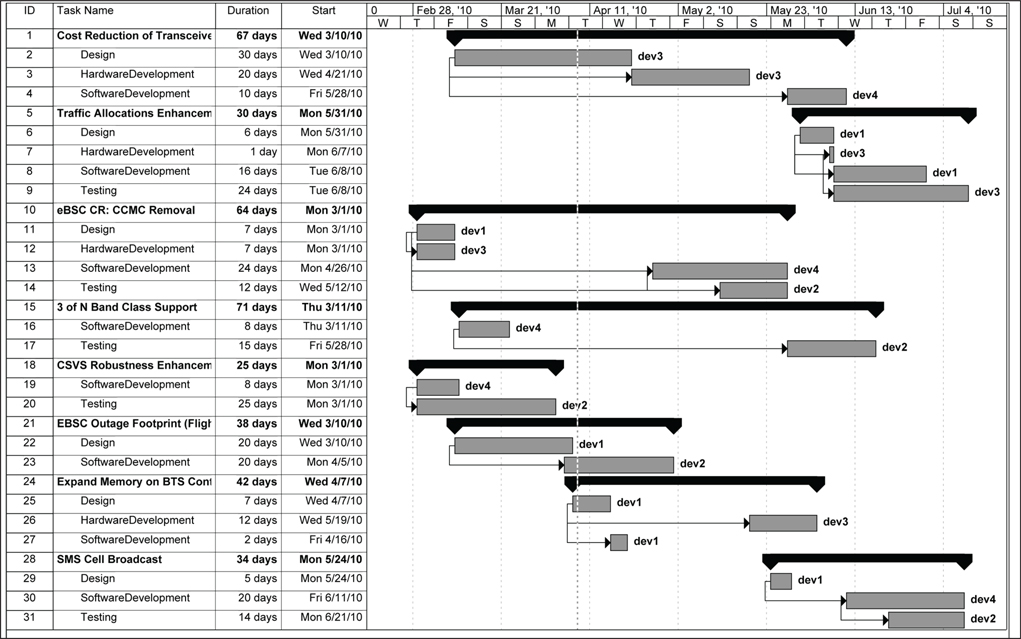
Figure 12.4 Gantt chart for the scenario of unpredicted absence
12.5 The Impact Of Unpredicted Change Of Effort Estimates
The third scenario investigates the impact of encountering higher than estimated actual efforts for some tasks. Uncertainty in effort estimation among others results from the lack of knowledge about the tasks to be done. This is especially true at an early stage of the development (e.g., during design). Consequently, it is quite common that effort estimates need to be adjusted in the course of the project.
At point in time t = 40, a re-estimation of the former effort estimates has been made (called unpredicted change). The following adjustments of the original effort estimates have been made:
Feature f(9): Effort for software development needs to be increased from originally 25 to now 37 person days
Feature f(11): Effort for software development needs to be increased from originally 30 to now 45 person days
Feature f(12): Effort for testing needs to be increased from originally 15 to now 22 person days
Feature f(18): Effort for testing needs to be increased from originally 25 to now 37 person days
The question becomes how strong the impact of these modified efforts on the overall project duration will be. From Figure 12.5 it can be seen that the overall project duration has substantially increased. The project now takes until July 20, 2010, which corresponds to an overall duration of 102 (working) days. This is a delay of 20 days. What can be seen from that is that it is very important to re-plan and re-staff immediately when changes become transparent.
12.6 The Impact Of Adding New Features During Development
Another possible scenario refers to the situation that in the course of implementation of all tasks related to the agreed upon features, one of the key customers strongly requests an additional feature. Different from the re-planning process described in Chapter 7 (where release time and resource capacities remained unchanged), the question becomes, how much would this additional feature delay the established schedule?
For our case study project, it is assumed that the additional feature is f(20) with the following (estimated) effort consumptions:
Design: 10 person days
Software development: 30 person days
Testing: 20 person days
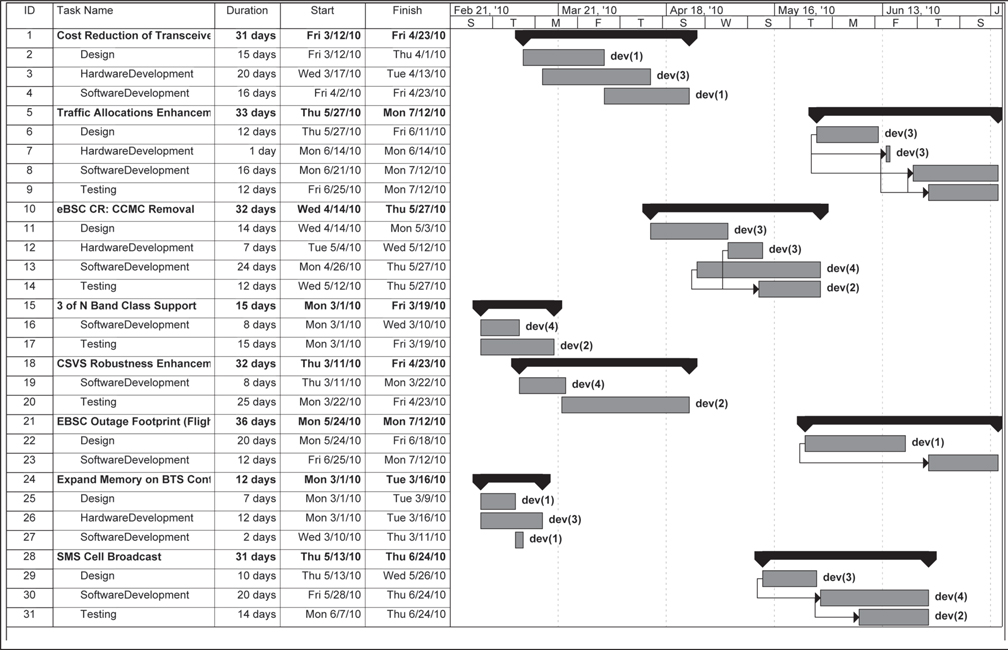
Figure 12.5 Gantt chart for the scenario dynamic increase of effort
The feature request arrives at t = 40. At this point in time, some features have already been developed or are in progress of development. That means for the optimized re-planning, all assignments and scheduling made until this point in time need to be fixed in the same way for the re-planning. As a result of running the staffing and scheduling optimization including the additional feature, the overall schedule would be delayed by 18 (working) days, which is more than three calendar weeks. The project and product manager need to decide if this is acceptable and they need to inform all the involved customers and stakeholders about the delay.
12.7 Decision Support For Hiring
Decision support for the selection and the subsequent job assignment process is rare. Existing approaches are mainly based on standard database queries that do not appropriately tackle the complexity of the task. The reason for this is that they focus solely on the fitness of the person with the job, neglecting the fitness of the person with the team — which is important as well [West and Allen ‘97].
The final scenario considers the case that for reducing the duration of the project, the company considers hiring a new developer to joint the team. There are four possible candidates who have been taken into consideration. All of them can be assigned to three of the four types of tasks in consideration. Their related productivity profile is summarized in Table 12.3.
Table 12.3 Productivity profile of the four hiring candidates
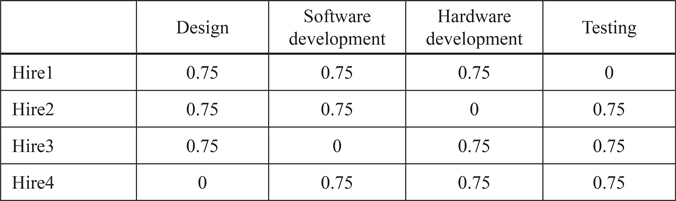
In a simplified manner, all of the four candidates are similar in the sense that their sum of all their productivity assessments is the same. However, from looking at the specific team profile and the needs of the project, there are substantial differences in how much the different candidates would help to reduce the project duration. The assumption here is that all candidates would equally well and quickly integrate into the team to achieve their estimated productivity from the very beginning. Differences in salary are left out from consideration here for simplicity reasons.
Application of RASORP allows proactive evaluation of the impact of hiring one of the four developers. The primary decision criterion is the amount of reduction achieved from hiring this person. From running all four scenarios, the results are:
When deciding for hire 1, the projected new project duration is 69 days
When deciding for hire 2, the projected new project duration is 70 days
When deciding for hire 3, the projected new project duration is 64 days
When deciding for hire 4, the projected new project duration is 68 days According to this information, the (likely) decision would be in favor of hire 3.
This developer would not contribute to software development, but in this capability the team is already strongest (measured, in a simplified manner, by the column sums in Table 12.2). Consequently, this developer could potentially contribute to all the remaining competencies and this has been confirmed having the strongest impact on overall project duration. Although a simplified model, it gives at least some guidance on whom to select among the four candidates. For the final human decision-making, this is considered to be one out of several relevant inputs.
12.8 Discussion
The five scenarios give insight into the possibilities to proactively or reactively adjust to changed project situations. This was respectively called predicted and unpredicted change. The analysis was done from the perspective of staffing for shortest overall project duration (or minimizing make-span). Running the scenarios using a computer-based support system such as RASORP is effective and efficient. It allows easy change of the data and re-running scenarios with changed parameters.
The underlying model is a simplification of reality. Productivity of developers is difficult to estimate. It might change in the course of the project and might vary from feature to feature. There are also additional effects such as getting some benefit from assigning the same developer to more than one task of the same project. These are additional constraints and considerations which are left out initially to keep the model tractable.
Decision support for project staffing is still in its infancy. First attempts have been made to make decisions based upon more solid grounds [Smith et al. ‘04], [Malinowski et al. ‘08]. The results obtained from such decision support are meant to guide, not to prescribe a solution (or decision) to the product or project manager.
The possibility of exporting plans into Microsoft Project® allows usage of this standard software for all the monitoring and tracking objectives it is designed for. Even though certain aspects of the whole process cannot be formalized and are intentionally left out, the optimized staffing plans are likely be very good in terms of the formalized planning criteria. In the same way, they are likely to be superior to any manual plans created, especially if the number of tasks and features becomes larger. This was initially shown for the case of creating the manual plan and for creating a plan for unpredicted re-estimation of resource consumptions. In all scenarios, another benefit comes from early understanding of critical project parameters and the possibility to initiate mitigating actions.