
Chapter 8
Staffing for Product Releases
8.1 Introduction
Product release plans provide the “big picture” for the evolution of a product. In order to actually implement the plan, a more fine-grained planning is needed to assign human resources to perform the individual tasks behind the selected features. Staffing for product releases relates to the question of how to organize this process. Software-based products often require very different technical and non-technical competencies ranging from communication, customization and learning to the application of the different techniques, methods and tools.
For a dynamically changing pool of human resources, the decisions to be continuously made are related to questions such as: Who is assigned to which task and why? How do we react in the case of a lack of developers? How do we react to changes in the requested effort? What are the types of human resources most critical for success? When is a good time to provide training?
The quality of these decisions strongly impacts the outcome of the project in terms of its quality and delivery date. Project managers often spend a substantial portion of their time to figure out the best assignment of people to tasks. Decision support methods described in this chapter are an important means to achieve higher effectiveness as well as better efficiency in this process.
The discipline of project management is concerned with planning, organizing, leading, staffing and controlling of projects [Wysocki ‘06]. As Fred Brooks stated in 1987, today’s major problems with software development are not technical problems, but management problems [Brooks ‘87]. Although stated 23 years ago, things have not changed dramatically since then. [Charette ‘05] has analyzed factors why software projects fail so often. Among the 12 factors mentioned, half of them are closely related to project management:
Unrealistic or un-articulated project goals
Inaccurate estimates of needed resources
Poor reporting of the project’s status
Un-managed risks
Inability to handle the project’s complexity
Poor project management
Staffing is one of the five key major project management functions and thus belongs to the category of issues causing “major problems”. Staffing takes into account the different competence levels of developers. It is well-known that there are major differences in the competencies and productivity of software developers. [Sackman et al. ‘68] studied professional programmers with an average of seven years experience and found that the ratio of initial coding time between the best and worst programmers was about 20 to 1. The general finding that there is one order-of-magnitude difference among programmers has been confirmed by other studies such as [Valett and McGarry ‘89], [DeMarco and Lister ‘99], and [Constantine ‘01]. Acknowledging that all developers have certain strengths in their competence profile, the question becomes identifying those people who are best suited for the different development roles. Despite its importance, currently there exists only little support for this staffing task [Acuna et al. ‘06].
Project management includes management of human and other resources. Human resources are often the most expensive ones. Their proper usage is of key relevance for project success. The Standish Group’s report about Solutions for Enterprise Project and Portfolio Management (PPM) analyzed 307 surveys and 30 interviews focused on the value of features and functions of PPM solutions [Standish ‘09]. One of the findings was that 59% of respondents thought that project-level resource allocation could have a major effect on the success of their projects and 64% thought it to have high monetary value (ROI).
Assigning most competent developers to appropriate tasks is a complex process. If this process is executed in an ad hoc manner, and solely based on intuition, then the likely results will be poor resource utilization and schedule overrun. Automated and computer-based support has been suggested as an essential component for improving efficiency and effectiveness of planning [Kapur et al. ‘08].
While staffing is a topic of general interest, it is studied in this chapter in the specific context of implementation of a product release. Release planning and staffing depend on each other: Each plan needs to be staffed, and staffing only makes sense in conjunction with a defined set of selected features. Staffing needs to take into account the different features, their dependencies, the tasks necessary to provide the features, the human resources available to realize the tasks, the dependencies between the tasks, and existing due dates for the release and the tasks.
In this chapter, three specific questions related to assigning human resources to tasks are investigated in more detail. Section 8.2 provides the common background and related work. The method for staffing to achieve maximum release value is described in Section 8.3. Staffing for minimal project duration, that is, the second staffing problem formulation, is investigated in Section 8.4. The third variant of staffing is called competence-oriented staffing and is studied in Section 8.5. It is aimed at the best assignment of developers to tasks based on requested and available competence profile. Finally, this chapter ends with an industrial case study described in Section 8.6.
A related tool for doing optimized staffing called RASORP is described in Section 10.4. Chapter 12 is devoted to a more detailed and illustrative case study for staffing. It is based upon the Telco case study project used throughout this book. It is devoted to performing and discussing a number of staffing scenarios.
8.2 Background and Related Work
8.2.1 Key components of the staffing problem
The staffing problem means to assign the right people to the tasks to be performed. It also means to determine the right timing and sequence of task performance. The general structure of the staffing problem is summarized in Figure 8.1. The main artifacts and main operations in the staffing process are shown. Following a top-down approach, the conceptual model description starts with the formulation of the planning objectives. Dependencies can be considered both at the feature and at the task level. A pool of developers is available to assign them to sequence of tasks. Developers have a profile of competencies and related productivities for performing tasks. The general model encompasses periods of absence of the developers as well. It is assumed that each task is done by exactly one developer. This simplification makes the problem tractable. More complex assignment scenarios can be treated by refinements of either the tasks or the resources.
For the staffing problem, each feature is considered the result of performing a sequence of feature-related tasks. All of them have an estimated effort and a requested profile of competencies for performing them. Once all the tasks of a feature are implemented by the assigned developer, the features can contribute to the creation of release value. All objectives and constraints of the staffing problem are formulated in terms of features and their related tasks in conjunction with the human resources available. The solution method to the staffing problem considers the characteristics of the individual tasks and makes suggestions about the allocation of developers to tasks and the order in which tasks should be performed. Among the tasks related to the same feature, there might be different types of dependencies (see Section 8.2.3 for their categorization).

Figure 8.1 Conceptual model of the staffing problem formulation
Before providing the three variants of staffing as instances of the formulation given in Figure 8.1, an illustrative example adapted from [Kapur et al. ‘08] is studied in the following Subsection 8.2.2.
8.2.2 Staffing: An illustrative example
A project for implementation of six candidate features is studied. The resulting product is offered incrementally in two releases. The first one is due after four weeks and the second one after eight weeks. Implementation of a feature requires performing three tasks called design, coding and test. Each feature can only be offered if all the three related tasks are performed. There are dependencies between the starting dates of tasks of the same feature which need to be fulfilled: (i) Coding should not start before design starts. Similarly, (ii) testing should not start before coding starts. There are similar dependencies between the end dates: (iii) Coding should not finish before design is finished, and (iv) testing should not finish before coding is done.
Besides dependencies between tasks, there are dependencies between features as well (see Chapter 5 for further details on that). Features Data import and Data export only make sense in combination with each other. If chosen, these two features must appear in the same release. Furthermore, Notification cannot be released without User administration already being implemented.
Each feature, once made available in the market, will realize a certain value. It is assumed that this value depends on when it is released. The features f(n) (n = 1...6) and their estimated relative values called value(n,k) for the case of being offered in release k = 1 and k = 2 are given in Table 8.1. The values are expressed based upon a nine-point scale with 1 and 9 indicating very low respectively very high feature value. In addition, Table 8.1 contains the estimated effort (in person days) for each of the three tasks per feature. According to that, feature Reporting would create a value of 6 if delivered in the first release, and a value of 1 is expected if delivered in release 2. The same feature has an estimated effort of four person days for design, three person days for coding, and two person days for testing.
The project team consists of three developers (Anna, Dave and Ken). From analysis of their former work experience, the developers have different productivity levels for each of the tasks of design, coding and testing. The productivity evaluations are estimates and based on the performance in past projects. Average productivity is normalized to 1. A productivity value of 2 of a developer means that this developer can perform a given task twice as fast as a developer with average productivity. In Table 8.2, Anna is judged as performing about average for design, 50% above average in coding, and 100% above average developers in testing. While these assumptions are applied for all features of the same project, they might vary across varying projects.
The staffing plan also needs to look at certain periods of absence (due to training, vacation or other planned periods of absence). During the deployment of the project, Anna is not available to work during days 6 and 7. All the other developers have no predicted period of absence.
Table 8.1 Feature related data for illustrative sample project

The developer-related data are summarized in Table 8.2. The general assumption is that one task can only be assigned to one developer all the time. Another assumption is that one developer can only work on one task at a time.
Table 8.2 Productivity and time windows of unavailability

Due to the limitations in the availability of developers, it might not be possible to deliver all features within the predefined period of time. The features that cannot be implemented are postponed. The objective of the planning process is creating a staffing plan that gives the maximum total value for the two product releases. This goal can be broken down into two parts:
Assignment of features to releases in a manner that achieves maximal value for the product (release planning).
Assignment of tasks to developers to realize the strategic release plan (staffing).
The value of a product release is additive in terms of the value of the features of that release. An example of a release and staffing plan is shown in Table 8.3. Each line of the Gantt chart represents a task of a feature. The bar shows the developer responsible for that task as well as the time allocated to it. According to this initial plan, Reporting is delivered in release 1 (after four days) as all the three tasks have been finished after four days. Similarly, Billing is offered in release 2 (after eight days). All other features f(3), f(4), f(5) and f(6) are postponed.
Developer Dave is coding all the time. However, the other two developers would have been the better choice for that as they are expected to be more productive. Ken starts with design work in the third day. However, this is the job he at which is least productive.
Table 8.3 Gantt chart of initial plan x1
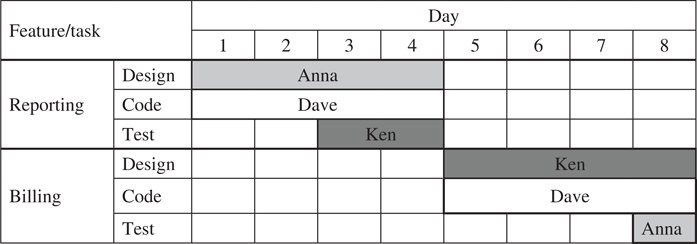
The value of this plan called x1 is composed by adding the value of the two proposed features, that is, value(x1) = v(1,1) + v(2,2) = 6 + 3 = 9. However, this plan is poorly designed because many of the tasks are done by developers who are not the most qualified to perform the job. For example, Ken is not doing any coding, although e is most qualified for that.
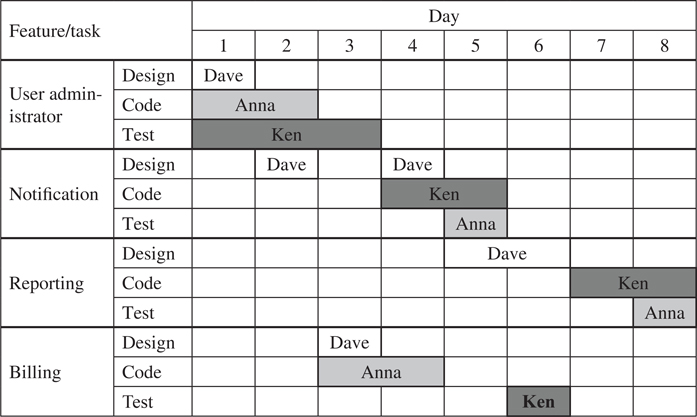
A better solution is shown in Table 8.4. In this plan, the assignment of developers is significantly improved. There is less idle time for the developers. Tasks are assigned to more productive developers. According to this plan, User administration is provided in release 1, and features Reporting, Billing and Notification are offered in release 2. The two remaining features Data import and Data export are postponed. The overall value of this plan called x2 increases to value(x2) = 19 compared to the value(x1) = 9 of the former plan x1. Looking at the plan in Table 8.4, it can be seen that the design task for the notification feature is interrupted after the end of day two. This allows Dave to start with the design for Billing, which allows starting with the coding for the same feature. It although becomes transparent that Anna’s period of absence has been taken into account. For a final plan offered, all the originally defined dependencies are satisfied:
Coding should not start before design starts
Testing should not start before coding starts
Coding is not finished before design
Testing is not finished before coding
Table 8.4 Table of improved staffing plan x2
While the plan shown in Table 8.4 represents a much improved alternative to deliver features creating maximum total value, another scenario could be looked at as well. This scenario refers to the delivery of all the six pre-selected features with the objective to achieve this within minimum duration. In this scenario, the value of the features is no longer taken into account. The assumption is that this was done already in the selection of the features. For the set of features listed in Table 8.1, the overall duration to implement all features is 13 days. That means that in comparison to plan x2, the two additional features have caused five more days of implementation. The corresponding Gantt chart is shown in Table 8.5.
Comparing the staffing plans shown in Tables 8.4 and 8.5, some assignments of developers to tasks have changed. The coding for the Billing feature is no longer done by Anna, but has been assigned to Ken, who in that case is the better choice in terms of productivity. What the optimization delivers is the global perspective on the assignments. This implies that even non-optimal individual assignments are acceptable as long as they contribute to the global goal of minimization of the total project duration.
Table 8.5 Gantt chart of a schedule minimizing overall make-span

8.2.3 Description of dependencies between tasks
In the illustrative example given in Subsection 8.2.2, there was a request for begin-begin as well as for end-end precedence relationship between tasks. In reality, an even more fine-grained overlap of tasks might be requested. For example, modeling the dependency between start of design and start of coding can be considered in dependence of the duration of the design task. This would avoid that design and coding are done completely concurrently. Instead, a certain progress of initial design work is supposed to be done before entering the coding stage.
In the following, different types of dependencies are described. For that purpose, the following notation defined for the q-th task task(n,q) of feature f(n) is used:
(8.1) Begin_task(n,q): Begin time for task(n,q) of to feature f(n)
(8.2) End_task(n,q): End time for task(n,q) of to feature f(n)
(8.3) Duration_task(n,q): Duration of task(n,q) of to feature f(n)
In total, 12 types of dependencies between tasks related to the same feature are considered. The types differ by the way the dependencies are expressed. The first four types (8.4) to (8.7) correspond to the four possible combinations of start and end dates of a pair of two tasks in consideration. For the other types of dependencies, there is an additional impact of the duration of the reference task. What that means is that for these more complex types of dependencies, a certain degree of the duration of a task needs to be executed before the other task could be started.
For two sample tasks task(n,q1) and task(n,q2), coefficients a are used in (8.8) to (8.15) expressing the portion of a task which needs to be executed before the dependent follow-up task can be started. In addition to that, some fixed time period β needs to be waited. To keep notation simple, the dependency of a and β from n and q is left out. Using these coefficients, the dependencies can be stated as follows:
(8.4) Begin_task(n,q1) ≤ Begin_task(n,q2)
(8.5) Begin_task(n,q1) ≤ End_task(n,q2)
(8.6) End_task(n,q1) ≤ End_task(n,q2)
(8.7) End_task(n,q1) ≤ Begin_task(n,q2)
(8.8) Begin_task(n,q1) + α1 Duration_task(n,q1) + β1 ≤ Begin_task(n,q2)
(8.9) Begin_task(n,q1) + α2 Duration_task(n,q1) + β2 ≥ Begin_task(n,q2)
(8.10) Begin_task(n,q1) + α3 Duration_task(n,q1) + β3 ≤ End_task(n,q2)
(8.11) Begin_task(n,q1) + α4 Duration_task(n,q1) + β4 ≥ End_task(n,q2)
(8.12) End_task(n,q1) + α5 Duration_task(n,q1) + β5 ≤ End_task(n,q2)
(8.13) End _task(n,q1) + α6 Duration_task(n,q1) + β6 ≥ End_task(n,q2)
(8.14) End_task(n,q1) + α7 Duration_task(n,q1) + β7 ≤ Begin_task(n,q2)
(8.15) End _task(n,q1) + α8 Duration_task(n,q1) + β8 ≥ Begin_task(n,q2)
Dependency types (8.4) to (8.9) are illustrated in Figure 8.2. For any two tasks of the same feature, end-end, begin-begin, begin-end, as well as end-begin relationships are visualized. Moreover, the degree of execution of a task is taken into account for the generalized begin-begin and the generalized begin-end dependency. This means that task(n,q2) can only be started after task(n,q1) is done to a certain degree (say 70%, i.e., αl = 0.7) and some additional time β1 has been passed.

Figure 8.2 Illustration of dependencies (8.4) to (8.9) between tasks
Similarly, the bottom right figure describes a situation that task(n,q2) should not start later than some point in time given by the portion execution a2% of task(n,q1) plus some additional period β2. The remaining dependency types can be treated analogously.
8.2.4 Three variants of the staffing problem
In this chapter, three variants of the staffing problem are formulated. Each of them is studied in further detail in subsequent Sections 8.3, 8.4, and 8.5.
Staffing problem 1: Staffing for maximum total release value
Release due dates are fixed. For a given set of features requested for implementation, the objective is to find a subset of features that results in maximum total feature value. This is achieved by the best staffing plan. Objects of investigation are features with their related tasks and developers with their individual productivity profiles. All staffing plans are in conformance to the stated availability constraints of developers.
Staffing problem 2: Staffing for minimum make-span
For a given set of features requested for implementation, the objective is to implement all the proposed features in minimum overall project duration. This is also called make-span minimization. Objects of investigation are features with their related tasks and developers with their productivity profile. Given release due dates can be exceeded. All staffing plans are in conformance to the stated availability constraints of developers. Staffing problem 3: Staffing for maximum competence match For a given set of tasks to be performed, the objective of the third staffing problem is to find the best assignment of developers to tasks. Each task has a specified requested profile of competencies. Each task is executed by exactly one developer. Each developer has a specific competence profile which reflects former work experience. The staffing problem is to assign developers to tasks such that there is a best possible total match between requested and offered (by the assigned developers) competencies. This is independent of any consideration of features.
8.2.5 Related work
The different variants of staffing are closely related to scheduling and resource allocation problems. There is a large body of knowledge in project scheduling [Blazewicz et al. ‘07] and project management [Wysocki ‘06]. Project scheduling as part of project management was studied, for example, in [Alba and Francisco Chicano ‘07]. In order to decide (i) which resources are used to perform which tasks and (ii) when each task should be performed, the authors suggested applying genetic algorithms (GAs). The application of GAs for project management was initiated by [Chang et al. ‘01]. The proposed method focused on schedule minimization and did not examine different productivity levels of developers.
Staffing of software projects has been studied with other methods as well. As an earlier effort, [Abdel-Hamid ‘89] investigated staffing of software projects based on a comprehensive system dynamics model of the software development process. Bayesian belief networks were used by [Fenton et al. ‘04] as a means to circumvent the inherent uncertainty in estimating effort for resource decisions. Their causal model (using a Bayesian network) incorporates empirical data. The authors showed how this model can be used in a practical decision-support tool, allowing a project manager to trade-off the resources used against the outputs (delivered functionality, quality achieved) in a software project.
Different search-based techniques (genetic algorithms, hill climbing and simulated annealing) were used for planning resource allocation in large massive maintenance projects [Antoniol et al. ‘05]. The approach was validated by an empirical study of a large, commercial Y2K massive maintenance project, which compared these techniques with each other. According to the authors, the best search technique reduces the project duration by as much as 50% compared to the application of baseline random search.
Staffing of software projects was modeled and solved as a constraint satisfaction problem in [Barreto et al. ‘08]. Their approach takes into account the characteristics of the project activities and their demand on individual competencies. Different types of utility functions are examined. However, the scalability of the method to mid-or even large-scale real-world staffing problems was not addressed. In summary, existing methods and techniques either were not applicable to the general staffing formulation presented in this chapter, or their applicability was just shown for small scale examples without demonstrating their scalability.
8.3 Staffing for Maximum Total Release Value
8.3.1 Problem description
Staffing problem 1 aims at the maximization of the total release value for the case of fixed release dates. Staffing in general requires more detailed information than the strategic release planning problem considered in Chapters 5 and 6, where resources are taken into account just on a cumulative basis with the total amount available over the whole release period. In correspondence to the higher level of detail in data and planning, the time horizon for staffing is shorter than for the case of strategic planning. Because of the uncertainty of data and processes, it does not make sense to perform detailed staffing for a longer period of time advance.
More precisely, the following parameters and related constraints are considered as part of a more formal description of constraints given in [Ngo-The and Ruhe ‘09] and [Kapur et al. ‘08]:
Number K1 (≤ K) of releases considered for staffing.
Existence of fixed release dates rd(k) for k = 1.. .K1 for subsequent releases.
Features offered in release k need to have all their tasks completed not later than at rd(k) (k = 1...K1).
The effort of task q of feature n, that is, task(n,q), is defined as the amount of time units (e.g. person days) needed to fulfill the task q of feature n by an average developer and denoted by effort(n,q). For example, effort(1,3) = 2 means that an average developer can perform task 3 of feature f(3) in 2 time units (such as days).
Productivity of developer d with regard to task q is defined as effort of task q realized by a developer d in one time unit and is denoted by prod(d,q).
Dependencies between tasks of the same feature are of the same type. They can be any of the types as formulated in (8.1), (8.3) and (8.4).
Dependencies between features (coupling, precedence) as formulated in Chapter 5 for strategic release planning.
A pool of developers with productivity profiles for performing the different types of tasks.
Availability constraints related to developers, defined by periods of absence describing the period of time a developer is not available.
Each task is considered pre-emptive. It is executed by just one developer. Each developer is working on no more than one task at the same time.
The Boolean variable x(n,k) indicates whether feature f(n) is provided at release k (x(n,k) = 1) or not (x(n,k) = 0). In the formulation of the problem, all the individual Boolean variables are aggregated into a vector x describing the assignment of all features to releases. The value of having feature f(n) provided at release k is denoted by value(n.k).
The features can only be offered if all the related tasks are done. The tasks themselves are performed by developers. The vector u is to describe the assignment of developers to tasks. The objective of planning is to maximize the overall utility function F(x) defined in (8.16). This is an additive function expressing the total value out of assigning the different features to the possible releases. F(x) solely depends on x, while the staffing vector u is important to formulate the feasibility of release plan x. The term staffing is used here as a synonym for assigning developers to tasks. All the feasible alternatives of assigning developers to tasks and performing the tasks fulfilling all the dependency constraints is abbreviated by UX.
(8.16) Maximize { F(x) = Σ n=1...N Σ k=1...K value(n,k)·x(n,k) subject to (u,x) ∊ UX}
8.3.2 Solution method
In our approach, the staffing for maximum release plan value problem is modeled as a combination of a scheduling problem called the job shop scheduling problem and a variant of the knapsack problem. Both problems in isolation have been extensively studied and are known to be NP-complete [Garey and Johnson ‘79]. A comprehensive survey of job shop scheduling techniques can be found in [Blazewicz et al. ‘07]. For knapsack problems and all its variants, see [Kellerer et al. ‘04].
A two-phased solution method presented in [Ngo-The and Ruhe ‘09] combines the strength of special structure integer programming (Phase 1) with the power of genetic algorithms (Phase 2). In Phase 1, a simplified version of the original problem is solved. This simplification is done by ignoring some of the constraints. As a result, a solution is received which serves as a quality measure for the subsequent solution in consideration of all the remaining constraints of the problem. The plan received from Phase 1 is not necessarily feasible in terms of the dependencies between tasks. The plan, however, is taken as a starting solution for the subsequent search procedures executed in Phase 2.
The advantage of this solution method is twofold. First, an upper bound for the maximum value achievable can be generated from Phase 1. This allows a quality evaluation of the solution generated in Phase 2. The ratio between the solutions obtained in Phase 2 and the one obtained in Phase 1 give the guaranteed degree of optimality of the final plan. Second, the solution obtained from Phase 1 is utilized to restrict the search space elaborated in Phase 2. The set Π of all permutations of N features is reduced to the set Π* ⊂ Π used in the genetic algorithm of Phase 2. This reduction can significantly reduce the computational effort.
Phase 2 can be applied without application of Phase 1, but the search space would be substantially larger in this case. The restriction provided by Phase 1 is heuristic in its nature. That means it is likely that Π* (reduced search space) contains a good solution. However, there is no guarantee that it necessarily contains the optimal solution. For further details of the method, see [Ngo-The and Ruhe ‘09].
8.3.3 Empirical validation
An initial empirical validation of the solution method is reported in [Ngo-The and Ruhe ‘09]. For a series of randomly generated problems, a comparison was done between the results of unfocused search (UFS) (just performing Phase 2 of the method outlined above without running Phase 1) and focused search (FS) (running Phase 1 and subsequently Phase 2 as described above). The results of the comparison from varying the number N of features between 5 and 204 and simultaneously varying the number K of releases between 1 and 4, are shown in Figure 8.3. With the exception of very small problems, the focused search performs better. The improvement is measured by the relative improvement ratio Improve(FS, UFS) based upon the solution xFS and xUFS obtained from FS and UFS, respectively. It is defined by (8.17).
(8.17) Improve(FS, UFS) = [F(xFS) - F(xUFS)]/F(xUFS)
It is observed that the relative improvement ratio (8.17) is the more in favor of the focused search option, and thus, the bigger the problem (measured by N · K). In some cases, the relative improvement achieved by focused search becomes more than 50%.

Figure 8.3 Comparison of the results between focused and unfocused search for staffing with the objective of maximum total release value [Ngo-The and Ruhe ‘09]
8.4 Staffing For Minimum Project Duration
8.4.1 Problem description
Another important instance of the general staffing problem formulation relates to finding good plans under the premise that all features need to be processed. The best plan here is the one implementing all the features in the shortest period of time. Make-span minimization differs from the maximum release value problem by its objective: Instead of maximizing the value achievable from features for given release periods, the goal becomes to minimize the maximum finishing time among all tasks corresponding to features.
This formulation of staffing is related to the classical job shop scheduling problem (JSSP), which asks for the scheduling of n jobs job(1) ... job(n) on m identical machines. The objective is to minimize the total length of the schedule. Our problem is more general than the JSSP problem because it allows different productivity levels for the different machines (developers).
More precisely, the problem formulation is composed by the following parts:
The effort of task q of feature n is defined as the amount of time units needed to fulfill the task q of feature n by an average developer and is denoted by effort(n,q).
The productivity of developer d with regards to task q is defined as effort of task q realized by developer d in one time unit and is denoted by prod(d,q).
Dependencies between tasks of the same feature are of the same type. They can be any of the types as formulated in (8.1), (8.3) and (8.4).
A pool of developers with different levels of productivity for the different types of tasks.
Up-front known periods of absence of developers.
Each task is considered preemptive. It is executed by just one developer. Each developer is working on no more than one task at the same time.
8.4.2 Solution method
The staffing for minimum make-span does not consider releases and release values, just the maximum of the end-times of all tasks, which is aimed to be minimal. Because of its similarity to the JSSP, any method applicable to a general JSSP can be adapted to this problem. Our solution approach is a variant of the RASORP solution method described in [Ngo-The and Ruhe ‘09] with only Phase 2 being executed. For that, a special implementation of the genetic algorithm of [Hartmann ‘98] was used. A detailed case study going through various staffing and re-staffing scenarios is presented in Chapter 12.
8.5 Staffing for Maximum Competence Match
8.5.1 Problem description
The third staffing problem is directed toward perfect matching of requested and available competencies for performing a sequence of tasks. The tasks are partially ordered based upon priority. Each task has specific competence requests. The underlying assumption here is that the better the match of the competencies, the faster the tasks can be executed. For a given period of time, the objective is to find a matching that allows the maximum number of tasks being executed.
One prominent representative of this class of problems is fixing bugs as part of software development and maintenance projects. Looking at scenarios of having hundreds (if not thousands) of bugs in a repository, a proper assignment of developers to bug fixing tasks becomes a tremendous challenge. A comparison of various greedy-based solution methods and a case study conducted with open source data is available from [Rahman et al. ‘09].
A process of fixing a given set of individual tasks in a given time interval is considered with M tasks under consideration. The time interval of the project is defined as [0, T], that is, a planning horizon of T time units (e.g., days) is looked at. The question studied is: Who should perform which task and when? For that, a pool of developers DEV = {dev(1),..., dev(D)} consisting of D individuals is assumed to be available during the given time interval.
In the context of a specific organization or a specific project, there is a set of competencies that have been observed to be relevant for performing the tasks. All these competencies are summarized into a vector having R components. For example, task related competencies in consideration of a project context can be related to
Java programming (r = 1)
MySQL (r = 2)
Code review (r = 3)
Testing (r = 4)
PHP (r = 5)
For optimized assignment of developers to tasks, requested competencies of task(m) and available competencies of developer dev(d) to be assigned to execute the task are defined. The vector of requested competencies is called Request(m) and has R components. The individual components are denoted by request(m,r). Each component expresses the (estimated) portion of the total task effort devoted to the r-th competence type. Both the number and the content of these competencies are context-specific.
The requested competence levels per task(m) are formulated by numbers from interval [0,1] expressing the percentages of the respective competence levels related to the total amount of competence. The vectors Request(m) are normalized to 1:
(8.18) ∑r=1...R request(m,r) = 1 for all m = 1...M
For the example stated above, in consideration of a task(m), the corresponding vector Request(m) has R = 5 components. Request(m) = (0.50, 0, 0.20, 0.30, 0) then means that for performing task(m), 50% of the effort is expected to be on Java programming, 20% is expected to be code review and another 30% for testing. No competencies are expected for both my SQL and PHP.
In order to find optimized assignments of developers to tasks, the competence levels of the developers need to be known as well. Similar to the formulation of the staffing for maximum release value problem, the average competence of a developer dev(d) related to competence r is expressed as a ratio measure defined by (8.19) and (8.20).
(8.19) dcomp(d,r) = 1 if dev(d) has average level of competence of type r
(8.20) dcomp(d,r) > 1 (<1) if dev(d) has above (below) level of competence of type r
The individual competencies of developer dev(d) are summarized into a vector Dcomp(d). It is assumed that a developer’s competence is directly correlated with productivity. That implies that a competence level of comp(d,r) allows performing a task in 1/dcomp(d,r) units of time when compared to a developer having average competence for that task.
Each task(m) is further characterized by its (estimated) effort called effort(m). The total effort is allocated proportionally to the different required competencies given in (8.18). This means that the effort related to a competence type r is given as the product of effort(m) and request(m,r). Finally, it is assumed that each task has an assigned priority called prio(m). This priority is defined on an ordinal 5-point scale with prio(m) = 5 (= 1) being the highest (lowest) priority.
More precisely, the problem for maximum competence match is composed by the following parts:
All given tasks need to be executed.
Each task is considered preemptive. It is executed by just one developer.
Each developer is working on no more than one task at the same time.
A lower priority task cannot be executed before a higher priority task.
The duration needed to execute a task is composed by the time needed for all of its competence-related parts.
The time needed for a competence-related part requesting competency request(m,r) is indirectly proportional to the competence level dcomp(d,r) of the developer dev(d) assigned to this task.
The objective of planning is to find an assignment of developers to tasks such that the overall duration of executing all tasks is minimized.
8.5.2 Solution method
The problem formulated in Section 8.5.1 is a special case of the resource-constraint project scheduling problem known to be NP-complete. Our proposed heuristic solution method is applying greedy search [Cormen et al. ‘06]. Greedy search is based on some given order of the objects under consideration. The ordering is given by the priority of the tasks. At each step when a new task is assigned to an idle developer, the selection is done based upon the match of fitness between the requested competence profile and the competence profiles of available developers.
To overcome the limitations of making local decisions, which eventually prevents assignment of more capable developers to a task at a later stage, an additional look-ahead time for the search is introduced. That means, for a given point in time, not only idle developers at this time are considered, but also developers becoming available within the given look-ahead-time are looked at. This is called greedy-X, where X is the look-ahead time in days. Further details related to the algorithm and initial empirical results for nine milestones of the Eclipse open source project can be found in [Rahman et al. ‘09].
8.5.3 Illustrative example
The problem formulation and the proposed solution method are illustrated by an example with 10 tasks. In total, five competencies are taken into account for all these tasks. The competencies are related to Java, mySQL, review, testing and PHP. The requested competence profiles for the 10 tasks are given in Table 8.6.
Table 8.6 Competence profiles (in percentages) for the 10 tasks of the example

For example, task(1) is expected to require 45% of its effort related to Java programming, 20% to mySQL database development, 15% to testing and 20% to PHP. It becomes clear as well that not all competencies are requested for all tasks. Projecting the requested portions to the overall effort results in the effort profiles for the different tasks as presented in Figure 8.4.

Figure 8.4 Effort profile for the 10 tasks of the example (in person days)
For completing the 10 tasks, a pool of three developers is assumed to be available. Their competence profiles are summarized in Figure 8.5.

Figure 8.5 Competence profiles for the three developers available
For example, developer dev(1) has an above average productivity in testing, but only very low competencies in terms of both Reviews and PHP. Solution procedure greedy-X always tries to assign the most competent available developer to the next task in the sequence. This principle is applied from the very beginning until the end (when there are no tasks remaining). In case of no look-ahead time, if no developer is available, than it will assign the task to the developer who is available next, independent of qualification. This might create poor assignments in some cases. To overcome the limited choice of developers, the concept of look-ahead time X is introduced.
The Gantt chart in Figure 8.6 shows how different tasks are performed by different developers when staffing is done without look-ahead time. In this case, all tasks will be completed after 227 days. The long duration primarily results from the assignment of the developer being the least appropriate (dev(2)) to the most comprehensive task (task(4)).
Instead of always looking at the best developer available, greedy-15 applies a 15-day look-ahead time. As a result and shown in Figure 8.7, assignments have changed (when compared to Figure 8.6). For example, after finishing task(1), developer dev(2) is not immediately assigned to the next task being task(4). Instead, after a break of 12 days, dev(2) is assigned to task(5) and task(4) is assigned to dev(3), who is more qualified for this task. In total, these re-assignments result in a total duration of 201 days.

Figure 8.6 Gantt chart for schedule of task implementation from greedy-0

Figure 8.7 Gantt chart resulting from the application of greedy-15
Similar arguments can be made when further increasing the look-ahead time. The results of the application of greedy-30 can be seen in Figure 8.8. dev(1) is used the first time after 30 days for task(5). The total duration is now reduced to 141 days. It can be seen that task(4) now is assigned to dev(3), who is the better choice in terms of the match between requested and available competence profile.
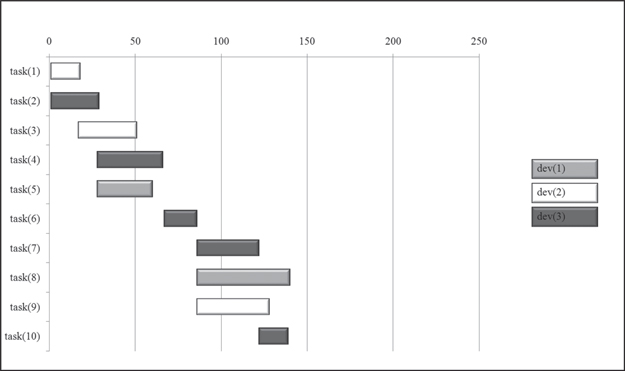
Figure 8.8 Gantt chart resulting from the application of greedy-30
8.6 Industrial Case Study
8.6.1 Context and project data
This case study reports about the experience and insights gained from applying staffing for maximum total release value (cf. Section 8.3) at Chartwell Technology [Kapur et al. ‘08]. Chartwell provides software and services to more then 60 clients who operate in multiple markets, with multiple languages and differing legal jurisdictions. As a result, customer opinions on new features and new requirements often vary widely.
The case study project looked at staffing for two releases ahead of time. The first release period was 8 weeks, the second was 7 weeks. A set of 75 candidate features were considered. These requirements came from the change repository where new or to be modified requirements are stored. Among them, 15 coupling constraints and 1 precedence constraint were taken into account.
The requirements were evaluated by 20 stakeholders. Most of them were sales representatives and able to judge the importance of features for business success. For staffing, a pool of 15 developers was available. Their estimated capabilities for four types of tasks are presented in Table 8.7. Three levels of productivity were defined related to the four types of tasks related to Flash, Action Script, Java, and DBA. Although not completely precise, this is a first step to overcome the limitations of considering all developers having the same productivity. Further maturity in productivity measurement is needed to be able to work with more accurate productivity profiles [Kitchenham and Mendes ‘04].
Table 8.7 Productivity of developers dev(d) for the different types of tasks

8.6.2 Main findings
The main findings of the case study project are related to a comparison between manual planning based upon intuition and experience and optimized planning applying the method described in Section 8.3. The resulting solutions are called x-manual and x-optimized, respectively. Three main findings were gained. They are described in the following.
Finding 1: Quality of plans
A formal comparison of the two plans indicated that the optimized plan was about 43.5% better in terms of the stated quality criteria (satisfaction of stakeholders). Another indicator of the improved quality is the number of features provided according to both plans. While the optimized plan offers 52 features with the two releases, it offers only 42 features for the manual plan.
Finding 2: Quality of staffing
An assignment of a developer to a task is classified as as good, average or bad if the competence level of the developer for this task is above average (prod(d,q) = 1.25), average (prod(d,q) = 1), or below average (prod(d,q) = 0.75), respectively. A formal comparison of the two plans indicates that the optimized plan has more (in total) assignments of developers to tasks. The total number of assignments has increased from 161 to 203 with an increase of the good assignments from 136 to 155 when moving from manual to optimized planning.
Figure 8.9 presents the comparison of the assignments for each of the 15 individual developers. At the horizontal axis, all the 15 developers under consideration are listed. For each of them, the task assignment between manual and optimized is compared. The comparison itself is done in terms of counting how often each developer is assigned to tasks in the respective plans. The count is done for each productivity category, that is, counting when a developer has above average (good), average (average) or below average (bad) competencies for an assigned task. In most of the cases, the number and quality of the assignments in the optimal staffing plan are better than in the manual staffing plan. The main improvement over the manual plan is the increase of the absolute number of assignments to tasks. This increase corresponds to more effective utilization of developer resources.

Figure 8.9 Quality of assignment: Comparison between manual (man) and optimized (opt) task assignments for each of the 15 developers [Kapur et al. ‘08]
Finding 3: Effort required
Besides the improved quality, the comparison also reveals a significant advantage for the optimized staffing plan in terms of effort needed. The time savings becomes more significant the more additional re-planning or proactive what-if analysis is conducted. In reality, this is happening quite often, in order to adjust to change or to run possible planning scenarios.
On average, experienced project managers spend one third of their time to handle the planning process manually. This substantial amount of effort compares with seconds of running the algorithms plus the initial effort to set-up the formalized planning process, which is in the order of two to three hours.
8.6.3 Discussion
Staffing for product releases is an extremely complex endeavor. Any ad hoc assignment would likely be deemed a waste of time and/or resources. Since human resources are typically the most critical resources for project success, any support for managers to perform staffing based on computer support looks promising [Kapur et al ‘08].
To provide meaningful staffing results, project and product managers need to consider a variety of factors. Not all of them are included in the proposed model (for example, organizational factors, process factors, or human factors related to staffing were not taken into account). The main argument is that a good solution to a reasonable approximation of the real-world problem already is a step forward in determining a practically applicable solution.
The same arguments are applicable to address the inherent uncertainty of data. Effort and productivity estimates are approximations and prone to errors. From running different scenarios (instantiations of the problem with varying parameter settings) of the given problem, the impact of parameter variations can be better understood. This proactive analysis is considered to be an essential step to facilitate better and more objective decisions made by the product and project manager.
The main practical benefits of qualifying the staffing and resource allocation process can be expected in terms of more effective resource utilization and improved (higher) total value of the proposed release plans. This value can be seen in financial terms or in terms of a better overall stakeholder satisfaction. In order to achieve these benefits, processes for planning and road-mapping of software releases, effort and resource estimation, definition of the values of features in relation to time and evaluation of the productivity of human resources need to be in place and need to be constantly qualified.