APPENDIX 1:
‘SUN FINDER’ CHARTS
Introduction
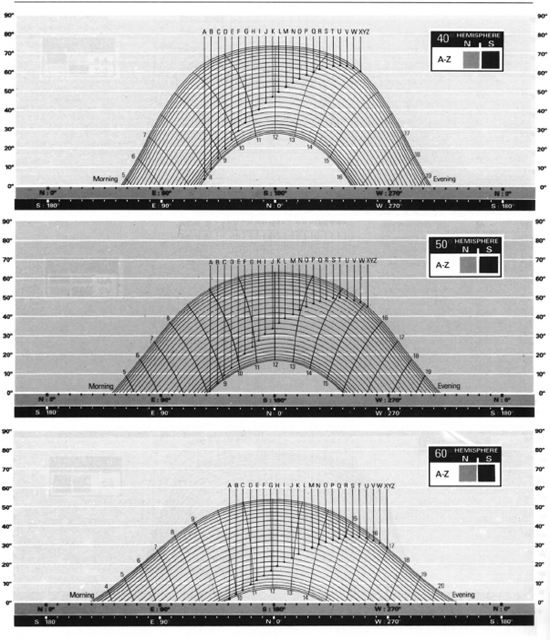
These ingenious ‘sun finder’ charts on pp. 184–86 were originally published in The Professional Guide to Photo Data by Richard Platt (Mitchell Beazley, 1991). Incredibly, they enable you to find both the direction and elevation of the sun at any location between the Arctic and Antarctic circles, at any hour on any day of the year. Accordingly, they also show the times and directions of sunrise and sunset. Although the charts may look daunting, they are actually not difficult to use, especially if you require only approximate guidance.
To be able to estimate the direction and elevation of sunshine on a building at any particular time of day is of critical importance to the planning schedule of any architectural photographer. The direction and timing of sunrise in the UK varies from approximately northeast at 04:00 hours in mid-summer to approximately southeast at 08:00 hours in mid-winter (as is simply illustrated in Figure 4.5). Likewise, sunset in the UK varies from approximately northwest at 20:00 hours in mid-summer to approximately southwest at 16:00 hours in mid-winter. Hence, the midday elevation of the sun is much lower in winter and much higher in summer. These are very significant variations, especially for north-facing buildings that are only ever directly illuminated by a summer sun. It is equally significant for those buildings in confined city areas where a high elevation of the sun is necessary for it to shine over the top of the surrounding buildings.
Sunrise and sunset information is readily available in daily newspapers for the here and now, but for other locations around the world and for dates in the future, the information is much harder to track down.
Guidelines for using the ‘sun finder’ charts
The following guidelines will enable you to locate the approximate position of the sun. For greater precision, you will need to make the corrections listed in the next section.
1Establish your approximate latitude and find the correct chart. It does not matter for the time being whether you are north or south of the equator.
2Read the date table to pick your date line (A–Z) and find that line on the chart.
3This line represents the sun's path across the sky for the week you have chosen. The horizontal axis represents the horizon, with the points of the compass, N, S, E and W, running across the scale. The elevation (height above the horizon of the sun) is marked on the vertical axis.
4The curving line represents hours of the day – morning on the left and afternoon on the right. Where the date line cuts the horizontal axis, you can read off the rising and setting times. These lines do not take into account daylight saving. If daylight saving is in operation, the sun will rise and set 1 or 2 hours later than indicated on the chart.
You will notice that all charts have two sets of compass points on the horizontal axis. This is because when the sun is overhead at the equator it appears to be in the south of the sky to everyone in the northern hemisphere, whereas those in the southern hemisphere see the sun in the north. Between the tropics, the situation is a little more complex, but if you follow the boxed directions you will always be able to find the right scale.
Corrections for greater accuracy
These charts are limited in their accuracy to about 5°, or 20 minutes of time. Corrections need to be made to locate the sun's position with greater precision. Probably the most crucial of all is your position in the time zone. The hour lines on the chart represent the time approximately as it would be indicated by a sundial, so the sun reaches its zenith exactly at noon. However, the world's time system is far more complex than this, and is organized in zones 1 hour apart.
Within each zone clocks are set to read noon when the sun reaches its zenith at the centre of the zone. However, some time zones are very wide and, in extreme instances, the sun may rise 2 or 3 hours later in the west of the time zone than it does in the east. The easiest way to compensate for this is to consult an atlas and calculate how many degrees of longitude separate your location from the Greenwich meridian. Divide the number of degrees by 15 to find out how many hours behind or ahead of Greenwich your true local noon is. Compare this with official local time to determine the necessary correction.
Two further corrections may be necessary for greater accuracy. First, the times shown are most accurate when the sun is observed over the sea. At other places, the horizon is higher and the time of day correspondingly shorter. Second, if you are using a compass to find north, remember that for precise readings magnetic north is not quite the same as true north. The difference changes year by year, and can be checked on a recent map.
Finally, plotting a hemisphere onto a flat piece of paper inevitably introduces distortions. The projection used here is accurate for the horizon, but since the points of the compass converge on the zenith, the scale of degrees gets progressively more distorted the higher the sun is in the sky. This does not actually introduce an error but simply means that the charts give the sun's direction with less precision at noon than at dusk and dawn.
Projection distortions.
Plotting a hemisphere onto a flat piece of paper inevitably introduces distortions. The projection used here is accurate for the horizon, but common sense shows that, since the points of the compass converge on the zenith, the scale of degrees gets progressively more distorted the higher the sun is in the sky. This does not actually introduce an error – it simply means that the charts give the sun's direction with less precision at noon than at dusk and dawn