
11. Testing, Debugging, Profiling, and Tuning
Unlike programs in languages such as C or Java, Python programs are not processed by a compiler that produces an executable program. In those languages, the compiler is the first line of defense against programming errors—catching mistakes such as calling functions with the wrong number of arguments or assigning improper values to variables (that is, type checking). In Python, however, these kinds of checks do not occur until a program runs. Because of this, you will never really know if your program is correct until you run and test it. Not only that, unless you are able to run your program in a way that executes every possible branch of its internal control-flow, there is always some chance of a hidden error just waiting to strike (fortunately, this usually only happens a few days after shipping, however).
To address these kinds of problems, this chapter covers techniques and library modules used to test, debug, and profile Python code. At the end, some strategies for optimizing Python code are discussed.
Documentation Strings and the doctest Module
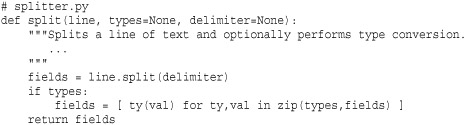
If the first line of a function, class, or module is a string, that string is known as a documentation string. The inclusion of documentation strings is considered good style because these strings are used to supply information to Python software development tools. For example, the help() command inspects documentation strings, and Python IDEs look at the strings as well. Because programmers tend to view documentation strings while experimenting in the interactive shell, it is common for the strings to include short interactive examples. For example:
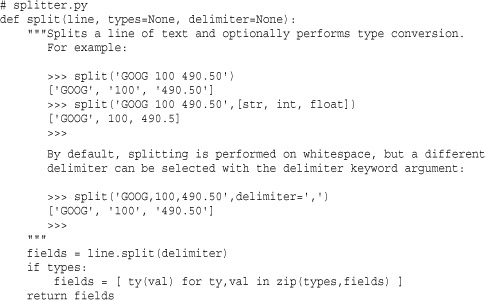
A common problem with writing documentation is keeping the documentation synchronized with the actual implementation of a function. For example, a programmer might modify a function but forget to update the documentation.
To address this problem, use the doctest module. doctest collects documentation strings, scans them for interactive sessions, and executes them as a series of tests. To use doctest, you typically create a separate module for testing. For example, if the previous function is in a file splitter.py, you would create a file testsplitter.py for testing, as follows:
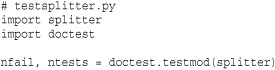
In this code, the call to doctest.testmod( runs tests on the specified module and returns the number of failures and total number of tests executed. No output is produced if all of the tests pass. Otherwise, you will get a failure report that shows the difference between the expected and received output. If you want to see verbose output of the tests, you can use module)testmod(.module, verbose=True)
As an alternative to creating a separate testing file, library modules can test themselves by including code such as this at the end of the file:
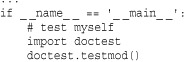
With this code, documentation tests will run if the file is run as the main program to the interpreter. Otherwise, the tests are ignored if the file is loaded with import.
doctest expects the output of functions to literally match the exact output you get in the interactive interpreter. As a result, it is quite sensitive to issues of white space and numerical precision. For example, consider this function:
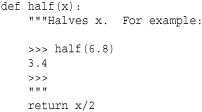
If you run doctest on this function, you will get a failure report such as this:

To fix this, you either need to make the documentation exactly match the output or need to pick a better example in the documentation.
Because using doctest is almost trivial, there is almost no excuse for not using it with your own programs. However, keep in mind that doctest is not a module you would typically use for exhaustive program testing. Doing so tends to result in excessively long and complicated documentation strings—which defeats the point of producing useful documentation (e.g., a user will probably be annoyed if he asks for help and the documentation lists 50 examples covering all sorts of tricky corner cases). For this kind of testing, you want to use the unittest module.
Last, the doctest module has a large number of configuration options that concerns various aspects of how testing is performed and how results are reported. Because these options are not required for the most common use of the module, they are not covered here. Consult http://docs.python.org/library/doctest.html for more details.
Unit Testing and the unittest Module
For more exhaustive program testing, use the unittest module. With unit testing, a developer writes a collection of isolated test cases for each element that makes up a program (for example, individual functions, methods, classes, and modules). These tests are then run to verify correct behavior of the basic building blocks that make up larger programs. As programs grow in size, unit tests for various components can be combined to create large testing frameworks and testing tools. This can greatly simplify the task of verifying correct behavior as well as isolating and fixing problems when they do occur. Use of this module can be illustrated by the code listing in the previous section:
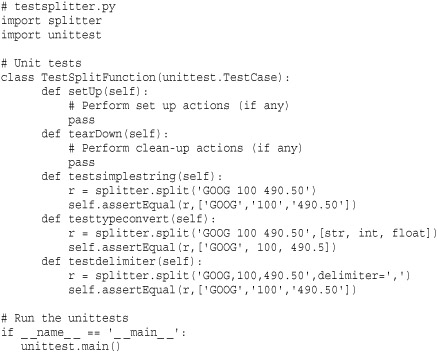
If you wanted to write unit tests for testing various aspects of the split() function, you would create a separate module testsplitter.py, like this:
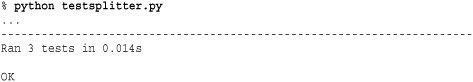
To run tests, simply run Python on the file testsplitter.py. Here’s an example:
Basic use of unittest involves defining a class that inherits from unittest.TestCase. Within this class, individual tests are defined by methods starting with the name 'test'—for example, 'testsimplestring', 'testtypeconvert', and so on. (It is important to emphasize that the names are entirely up to you as long as they start with 'test'.) Within each test, various assertions are used to check for different conditions.
An instance, t, of unittest.TestCase has the following methods that are used when writing tests and for controlling the testing process:
t.setUp()
Called to perform set-up steps prior to running any of the testing methods.
t.tearDown()
Called to perform clean-up actions after running the tests.
Signals a test failure if expr evaluates as False. msg is a message string giving an explanation for the failure (if any).
![]()
Signals a test failure if x and y are not equal to each other. msg is a message explaining the failure (if any).
![]()
Signals a test failure if x and y are equal to each other. msg is a message explaining the failure (if any).
![]()
Signals a test failure if numbers x and y are not within places decimal places of each other. This is checked by computing the difference of x and y and rounding the result to the given number of places. If the result is zero, x and y are almost equal. msg is a message explaining the failure (if any).
![]()
Signals a test failure if x and y are not at least places decimal places apart. msg is a message explaining the failure (if any).
![]()
Signals a test failure if the callable object callable does not raise the exception exc. Remaining arguments are passed as arguments to callable. Multiple exceptions can be checked by using a tuple of exceptions as exc.
t. failIf (expr [, msg])
Signals a test failure if expr evaluates as True. msg is a message explaining the failure (if any).
t.fail([msg])
Signals a test failure. msg is a message explaining the failure (if any).
t.failureException
This attribute is set to the last exception value caught in a test. This may be useful if you not only want to check that an exception was raised, but that the exception raises an appropriate value—for example, if you wanted to check the error message generated as part of raising an exception.
It should be noted that the unittest module contains a large number of advanced customization options for grouping tests, creating test suites, and controlling the environment in which tests run. These features are not directly related to the process of writing tests for your code (you tend to write testing classes as shown independently of how tests actually get executed). Consult the documentation at http://docs.python.org/library/unittest.html for more information on how to organize tests for larger programs.
The Python Debugger and the pdb Module
Python includes a simple command-based debugger which is found in the pdb module. The pdb module supports post-mortem debugging, inspection of stack frames, breakpoints, single-stepping of source lines, and code evaluation.
There are several functions for invoking the debugger from a program or from the interactive Python shell.
run(statement [, globals [, locals]])
Executes the string statement under debugger control. The debugger prompt will appear immediately before any code executes. Typing 'continue' will force it to run. globals and locals define the global and local namespaces, respectively, in which the code runs.
runeval(expression [, globals [, locals]])
Evaluates the expression string under debugger control. The debugger prompt will appear before any code executes, so you will need to type 'continue' to force it to execute as with run(). On success, the value of the expression is returned.
runcall(function [, argument, ...])
Calls a function within the debugger. function is a callable object. Additional arguments are supplied as the arguments to function. The debugger prompt will appear before any code executes. The return value of the function is returned upon completion.
set_trace()
Starts the debugger at the point at which this function is called. This can be used to hard-code a debugger breakpoint into a specific code location.
post_mortem(traceback)
Starts post-mortem debugging of a traceback object. traceback is typically obtained using a function such as sys.exc_info().
pm()
Enters post-mortem debugging using the traceback of the last exception.
Of all of the functions for launching the debugger, the set_trace() function may be the easiest to use in practice. If you are working on a complicated application but you have detected a problem in one part of it, you can insert a set_trace() call into the code and simply run the application. When encountered, this will suspend the program and go directly to the debugger where you can inspect the execution environment. Execution resumes after you leave the debugger.
Debugger Commands
When the debugger starts, it presents a (Pdb) prompt such as the following:
(Pdb) is the debugger prompt at which the following commands are recognized. Note that some commands have a short and a long form. In this case, parentheses are used to indicate both forms. For example, h(elp) means that either h or help is acceptable.
[!]statement
Executes the (one-line) statement in the context of the current stack frame. The exclamation point may be omitted, but it must be used to avoid ambiguity if the first word of the statement resembles a debugger command. To set a global variable, you can prefix the assignment command with a “global” command on the same line:
![]()
![]()
Prints the argument list of the current function.
alias [name [command]]
Creates an alias called name that executes command. Within the command string, the substrings '%1','%2', and so forth are replaced by parameters when the alias is typed. '%*' is replaced by all parameters. If no command is given, the current alias list is shown. Aliases can be nested and can contain anything that can be legally typed at the Pdb prompt. Here’s an example:
![]()
Sets a breakpoint at location loc. loc either specifies a specific filename and line number or is the name of a function within a module. The following syntax is used:
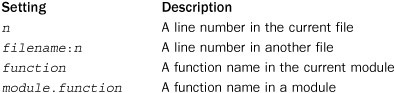
If loc is omitted, all the current breakpoints are printed. condition is an expression that must evaluate to true before the breakpoint is honored. All breakpoints are assigned numbers that are printed as output upon the completion of this command. These numbers are used in several other debugger commands that follow.
cl(ear) [bpnumber [bpnumber ...]]
Clears a list of breakpoint numbers. If breakpoints are specified, all breaks are cleared.
commands [bpnumber]
Sets a series of debugger commands to execute automatically when the breakpoint bpnumber is encountered. When listing the commands to execute, simply type them on the subsequent lines and use end to mark the end of the command sequence. If you include the continue command, the execution of the program will resume automatically when the breakpoint is encountered. If bpnumber is omitted, the last breakpoint set is used.
condition bpnumber [condition]
Places a condition on a breakpoint. condition is an expression that must evaluate to true before the breakpoint is recognized. Omitting the condition clears any previous condition.
c(ont(inue))
Continues execution until the next breakpoint is encountered.
disable [bpnumber [bpnumber ...]]
Disables the set of specified breakpoints. Unlike with clear, they can be reenabled later.
d(own)
Moves the current frame one level down in the stack trace.
enable [bpnumber [bpnumber ...]]
Enables a specified set of breakpoints.
h(elp) [command]
Shows the list of available commands. Specifying a command returns help for that command.
ignore bpnumber [count]
Ignores a breakpoint for count executions.
j(ump) lineno
Sets the next line to execute. This can only be used to move between statements in the same execution frame. Moreover, you can’t jump into certain statements, such as statements in the middle of a loop.
l(ist) [first [, last]]
Lists source code. Without arguments, this command lists 11 lines around the current line (5 lines before and 5 lines after). With one argument, it lists 11 lines around that line. With two arguments, it lists lines in a given range. If last is less than first, it’s interpreted as a count.
Executes until the next line of the current function. Skips the code contained in function calls.
p expression
Evaluates the expression in the current context and prints its value.
pp expression
The same as the p command, but the result is formatted using the pretty-printing module (pprint).
q(uit)
Quits from the debugger.
r(eturn)
Runs until the current function returns.
run [args]
Restarts the program and uses the command-line arguments in args as the new setting of sys.argv. All breakpoints and other debugger settings are preserved.
s(tep)
Executes a single source line and stops inside called functions.
tbreak [loc [, condition]]
Sets a temporary breakpoint that’s removed after its first hit.
u(p)
Moves the current frame one level up in the stack trace.
unalias name
Deletes the specified alias.
until
Resumes execution until control leaves the current execution frame or until a line number greater than the current line number is reached. For example, if the debugger was stopped at the last line in a loop body, typing until will execute all of the statements in the loop until the loop is finished.
w(here)
Prints a stack trace.
Debugging from the Command Line
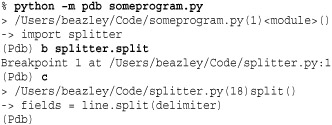
An alternative method for running the debugger is to invoke it on the command line. Here’s an example:
% python -m pdb someprogram.py
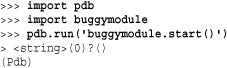
In this case, the debugger is launched automatically at the beginning of program startup where you are free to set breakpoints and make other configuration changes. To make the program run, simply use the continue command. For example, if you wanted to debug the split() function from within a program that used it, you might do this:
Configuring the Debugger
If a .pdbrc file exists in the user’s home directory or in the current directory, it’s read in and executed as if it had been typed at the debugger prompt. This can be useful for specifying debugging commands that you want to execute each time the debugger is started (as opposed to having to interactively type the commands each time).
Program Profiling
The profile and cProfile modules are used to collect profiling information. Both modules work in the same way, but cProfile is implemented as a C extension, is significantly faster, and is more modern. Either module is used to collect both coverage information (that is, what functions get executed) as well as performance statistics. The easiest way to profile a program is to execute it from the command line as follows:
% python -m cProfile someprogram.py
Alternatively, the following function in the profile module can be used:
run(command [, filename])
Executes the contents of command using the exec statement under the profiler. filename is the name of a file in which raw profiling data is saved. If it’s omitted, a report is printed to standard output.
The result of running the profiler is a report such as the following:
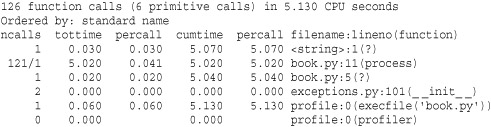
Different parts of the report generated by run() are interpreted as follows:
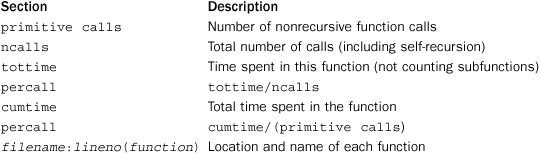
When there are two numbers in the first column (for example, "121/1"), the latter is the number of primitive calls and the former is the actual number of calls.
Simply inspecting the generated report of the profiler is often enough for most applications of this module—for example, if you simply want to see how your program is spending its time. However, if you want to save the data and analyze it further, the pstats module can be used. Consult http://docs.python.org/library/profile.html for more details about saving and analyzing the profile data.
Tuning and Optimization
This section covers some general rules of thumb that can be used to make Python programs run faster and use less memory. The techniques described here are by no means exhaustive but should give programmers some ideas when looking at their own code.
Making Timing Measurements
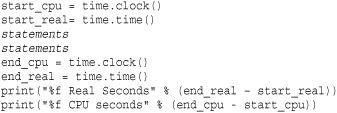
If you simply want to time a long-running Python program, the easiest way to do it is often just to run it until the control of something like the UNIX time command. Alternatively, if you have a block of long-running statements you want to time, you can insert calls to time.clock() to get a current reading of the elapsed CPU time or calls to time.time() to read the current wall-clock time. For example:
Keep in the mind that this technique really works only if the code to be timed runs for a reasonable period of time. If you have a fine-grained statement you want to benchmark, you can use the timeit( function in the code [, setup])timeit module. For example:
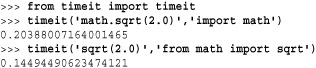
In this example, the first argument to timeit() is the code you want to benchmark. The second argument is a statement that gets executed once in order to set up the execution environment. The timeit() function runs the supplied statement one million times and reports the execution time. The number of repetitions can be changed by supplying a number=count keyword argument to timeit().
The timeit module also has a function repeat() that can be used to make measurements. This function works the same way as timeit() except that it repeats the timing measurement three times and returns a list of the results. For example:
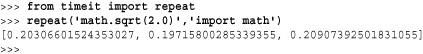
When making performance measurement, it is common to refer to the associated speedup, which usually refers to the original execution time divided by the new execution time. For example, in the previous timing measurements, using sqrt(2.0) instead of math.sqrt(2.0) represents a speedup of 0.20388/0.14494 or about 1.41. Sometimes this gets reported as a percentage by saying the speedup is about 41 percent.
Making Memory Measurements
The sys module has a function getsizeof() that can be used to investigate the memory footprint (in bytes) of individual Python objects. For example:
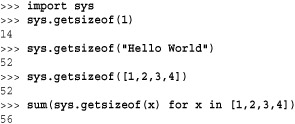
For containers such as lists, tuples, and dictionaries, the size that gets reported is just for the container object itself, not the cumulative size of all objects contained inside of it. For instance, in the previous example, the reported size of the list [1,2,3,4] is actually smaller than the space required for four integers (which are 14 bytes each). This is because the contents of the list are not included in the total. You can use sum() as shown here to calculate the total size of the list contents.
Be aware that the getsizeof() function is only going to give you a rough idea of overall memory use for various objects. Internally, the interpreter aggressively shares objects via reference counting so the actual memory consumed by an object might be far less than you first imagine. Also, given that C extensions to Python can allocate memory outside of the interpreter, it may be difficult to precisely get a measurement of overall memory use. Thus, a secondary technique for measuring the actual memory footprint is to inspect your running program from an operating system process viewer or task manager.
Frankly, a better way to get a handle on memory use may be to sit down and be analytical about it. If you know your program is going to allocate various kinds of data structures and you know what kinds of data will be stored in those structures (that is, ints, floats, strings, and so on), you can use the results of the getsizeof() function to obtain figures for calculating an upper bound on your program’s memory footprint—or at the very least, you can get enough information to carry out a “back of the envelope” estimate.
Disassembly
The dis module can be used to disassemble Python functions, methods, and classes into low-level interpreter instructions. The module defines a function dis() that can be used like this:
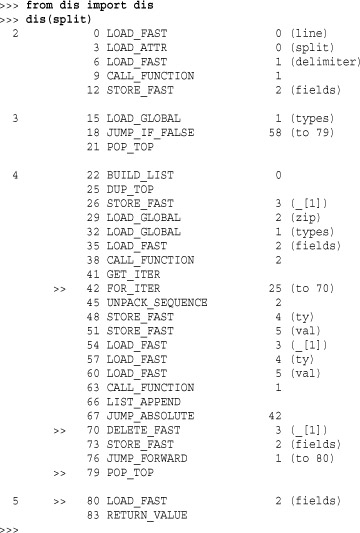
Expert programmers can use this information in two ways. First, a disassembly will show you exactly what operations are involved in executing a function. With careful study, you might spot opportunities for making speedups. Second, if you are programming with threads, each line printed in the disassembly represents a single interpreter operation—each of which has atomic execution. Thus, if you are trying to track down a tricky race condition, this information might be useful.
Tuning Strategies
The following sections outline a few optimization strategies that, in the opinion of the author, have proven to be useful with Python code.
Understand Your Program
Before you optimize anything, know that speedup obtained by optimizing part of a program is directly related to that part’s total contribution to the execution time. For example, if you optimize a function by making it run 10 times as fast but that function only contributes to 10 percent of the program’s total execution time, you’re only going to get an overall speedup of about 9%–10%. Depending on the effort involved in making the optimization, this may or may not be worth it.
It is always a good idea to first use the profiling module on code you intend to optimize. You really only want to focus on functions and methods where your program spends most of its time, not obscure operations that are called only occasionally.
Understand Algorithms
A poorly implemented O(n log n) algorithm will outperform the most finely tuned O(n3) algorithm. Don’t optimize inefficient algorithms—look for a better algorithm first.
Use the Built-In Types
Python’s built-in tuple, list, set, and dictionary types are implemented entirely in C and are the most finely tuned data structures in the interpreter. You should actively use these types to store and manipulate data in your program and resist the urge to build your own custom data structures that mimic their functionality (that is, binary search trees, linked lists, and so on).
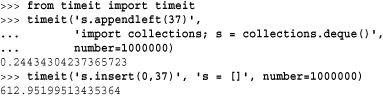
Having said that, you should still look more closely at types in the standard library. Some library modules provide new types that outperform the built-ins at certain tasks. For instance, the collection.deque type provides similar functionality to a list but has been highly optimized for the insertion of new items at both ends. A list, in contrast, is only efficient when appending items at the end. If you insert items at the front, all of the other elements need to be shifted in order to make room. The time required to do this grows as the list gets larger and larger. Just to give you an idea of the difference, here is a timing measurement of inserting one million items at the front of a list and a deque:
Don’t Add Layers
Any time you add an extra layer of abstraction or convenience to an object or a function, you will slow down your program. However, there is also a trade-off between usability and performance. For instance, the whole point of adding an extra layer is often to simplify coding, which is also a good thing.
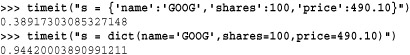
To illustrate with a simple example, consider a program that makes use of the dict() function to create dictionaries with string keys like this:
![]()
A programmer might create dictionaries in this way to save typing (you don’t have to put quotes around the key names). However, this alternative way of creating a dictionary also runs much more slowly because it adds an extra function call.
If your program creates millions of dictionaries as it runs, then you should know that the first approach is faster. With few exceptions, any feature that adds an enhancement or changes the way in which an existing Python object works will run more slowly.
Know How Classes and Instances Build Upon Dictionaries
User-defined classes and instances are built using dictionaries. Because of this, operations that look up, set, or delete instance data are almost always going to run more slowly than directly performing these operations on a dictionary. If all you are doing is building a simple data structure for storing data, a dictionary may be a more efficient choice than defining a class.
Just to illustrate the difference, here is a simple class that represents a holding of stock:
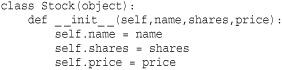
If you compare the performance of using this class against a dictionary, the results are interesting. First, let’s compare the performance of simply creating instances:
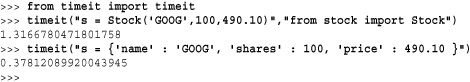
Here, the speedup of creating new objects is about 3.5. Next, let’s look at the performance of performing a simple calculation:
Here, the speedup is about 1.2. The lesson here is that just because you can define a new object using a class, it’s not the only way to work with data. Tuples and dictionaries are often good enough. Using them will make your program run more quickly and use less memory.
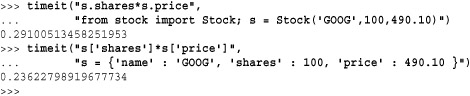
Use _ _slots_ _
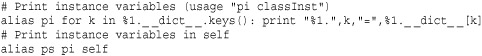
If your program creates a large number of instances of user-defined classes, you might consider using the _ _slots_ _ attribute in a class definition. For example:
_ _slots_ _ is sometimes viewed as a safety feature because it restricts the set of attribute names. However, it is really more of a performance optimization. Classes that use _ _slots_ _ don’t use a dictionary for storing instance data (instead, a more efficient internal data structure is used). So, not only will instances use far less memory, but access to instance data is also more efficient. In some cases, simply adding _ _slots_ _ will make a program run noticeably faster without making any other changes.
There is one caution with using _ _slots_ _, however. Adding this feature to a class may cause other code to break mysteriously. For example, it is generally well-known that instances store their data in a dictionary that can be accessed as the _ _dict_ _ attribute. When slots are defined, this attribute doesn’t exist so any code that relies on _ _dict_ _ will fail.
Avoid the (.) Operator
Whenever you use the (.) to look up an attribute on an object, it always involves a name lookup. For example, when you say x.name, there is a lookup for the variable name "x" in the environment and then a lookup for the attribute "name" on x. For user-defined objects, attribute lookup may involve looking in the instance dictionary, the class dictionary, and the dictionaries of base-classes.
For calculations involving heavy use of methods or module lookups, it is almost always better to eliminate the attribute lookup by putting the operation you want to perform into a local variable first. For example, if you were performing a lot of square root operations, it is faster to use 'from math import sqrt' and 'sqrt(x)' rather than typing 'math.sqrt(x)'. In the first part of this section, we saw that this approach resulted in speedup of about 1.4.
Obviously you should not try to eliminate attribute lookups everywhere in your program because it will make your code very difficult to read. However, for performance-critical sections, this is a useful technique.
Use Exceptions to Handle Uncommon Cases
To avoid errors, you might be inclined to add extra checks to a program. For example:
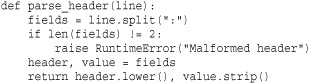
However, an alternative way to handle errors is to simply let the program generate an exception and to catch it. For example:
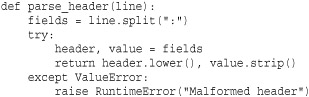
If you benchmark both versions on a properly formatted line, the second version of code runs about 10 percent faster. Setting up a try block for code that normally doesn’t raise an exceptions runs more quickly than executing an if statement.
Avoid Exceptions for Common Cases
Don’t write code that uses exception handling for the common case. For example, suppose you had a program that performed a lot of dictionary lookups, but most of these lookups were for keys that didn’t exist. Now, consider two approaches to performing a lookup:
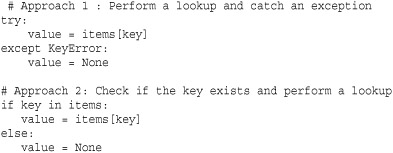
In a simple performance measurement where the key is not found, the second approach runs more than 17 times faster! In case you were wondering, this latter approach also runs almost twice as fast as using items.get(key) because the in operator is faster to execute than a method call.
Embrace Functional Programming and Iteration
List comprehensions, generator expressions, generators, coroutines, and closures are much more efficient than most Python programmers realize. For data processing especially, list comprehensions and generator expressions run significantly more quickly than code that manually iterates over data and carries out similar operations. These operations also run much more quickly than legacy Python code that uses functions such as map() and filter(). Generators can be used to write code that not only runs fast, but which makes efficient use of memory.
Use Decorators and Metaclasses
Decorators and metaclasses are features that are used to modify functions and classes. However, because they operate at the time of function or class definition, they can be used in ways that lead to improved performance—especially if a program has many optional features that might be turned on or off. Chapter 6, “Functions and Functional Programming,” has an example of using a decorator to enable logging of functions, but in a way that does not impact performance when logging is disabled.