
CHAPTER 1
Soundwaves
Vibrating objects cause the compression and rarefaction of air molecules, and this alternating difference in pressure creates waves of sound (see Figure 1.1). All waveforms with pitch are periodic, which means they have shapes that repeat, and musical instruments generate these periodic soundwaves for every note in their range. A single wavelength consists of a peak (compression of the air molecules) and a trough (rarefaction), and physicists measure wavelength in degrees (as though the wave had been compressed into a circle). A complete cycle lasts 360°, with the peak at 90° and the trough at 270°. Scientists define the time a wave takes to complete one cycle as its period. The simplest waveform, the sine wave, has the shape seen in Figure 1.2.
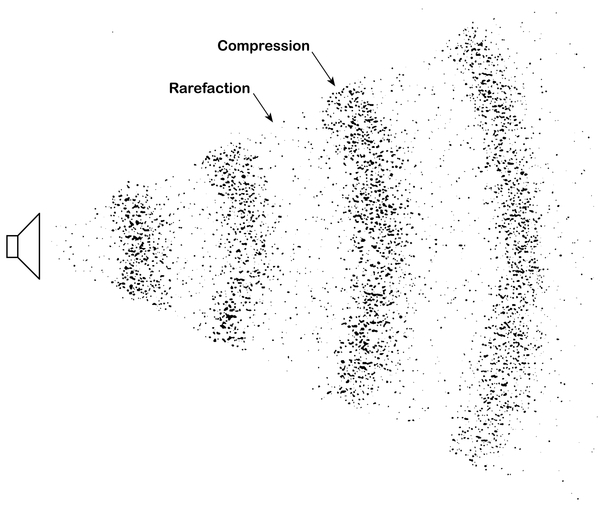
Figure 1.1 Compression and rarefaction of soundwaves.
Physicists usually represent soundwaves in this way, that is, by undulating lines on a graph, instead of by drawings that show the actual compression and rarefaction of air molecules (as seen in Figure 1.1). Figure 1.3 demonstrates the relationship between the physical phenomenon of sound and the graphic representation commonly used to depict soundwaves.
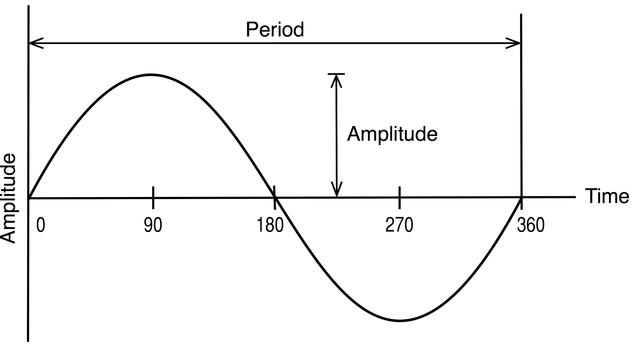
Figure 1.2 Periodic waveform.

Figure 1.3 Graphic representation vs. the physical phenomenon of sound.
The number of complete cycles per second determines the frequency of a sound, and physicists state this number in hertz (Hz). A frequency of 1,000 Hz (1 kHz) means that the wave repeats 1,000 times every second, with each cycle lasting 1 millisecond (ms). Figure 1.4 shows two sine waves of the same amplitude (level) but with different frequencies. The wave occupying period T1 (the solid line) is half the length of the wave occupying period T2 (the dotted line). Hence, if T1 has a cycle of 1 ms and T2 a cycle of 2 ms, the shorter wave would have a frequency of 1 kHz and the longer wave a frequency of 500 Hz.
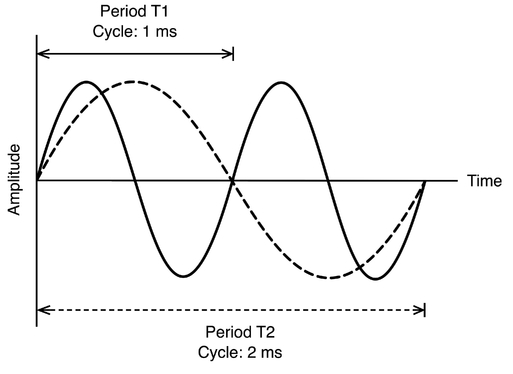
Figure 1.4 Cycle and period.
The periodic nature of wave repetitions creates what we recognize as musical sound, but instruments would lack their characteristic timbral qualities if they generated only a single frequency for each note (that is, a single sine wave). Instead, they produce a complex set of frequencies arranged in a harmonic or overtone series above the lowest or fundamental frequency of the spectrum (the fundamental is the first harmonic of the series). We perceive the fundamental as the pitch of a note and the harmonics or overtones (also called partials) lying above it as the tonal color or timbre of that note. The sine waves shown above have pitch but they lack timbral quality, so physicists often describe them as pure tones. In other words, all complex waveforms with a recognizable harmonic timbre consist of a collection of sine waves, integer multiples of the fundamental frequency (two, three, four, etc. times the fundamental; see Figure 1.5).
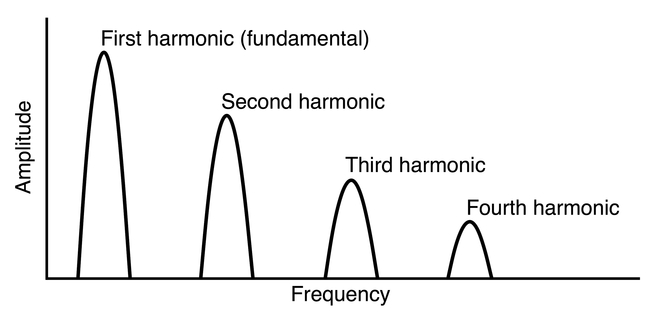
Figure 1.5 Harmonics. Note: complex waves without harmonic timbre (noise, for example) contain sine waves that are not integer multiples of the fundamental.
When expressed in terms of wavelength on a vibrating string, the mathematical relationship between the overtones and the fundamental can be depicted schematically, where a doubling of the frequency halves the wavelength, and so on (see Figure 1.6). The harmonic series can also be shown as notes on a staff (the blackened notes will be slightly out of tune in an equally tempered scale; see Figure 1.7).
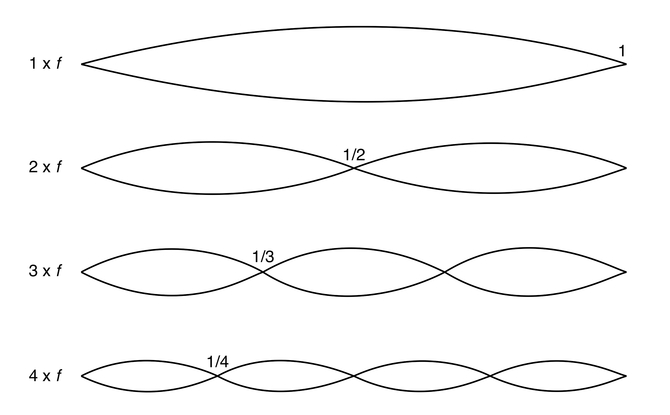
Figure 1.6 Mathematical relationship of overtones on a vibrating string (f = frequency).
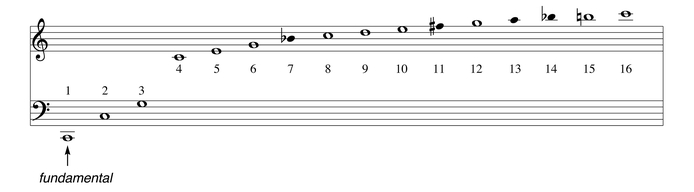
Figure 1.7 Harmonic series shown in notes.
Instruments, then, receive their characteristic timbre from multiple frequencies sounding together, but because the amplitudes of the partials vary between instruments, timbre differs according to the relative strengths of specific overtones. Saxophones and clarinets, for example, emphasize the overtones shown in Figure 1.8, while Figure 1.9 shows the complex waveform for a single violin note, first as depicted in a DAW and then as a spectrogram revealing the overtone series lying above the fundamental.

Figure 1.8 Timbre of clarinets and saxophones resulting from the relative strength of overtones.
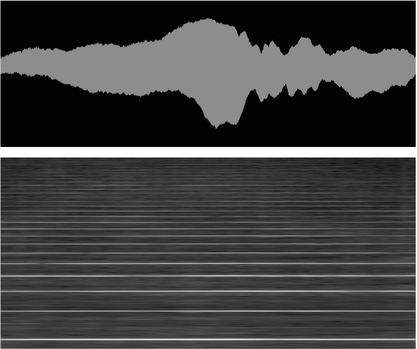
Figure 1.9 Violin note—(a) complex waveform; (b) spectrogram of fundamental and overtones.
Source: Screenshot from Mixbus used with the permission of Harrison Consoles (a). Screenshot from Rx 6 Advanced used with the permission of iZotope (b).
Enclosed Spaces
Reverberation
Soundwaves traveling in an enclosed space strike everything in the room, and unless the surfaces absorb the waves, the sound reflects. The term reverberation refers to the accumulation of random reflections arriving at a listening position so closely together that the hearer does not perceive each reflection separately.
Sound propagates spherically from a source in the direct or free field, decreasing in amplitude at a rate of 6.0 dB for every doubling of the distance (the Inverse Square Law; the drop is actually less in enclosed spaces, for the full decrease occurs only in purely free fields where sound propagation is undisturbed [outdoors] or in acoustically treated rooms that approximate free-field characteristics). A soundwave proceeding along the direct path, that is, the first wavefront, reaches the listener before the initial reflections from the floor, walls, and ceiling. The earliest identifiable reflections begin to arrive 30–80 ms after the first wavefront, and the size of the room, the nature of the surfaces, and the position of the listener determine the precise length of the delay (below 30 ms, hearers tend not to distinguish the reflections from the direct sound). As the sound-waves continue their travel, they repeatedly bounce off the room’s surfaces and the reflections gradually increase in density. This denser wash of sound prevents listeners from hearing any of the reflections individually, and the transition from early reflections to reverberation starts to occur around 80 ms (the diagram in Figure 1.10 presents a simplified schematic of these phenomena).
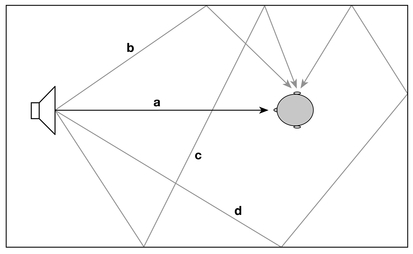
Figure 1.10 The reflection of soundwaves in a room (a = direct sound, b = first reflection, c & d = later reflections).
Furthermore, because the surfaces that the waves repeatedly strike absorb some of the energy of the late reflections, reverberant sound has a lower amplitude than that of the early reflections. Once a source has stopped emitting sound, the level of the late reflections gradually decays to a point where listeners no longer hear the reverberation. Acousticians define the time it takes for the sound pressure level of this complex set of room reflections to decrease to one-millionth of its original strength, a reduction of 60.0 dB, as the reverberation time (RT60) of the space.
Figure 1.11 depicts the varying levels and density of complex room reflections. The dotted line represents the direct sound of the first wavefront, and in this example, the early reflections begin at 30 ms and continue until about 80 ms, after which the reflections gradually become reverberation; that is, they become dense enough that listeners cannot distinguish the individual reflections. Over time, this wash of sound fades to silence.

Figure 1.11 Graphical representation of reflections.
The reverberant quality of a room results from a mixture of direct sound and reflections, and these elements provide the information necessary for listeners to perceive depth and distance. In a large space, for example, greater distances between the hearer and the sound source cause the ratio of direct to reverberant sound to shift towards reverberation. In other words, as direct sound becomes weaker, reverberation becomes more prominent. The precise weighting of the two components helps listeners determine the location of a source and their distance from it. Direct sound provides hearers with information on the location of the source, whereas early reflections help them determine the size of the room. Late reflections, on the other hand, give the sound a sense of fullness.
Performance Venues
In studying concert halls and opera houses, acousticians have found that a number of factors contribute to what people regard as a “good” performance space, and after extensive interviews with conductors and music critics, Leo Beranek (2004: 2) compiled a set of desirable concert hall characteristics:
Of these attributes, reverberation figures prominently, as it fills the gaps between notes played in succession to give music “fullness of tone” (Beranek 2004: 21), and Beranek found that both performers and listeners prefer music from the Classical and Romantic periods to be heard in rectangular halls with reverberation times between 1.7 and 2.1 seconds (Beranek 2004: 2). This observation certainly matches the properties of some of the performance venues built in the past 250 years, but the exact type of space that might suit any given piece of music is probably determined more by the compositions themselves than by the predilections of modern audiences. For instance, organ music conceived for a European cathedral built in the late Middle Ages or Renaissance often needs the long reverberation times produced by those large spaces, while a Baroque concerto written for court performance might benefit from a smaller room with a much shorter RT60.
Performance venues vary in their acoustic idiosyncrasies and may be divided into three main categories: those suitable for orchestral music, chamber music, and opera. Table 1.1 lists the size (in cubic meters), reverberation time (measured in seconds at mid-frequencies), and pre-delay (in milliseconds) for a number of venues from various countries. Orchestra halls tend to be large (generally more than 10,000 m3), with reverberation times between 1.55 and 2.05 sec and pre-delays generally in the 20 to 25 ms range. Smaller chamber halls have correspondingly shorter reverberation times, averaging around 1.5 sec, with pre-delays below 20 ms. Opera houses, because of the need for intelligibility of text delivery, have the shortest reverberation times (around 1.2 sec) and pre-delays in the 15 to 31 ms range.
Table 1.1 Volume, reverberation time, and pre-delay of performance venues. The information in this table has been taken from Beranek 2004: 551, 619–25. Pre-delay times are given in Beranek’s individual sections on the halls, as well as Table 4.4, p. 551. Beranek reports RT60 averages for mid-frequencies, 350–1400 Hz, of fully occupied halls.


But beyond these basic traits, other features of reverberant spaces influence the perception of sound quality. For example, early reflections can create a sense of intimacy, even in a larger hall, for when the pre-delay is short (about 20 ms) the sounds seem to originate from nearby surfaces, which gives a room the feeling of presence. This is one of the reasons Beranek cites (2004: 27–8) for the preference of rectangular-shaped performance spaces: because first reflections usually arrive from nearby sidewalls, narrower rooms have the lower pre-delays associated with intimacy. In wider spaces, however, first reflections occur later than in rectangular halls, so the sources tend to sound somewhat more diffuse.
Clarity also depends on the relationship between early and late reflections, for if the first reflections are louder than the reverberation, the “definition” or clarity of notes played in succession tends to increase. Moreover, narrow shoebox-shaped rooms contribute to an overall sense of spaciousness, for the abundance of early lateral reflections arriving at a listening position makes the instrument appear to emanate from a space considerably wider than that of the instrument itself (Beranek 2004: 29).
These factors clearly influence the perception of sound in reverberant spaces, so much so that some music seems better suited to certain types of rooms than others. As mentioned above, compositions with detailed contrapuntal lines (such as concertos and symphonies written in the eighteenth century) may benefit from narrower rectangular halls with strong early reflections and reverberation times of about 1.4 or 1.5 sec, whereas choral music conceived for the acoustics of large cathedrals may require a space that not only has proportionally more reverberant energy than early-reflection energy but also has an RT60 at or over 2.5 sec.
Reference
Beranek, Leo. 2004. Concert Halls and Opera Houses: Music, Acoustics, and Architecture. 2nd ed. New York, NY: Springer.