Chapter 10
Benefits of Market Coupling in Terms of Social Welfare
Pedro Mejía Gómez OMIE, Madrid, Spain
Abstract
The goal of having an internal electricity market is a priority of the European Commission and Council. The European market-coupling project which is promoted by power exchanges and working together with transmission system operators has implemented a pan-European market coupling algorithm that integrates the day-ahead markets of 17 countries covering around 70% of European electricity demand.
Currently, the NWE and SWE regions are already fully coupled and this allows simultaneous calculation of electricity prices and cross-border flows across regions. The direct consequences are:
• Optimization and more efficient use of existing cross-border capacities.
• Elimination of significant amounts of capacity not being used in the price differential direction.
• Improvement of price convergence between different areas and a more reliable electricity price on the day-ahead time horizon.
These benefits are already visible and will be further measured in a more precise way in the months to come.
Keywords
market coupling
social welfare
cross-border trading
price convergence
marginal price
power exchange
wholesale electricity market
1. Introduction
In February 2011, the Heads of State and Government agreed that “The internal market should be completed by 2014 so as to allow gas and electricity to flow freely” (European Council, 2011). The European Council thereby reinforced the political support for an effective integration process, provided a specific date, and accelerated the implementation of the so-called “Third Package.”
Within this context, and according to the cross-regional roadmaps set up by the Agency for the Cooperation of Energy Regulators (ACER), National Regulatory Authorities, and the European Commission, power exchanges have been working with the support of all the European stakeholders on the coupling of day-ahead markets across the European Union (EU).
On May 13, 2014 the southwestern Europe (SWE) and the northwestern Europe (NWE) day-ahead (DA) markets were successfully coupled. As a result, the SWE and the NWE projects, stretching from Portugal to Finland, now operate under a common DA power price calculation using the price coupling of regions (PCR) solution.
With the achievement of the full coupling of the SWE–NWE DA markets, the cross-border capacity of all interconnectors within and between the following NWE and SWE countries is now optimally allocated in the DA timeframe: Belgium, Denmark, Estonia, Finland, France, Germany/Austria, Great Britain, Latvia, Lithuania, Luxembourg, the Netherlands, Norway, Poland (via the SwePol Link), Portugal, Spain, and Sweden. Following the NWE–SWE full coupling, further extensions of market coupling (MC) with the PCR solution are envisaged. The combined DA markets of the NWE and SWE projects account for about 2400 TWh of yearly consumption.
The DA MC will bring significant benefits for end consumers derived from a more efficient use of the power system and cross-border infrastructures as a consequence of a stronger coordination between energy markets. This chapter addresses the benefits of this key milestone on the road toward building an internal energy market and analyzes what this integration project means for European customers in terms of economic gains (Fisher et al., 2013).
The chapter also offers some thoughts on the impact this market-based approach to the management of electricity interconnections may have in neighboring Mediterranean countries.
2. Day-ahead electricity markets in Europe
The core activity of wholesale electricity markets in Europe is the DA market, where trading takes place on one day for the delivery of electricity the next day (Hunt, 2002). Market members submit their orders electronically to power exchanges, after which supply and demand are matched and the market price is calculated for each hour of the following day.
Power exchanges operate in an open trade context, so market agents can either bilaterally engage in any type of agreement for the delivery of energy (in the so-called bilateral market) and then declare their production/consumption schedule directly to the system operator at the market gate closure or submit bids for buying and selling power to power exchanges. These organized markets are optional, anonymous, and accessible to all participants satisfying admission requirements.
Ideally, the main objective of power exchanges is to ensure a transparent and reliable wholesale price formation mechanism in the power market, by matching supply and demand at a fair price, and to guarantee that the purchases made on the exchange are finally delivered and paid for.
Market equilibrium in the short term is illustrated schematically in Fig. 10.1, which is also useful for determining consumer surplus. This surplus is defined as total utility less total price paid (i.e., the area located between the demand curve and the equilibrium price). Similarly, the area to the right of the equilibrium point underneath the demand curve is the aggregate consumer utility that is not satisfied because marginal utility is lower than the equilibrium price. In a perfectly competitive electricity market, each producer’s optimum output and price are defined by the marginal cost curve, and, in the aggregate, this ensures that demand is met by the most efficient units.

Figure 10.1 Short-term equilibrium between supply and demand in marginal price systems. Source: OMIE.
The price of electricity is becoming a major issue for society at large; not only for household users but also for business and industry due to the impact it has on their competitiveness in an open and globalized environment. This has been the backdrop to the launch of the EU’s internal electricity market, with the first steps being taken in the 1990s, with the aim of passing on the benefits of the liberalization of the energy sector, involving better prices and services, to households and businesses alike (Boltz, 2013).
Those years saw the beginning of the creation of organized markets in all of Europe’s regions. OMIE manages the spot market in the Iberian Peninsula, in much the same way as Nord Pool Spot does in the Nordic countries; EPEXSpot in France, Germany, and other Central European countries; and GME in Italy. Figure 10.2 displays different DA markets in the EU.
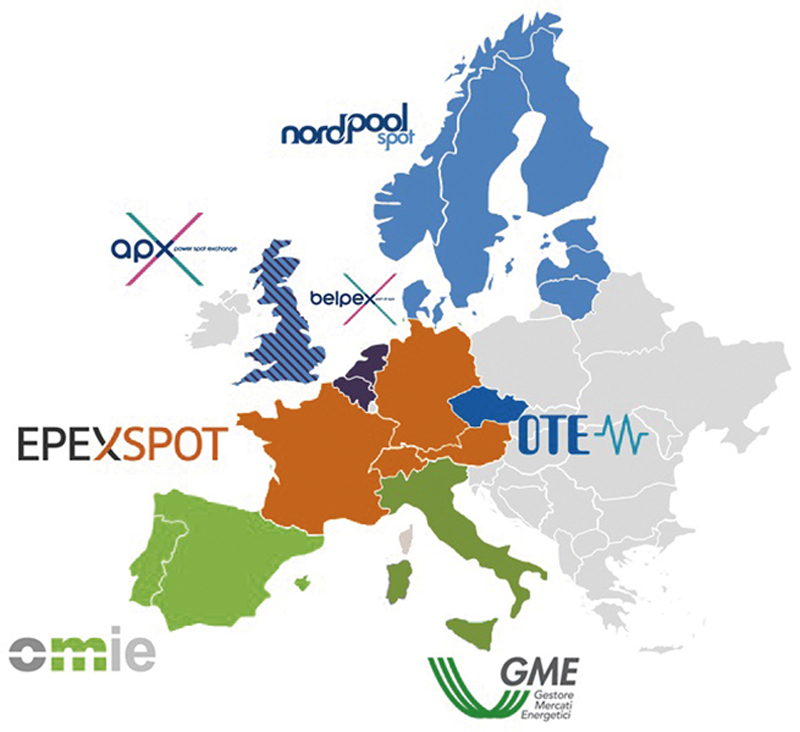
Figure 10.2 DA markets in the EU. Source: OMIE, PCR Project.
3. Benefits from electricity cross-border trading
A competitive wholesale electricity market at the EU level will be a reality as soon as cross-border electricity transactions between different member states flow in the most economically efficient direction (ERGEG, 2010), making the overall costs more efficient, and maximizing the welfare of both consumers and producers. International trading will lead to congestion on most of the EU borders and price spreads between different market areas will foster proper investments in more interconnections.
Therefore, the number of congested hours per year could be an indicator of performance, which reflects the level of cross-border trade. Indeed, the more integration we have the smaller the number of congested hours should be.
Another potential indicator reflecting the degree of cross-border trade over a specific border could be the congestion costs on this border. This indicator would be more complete than the previous one because it also takes into account the financial value of congestions. The congestion costs are the cost to society of having different prices in power markets. In other words, congestion costs are the loss in social welfare due to the congestion.
Figure 10.3 shows the net export curve (NEC) of interconnected markets A and B. For a given hour, the NEC of each market is constructed from the supply and demand curves of the market. Specifically, for each price P there is a given demand for imports (excess domestic demand) or supply of exports (excess domestic supply). These quantities represent the difference between offers and bids corresponding to each price (P). In other words, the NEC of a market gives, for each additional megawatt exported or imported by the market, the price that would be observed in this market.

Figure 10.3 NECs of interconnected markets A and B. Source: OMIE.
As long as there is enough interconnection capacity between markets A and B, there will be a single clearing price for both markets, which is the intersection of NEC (A) and NEC (B). On the contrary, if there is insufficient interconnection capacity, markets A and B will be cleared at PB and PA, respectively. The foregone surplus (congestion costs) is represented by the striped area.
In this context, the implementation of congestion management mechanisms to optimize the use of current cross-border capacities, to ensure that cross-border flows go in the right economic direction and to promote more price convergence, has been a key priority of European regulators in the last decade.
4. Day-ahead market coupling
To solve the problems of congestion, insufficient utilization of the network, and the inefficient flow of energy between areas, an implicit auction system has been introduced.
This way of joining and integrating different energy markets into one cross-border market is called market coupling (MC) (Belmans et al., 2009). In a coupled market, demand and supply orders on one power exchange are no longer confined to the local territorial area. On the contrary, in an MC approach, energy transactions can involve sellers and buyers from different areas, only restricted by the constraints of the electricity network.
The main benefit of the MC approach lies in the improvement in market liquidity combined with the beneficial side effect of less volatile electricity prices. Additionally, MC is beneficial for market players too. They no longer need to acquire transmission capacity rights to carry out cross-border transactions, since these cross-border exchanges are given as a result of the MC mechanism. They only have to submit a single order in their market (via their corresponding power exchange), which will be matched with other competitive orders in the same market or other markets (provided electricity network constraints are respected).
The idea behind MC is to maximize the social welfare of both consumers and producers. As shown in the graph (Fig. 10.5), the clearing price at which the algorithm sets the price is the most efficient, creating the greatest area of welfare possible.
The first scenario in Fig. 10.4 shows two unconnected markets; both markets have different prices and therefore different welfare areas. The idea of connecting them both with the MC algorithm (Fig. 10.5) will benefit both as a whole. The cheaper market will increase the price and the most expensive will reduce it, but seen as a single market, the overall social welfare will increase, the combined market will be more efficient and beneficial to both consumers and producers.

Figure 10.4 Not connected. Source: OMIE.
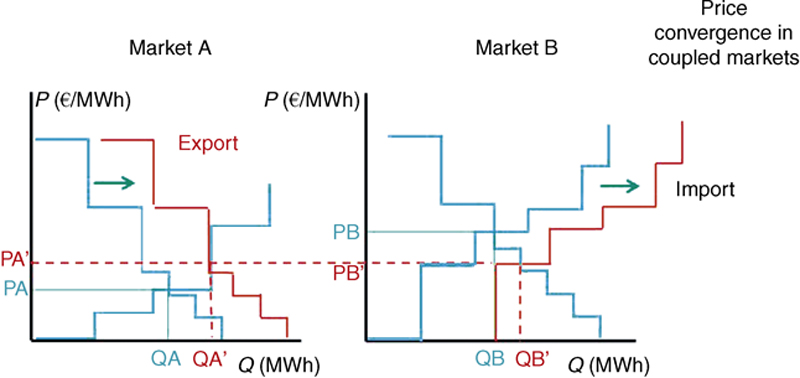
Figure 10.5 Connected. Source: OMIE.
4.1. EUPHEMIA Algorithm
EUPHEMIA (pan-European Hybrid Electricity Market Integration Algorithm) is an algorithm developed by European power exchanges to couple different DA markets and handle standard and more sophisticated order types with all their requirements. Its aim is to rapidly find a good solution from which it continues to improve and increase overall welfare. This is the sum of consumer surplus, producer surplus, and congestion rent across the regions. EUPHEMIA is a generic algorithm: there is no hard limit on the number of markets, orders, or network constraints; all orders of the same type submitted by the participants are treated equally.
The development of EUPHEMIA started in July 2011 using one of the existing local algorithms as a starting point. The first stable version capable of covering the whole PCR range was internally delivered one year later (July 2012). Since then, the product has been evolving, including both corrective and evolutionary changes.
EUPHEMIA receives information about the power transmission network, which is then modeled in the form of constraints to be respected in the final solution. This information will be mainly provided by transport system operators (TSOs) as input to the algorithm.
The information received is divided into bidding areas and EUPHEMIA computes a market clearing price for every bidding area per period and a corresponding net position (calculated as the difference between matched supply and matched demand quantities belonging to that bidding area).
Bidding areas can exchange energy between themselves in an available transfer capacity (ATC) model, a flow-based model, or a hybrid model (a hybrid of the other two).
5. Benefits from pan-European market coupling
On May 13, 2014 in a landmark move toward an integrated European power market, full coupling of the SWE DA markets was successfully launched. As a result, the SWE and NWE projects, stretching from Portugal to Finland, now operate under a common DA power price calculation using the PCR solution.
Since that date DA transmission capacity on the French–Spanish border has been implicitly allocated through the PCR solution, replacing the previous daily explicit allocation. Full price coupling between the NWE and SWE projects allows simultaneous calculation of electricity prices and cross-border flows across the region. This will bring a benefit for end consumers derived from a more efficient use of the power system and cross-border infrastructures as a consequence of stronger coordination between energy markets.
Following the launch of the PCR on February 4, daily average cleared volume over these markets amounted to 3.2 TWh, with an average daily value of over €200 million. Following the NWE–SWE full coupling, further extensions of MC with the PCR solution are envisaged.
In the following sections, the chapter addresses the benefits of this project in the case of the interconnection between France and Spain.
5.1. Optimizing the Use of Existing Cross-Border Capacities
The most immediate effect after the implementation of implicit auctions across Europe is improvements in the use of existing interconnections. In the case of MIBEL (Mercado Ibérico de la Electricidad, Iberian Electricity Market), this was very important for French–Spanish interconnection in the first months of MC.
According to our own calculations for 2012 and 2013, the percentage of hours per year in which the cross-border capacity between France and Spain was not used at maximum capacity was around 55 and 47%, respectively. Therefore, during around 50% of the hours, the interconnection between the two countries was underused. This indicator was even worse in the first months of 2014, until MC was implemented. From January 2014 until May 13, 2014, the interconnection capacity was not used at its maximum for around 62% of the time.
After implementation of the PCR on May 13, 2014, the use of cross-border capacity improved significantly. In the period May 13–July 31, cross-border capacity was fully used 94% of the time and only 6% of the time was it not used at maximum, due to the fact that Spain and France had the same price levels.
In this context, another indicator used to evaluate optimization of the French–Spanish interconnection may be average capacity not used when a price difference exists. In 2012 and 2013, around 515 and 454 MW were not finally used in average terms for time with unused capacity.
In 2014, this indicator remained at the same level (around 453 MW) until May 13 when MC between SWE and NWE entered into operation. After implementation of the new scheme, average capacity not finally used at times when there was a price difference was zero.
5.2. Cross-Border Electricity Flows in the Right Direction
In 2010 the national energy regulators of the SWE electricity region started publishing regional reports on the management and use of interconnections. One of the most relevant findings of these reports was that important amounts of capacity were not being used in the price differential direction.
Figure 10.6 shows how many cross-border transactions at the French–Spanish border took place in the wrong direction due to explicit allocation of capacities before price formation in DA markets. On the contrary, Fig. 10.7 presents what is currently happening with cross-border transactions at the same interconnection. As can be seen, after implementation of MC there are no transactions in the antieconomic price direction. In other words, cross-border electricity flows go from lower to higher prices in all cases.

Figure 10.6 Difference price versus net export/import for the French–Spanish interconnection (until May 13, 2014).
FR, France; SP, Spain. Source: OMIE.
FR, France; SP, Spain. Source: OMIE.

Figure 10.7 Difference price versus net export/import for the French–Spanish interconnection (from May 13 until December 31, 2014).
FR, France; SP, Spain. Source: OMIE.
FR, France; SP, Spain. Source: OMIE.
According to OMIE’s estimations for 2012 and 2013, cross-border transactions were executed in the wrong direction for 17 and 13% of the time, respectively. In 2014 the same situation happened for 16% of the time (until MC was implemented). Afterward, this situation has not occurred again, as has been the case with other European interconnections where MC has been implemented. Figure 10.8 shows how antieconomic, cross-border flows have also disappeared from the French–British interconnection.
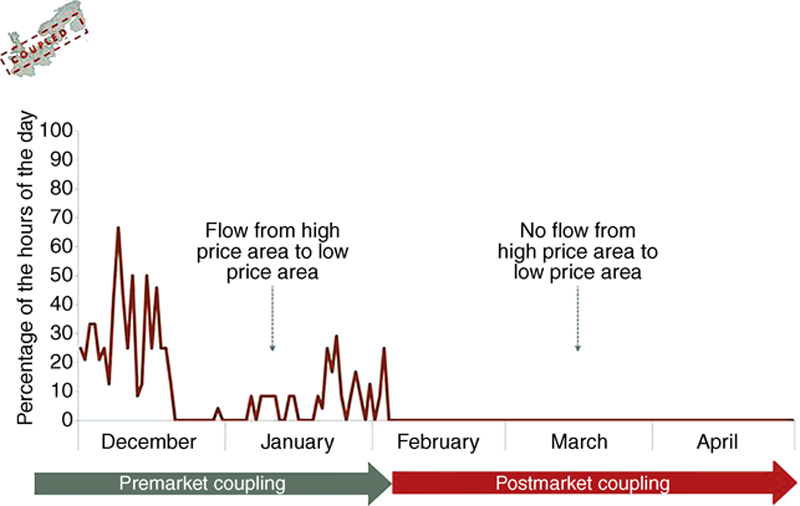
Figure 10.8 MC flows for IFA interconnector between France and Great Britain. Source: NWE Project, 2014.
As for average capacity used in the wrong direction, it stood at around 780 MW before MC (estimation for 2012, 2013, and January–May 2014).
5.3. Improving Price Convergence
The benefits of implicit auctions will be similar to those shown in Fig. 10.9 for the Spain–Portugal interconnection, where we can see what has happened in the past. The creation of the single Iberian market has facilitated price convergence between both markets, and consequently congestion rent decreased in these years as the infrastructure between the two areas improved.

Figure 10.9 Congestion rent in the Portuguese–Spanish interconnection in daily and intradaily markets (July 2007–December 2014). Source: OMIE.
These same effects will be seen on the French–Spanish border in coming years; in particular, when the new interconnection comes into operation in the coming months. From May 14, 2014 until December 31, 2014 the price was the same for 8.4% of the time in the MIBEL market (Spain and Portugal) and the French area. This figure will certainly increase when the new line on the French–Spanish border begins operation in 2015.
In an attempt to show the possible effects on prices of the new 1400 MW interconnection between France and Spain, we have made a simulation of the results for 2013 and compared them with actual prices on the MIBEL market.
The data showed that the percentage of time with price differential <1€/MWh would increase from 5.8% to 30.8%, and the percentage of time with price differential <2€/MWh would increase from 10.4% to 33.2%.
This simulation was made with the old market algorithm that was used during 2013.
5.4. Gross Welfare of Market Coupling and Interconnectors
In order to complete the benefits of MC, we analyzed efficiency in terms of social welfare. Economic efficiency should allow lowest cost producers to cover the demand in neighboring areas. An interesting study of this issue is undertaken by ACER on a yearly basis (ACER, 2013).
This study compares for 2012, “ceteris paribus” the remaining data, the possibility of trading between different price areas while considering isolated markets unable to trade with each other. Another analysis is “incremental gain” as a result of enlarging the interconnection capacity of 100 MW on each border. Both indicators are presented in Fig. 10.10.
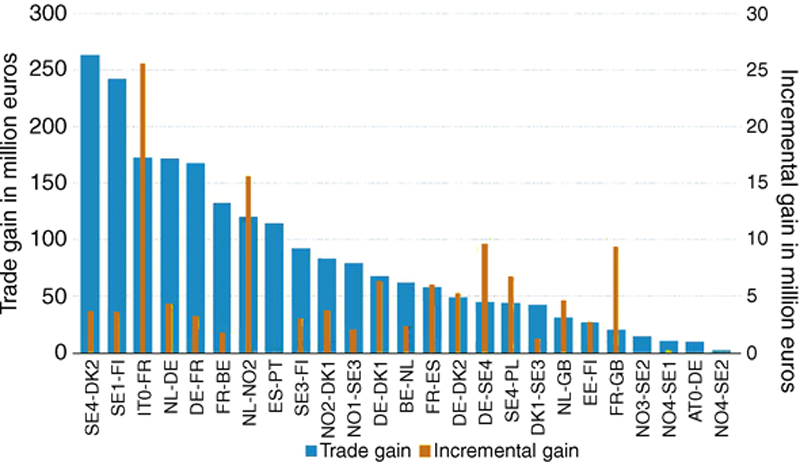
Figure 10.10 Gross welfare benefits from cross-border trade and incremental gain per border in 2012 (million euros). Source: ACER (2013).
The results of these simulations shed light on the benefits that MC has already brought to trading within the MIBEL market and also foretells the benefits that implicit auctioning with the rest of the continent will bring in terms of social welfare for both NWE and SWE areas.
In the first case, the Portugal–Spain (MIBEL) trading gain was the eighth most beneficial within Europe, estimated as it was at approximately €120 million. The France–Spain (SWE) real trading gain estimated up until 2015 was the 14th most beneficial, but it would have been the 7th most beneficial with a potential incremental gain of over €5 million (considering an increase in the size of the current interconnection of 100 MW).
Analogously, ACER also presented the results of incremental gains calculated for 2013 using the same methodology but considering the potentiality of the new PCR algorithm that is now being used to calculate European electricity prices (Fig. 10.11). The data showed that incremental gain on the France–Spain border would be close to €10 million, making it the fifth most beneficial within Europe with an increase of 100 MW in cross-border capacity. However, the Portugal–Spain border would receive the smallest benefit from an increase in capacity, which means that capacity at this border is already adequate.

Figure 10.11 Incremental gain from PCR MC in different EU interconnections. Source: ACER, Florence Forum, November 2013.
In addition to this study by ACER, power exchanges in the NWE region have been publishing a monthly report on social welfare since February 2014 (Tennet, 2014) when the MC went live. In this report they calculate the gains that could be obtained in the event there were no network constraints in the central western European (CWE) region, in light of an infinitely available trading capacity. The simulation showed that from February until July 2014, the potential gain from having no network constraints in the CWE region would have been €61.8 million.
Further studies have been done within the MIBEL market by OMIE. In this case, we have studied the price difference obtained using the interconnection with France compared with the scenario of having an isolated market. The results show that despite the interconnection with France still being very small, average improvement in price per hour is 1.7€/MWh.
6. Some thoughts about cross-border trade between the Iberian electricity market (MIBEL) and Northern Africa
It is also worth noting that the European MC project will affect all surrounding countries. Although a market-oriented reform in neighboring countries is an obvious prerequisite to potentially extending the MC mechanism to these third countries, the new reality of DA markets in Europe will have immediate consequences for them.
In the case of cross-border trade between MIBEL and Northern Africa, the current situation is as follows.
In past years electricity flowed from Spain to Morocco, leaving import capacity (Morocco > Spain) completely unused. However, export capacity has been used 100% of the time with a use ratio of 64% of the available capacity in 2012 (total export to Morocco of 4909 GWh), 67% in 2013 (total export to Morocco of 5378 GWh), and in 2014, this increased to 77% of the capacity (total export to Morocco of 5928 GWh). These amounts are the maximum import volumes the Moroccan system can currently manage.
Although this interconnection is far from being congested, imports of electricity from Spain represent around 17% of Morocco’s electricity consumption. Therefore, this is a significant percentage of total demand in this neighboring country – one that will have a more robust price reference than in the past. In other words, the more European price formation applies in electricity wholesale markets the more reliable the price will be for neighboring countries. Consequently, it will be up to them and their national energy policies to rely on more European imports or develop their own generation resources to compete with (and export to) Europe.
7. Conclusions
A competitive wholesale electricity market at the EU level will be a reality as soon as cross-border electricity transactions between different member states flow in the most economically efficient direction, maximizing the use of existing interconnections and fostering investments where needed. MC has been a key priority for European institutions and national regulatory authorities in accelerating the building of the long-awaited internal electricity market.
In this context, power exchanges and transmission system operators have worked together on the implementation of pan-European MC. This project was launched thanks to the initiative of the most relevant power exchanges in Europe (under the so-called Price-Coupling Region initiative) and now MC integrates the DA markets of 17 countries covering around 70% of European electricity demand.
Currently, the NWE and SWE regions are already fully coupled and this allows simultaneous calculation of electricity prices and cross-border flows across the regions. The direct consequences are:
• Optimization and more efficient use of existing cross-border capacities.
• Elimination of important amounts of capacity not being used in the price differential direction.
• Improvement of price convergence between different areas and a more reliable electricity price on the DA time horizon.
These benefits are already visible and will be further measured in a more precise way in the months to come.
As for neighboring countries, although it is not yet realistic to think about extending MC to them in the short term, they will benefit from a more robust price formation as MC is paving the way toward establishing (as soon as additional interconnections are built) a solid DA electricity price for Europe. It will be up to neighboring countries to increase imports or start developing their own new generation resources to compete with Europe.
..................Content has been hidden....................
You can't read the all page of ebook, please click here login for view all page.