Investing in Infrastructures: What Financial Markets Want
Alberto Ponti Pan-European Utilities Team, Societé Générale – Cross Assets Research, London
Abstract
The chapter aims at answering a simple question: What is it that makes investors want to put their money in new (existing) infrastructures? The question is simple but the answer needs to be more articulated. To this end the chapter gives first a historical perspective of listed utilities in Europe to see what lessons can be learnt, which mistakes have been made, and why investors think the way they think. The institutional investors’ market is then framed in terms of size and internal organization so as to gauge their appetite for risk as well as the limits and benefits for regulators and countries wanting to attract them. The four key conditions that any regulatory regime should have are set out in order to release the maximum benefits to consumers and the lowest burden to tax payers. Based on the European experience, conclusions for the Middle East and North African (MENA) countries are drawn. In essence, given the need for strong investments in the region, it is suggested that long-term contracts should be employed as opposed to regulated asset-based (RAB) tariffs that seem to better suit the more mature markets (for infrastructures). However, transparency and consistency of regulation should always be achieved as a prerequisite to minimizing investors’ required rate of return and hence the cost for society as a whole.
Keywords
regulated asset based (RAB)
allowed return
commodity bubble
institutional investors
political risk
…given the low interest rate environment and volatile stock markets of recent years, institutional investors are increasingly looking for new source of long-term, inflation-protected returns. Investments in real, productive assets, such as infrastructure could potentially provide the type of income which these investors require, supporting investments and driving growth.
In this chapter, we want to answer a simple question: What is it that makes investors want to put their money in new (existing) infrastructures? However simple this question might be, the answer needs to be more articulated. Hence, we have structured this chapter into four sections.
In Section 1, we give a historical perspective of the utilities sector in Europe over the past 15 years to see what lessons can be learnt, which mistakes have been made, and why investors think the way they do.
In Section 2, we frame the institutional investors’ market in terms of size and internal organization so as to gauge their appetite for risk as well as the limits and benefits for regulators and countries wanting to attract them.
In Section 3, we set out the four key conditions (or indeed minimum requirements) that any regulatory regime should have in order to release the maximum benefits to consumers and the lowest burden to tax payers.
In Section 4, based on the European experience, we draw some conclusions for the Middle East and North African (MENA) countries. In essence, given the need for strong investments in the region, we suggest long-term contracts should be employed as opposed to regulated asset-based (RAB) tariffs that seem to better suit the more mature markets (for infrastructures). However, transparency and consistency of regulation should always be achieved as a prerequisite to minimizing investors’ required rate of return and hence the cost for society as a whole.
1. The utilities sector – a historical perspective
The “real” liberalization of energy markets in Europe was finally achieved toward the beginning of the last decade thanks to implementation of a number of EU Directives.1
Before liberalization, utilities in Europe were regulated via an integrated tariff covering the costs of generation, transmission, distribution, and supply. Apart from the different services rendered unbundled, most utilities were also not listed. Utilities, as an investment class, did not really exist.
Because of the presence of the integrated tariff (which was typically adjusted by inflation on an yearly basis), fluctuation of commodity prices (chiefly oil and coal) was not a major concern. Moreover, as electricity and gas were managed in monopolistic regimes, competition was also not an issue for service providers.
But liberalization changed all this. Unbundling of networks was introduced to allow so-called third-party access (TPA). Furthermore, the gradual introduction of spot and then forward electronic exchanges for the main commodity utility use (i.e., gas and electricity) helped to introduce competition and more transparency regarding prices for consumers.
Meanwhile, utilities were being privatized such that investors finally had access to this category of stocks. However, since the end of 1999, when liberalization was introduced and privatizations launched, the definition of utilities itself changed.
Typically institutional and retail investors associate with the definition of “utilities” the concept of “safety,” “stability,” and “predictability.” Some define utilities as a “safe harbor” type of investment.
1.1. Are Utilities Safe Investments?
No, despite some considering them to be. They are not for, at least, two reasons:
1.Exposure to commodities. As already pointed out, the liberalization of power and gas markets led to electronic exchanges for these two commodities and their prices were finally visible. During the period January 2005 to July 2008 all commodity markets entered into what was then called a “commodity bubble” of unprecedented magnitude. For example, at the climax of the bubble, German 1-year forward power prices were €90/MWh whereas they are a tad above €30/MWh as we write this chapter; coal prices were then at c. $220/t whereas now they are less than $60/t.
The problem is that (Table 17.1) only c. 30% of the Utilities Index is represented by “Regulated” utilities (i.e., networks that have no exposure to commodities), whereas the vast majority of the sector (e.g., generators) do have partial or total exposure to commodities (Ponti, 2015a).
2.Governmental intervention. The second reason for utilities not being defensive, or as defensive as they typically are thought to be, relates to governmental intervention. The market adage goes that when governments are in trouble utilities are the first to be hit with new taxes (or freeze/cut in tariffs) because their assets cannot be shipped elsewhere. Typically taxing manufacturing activities will lead companies to move their factories to other countries; but utilities, for obvious reasons, cannot move their networks or power stations, hence their higher exposure to political intervention.
Table 17.1
Weights of STXE Index Constituents (in %, as at end of March 2015)
Table 17.2 shows levered raw betas for utilities in the sector index (Ponti, 2015b). Regulated and nonregulated utilities show a pretty different level of correlation with the (European) equity market. Moreover, for regulated utilities a beta of 0.65 would certainly signal that even the network companies are not as defensive as might have been thought (e.g., the Robin Hood tax2 in Italy or the tariff reforms in Spain).
Table 17.2
Levered “Raw” Beta (Daily Return March 2013 to March 2015)
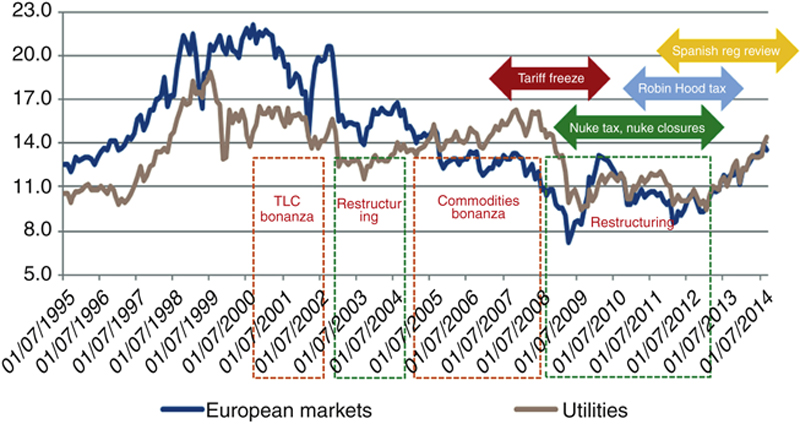
Utilities have themselves experienced a number of (short) cycles, as shown in Fig. 17.1, and these explain in our view the relative high level of the beta.
1.1.1. The Telecom Bonanza and the Multiutility Strategy
At the beginning of the last decade, most utilities benefited from what was then called the “Telecom bubble.” As telecommunication services were expanding quickly, it was thought that utilities could have used electricity cables to provide its customer base with voice and data services. In the event the technology did not work. However, most utilities bought telecom companies at the time, participated in Universal Mobile Telecommunication System (UMTS) license auctions, and invested heavily in fiber optic cables to provide fast internet access for their customers.
Generally, it was the idea that utilities “owned the customers” via electricity, gas, and water bills, and therefore had direct access to them. This led them to diversify their businesses away from the provision of traditional utility services.
1.1.2. The Restructuring Phase and the Dual-Fuel Strategy
As the telecom bubble burst most utilities sought to restructure their balance sheets by selling assets, most of which had been acquired over the years and had little to do with the gas and electricity businesses.
So the (then) recently bought/built telecom assets were being disposed of. In addition, real estate and media assets (among many others) were offloaded onto the market.
The new strategy utilities embarked on was named the “dual fuel” strategy (2003–2005) (i.e., refocusing on traditional core businesses). The process was also accompanied by a dramatic cut in investments in order to beef up company balance sheets.
1.1.3. The Commodity Bonanza
Starting in 2005 power prices in Europe went up in a straight line. This was a consequence of the introduction of the CO2 market that, all else equal, had a direct (inflationary) impact on power prices, and the already mentioned unprecedented rise in the overall commodity complex.3
Utilities were piling up cash so quickly that a new spree of acquisitions took place and a new, intense, wave of investments was launched chiefly relating to new power stations (gas and coal mainly) while new investments in nuclear were also being considered.
1.1.4. Postcommodity Bonanza
However, it all came to an abrupt halt. As it is known, the commodity bubble burst in the middle of July 2008 and the descent that ensued was far more rapid than the ascent; in a few months commodity prices erased the gains recorded over the previous 3 years.
Utilities had to adjust once more but a number of new challenges were emerging. First of all, power stations that were being decided upon and approved just a few months earlier now had to be built in a much lower power price environment and their profitability therefore was being questioned by investors and analysts.
Due to the chronic delays in realizing investments in power stations, a number of them were delayed and as a consequence came online at times of even lower power prices. In fact, after strong correction in 2009, power prices have continued to fall until this year (2015).
To make things worse, the EU introduced in 2009 new targets for the development of a renewable capacity, which amidst an already ailing demand for electricity and gas, had the effect of generating massive overcapacity in most wholesale power markets in Europe, thus depressing power prices even more.
Utilities reacted (and still are reacting) by selling assets and cutting costs. During the commodity bubble utilities expanded their presence beyond the home’s confines and those assets now had to be sold. Major efficiency programs were launched and vast redundancies plans were implemented.
1.2. From Necessary Evils to Just “Evils”
Utilities are an integral part of any society in that the services they provide fulfill many of the primary needs like heating and cooking. So, utilities are “necessary” and they are “evils” because of course these services need to be paid for. On top of this, generation of electricity is one of the main contributors to pollution but Europe now has clearly stated objectives in terms of carbon emission reductions.
In the past all governments knew they could not do without utilities, but this has started to change. Distributed generation is emerging as a valid alternative to traditional large power stations and, if this continues, utilities may not (to any extent) be necessary for the system at all.
We think this and high commodity prices have been at the origin of the large wave of taxes, tariff cuts, and changes in regulation that we have seen in Europe since the beginning of this decade.
The current level of profitability of European utilities is such that it is unlikely new taxes will be introduced, yet the value of these companies was greatly affected and so were those investors who invested in them.
1.3. Takeaways for Regulators/Policy Makers
This brief recount of the past 15 years of history in the European utility sector shows that utilities are not as stable and safe as they appear at first glance.
Investors now know this full well and therefore the risk they attach to utility businesses is not much lower than for other sectors; hence, expected returns are higher than in the past. Risks associated with a single (physical) project are likely to be far higher than those associated with investing in a utility given the lack of diversification in the former case, thus calling for even higher returns. All this, of course, translates into a higher cost of capital, and regulators/policy makers need to be aware of this.
Utilities are subject to a large number of risks like many other sectors or industries. But some risks are different from others. Operational risks, like those on commodity prices or demand growth, can be predicted or indeed hedged/diversified. Typically, investors do not have a problem with these. Where they are at odds instead is with certain risks that typically cannot be diversified such as political, regulatory, and management risks.
1.3.1. Political Risks
Even the safest part of the sector, that of regulated utilities, has not been immune from sudden materialization of risks. This was the case in Italy of the Robin Hood tax that originally intended to hit generators and commodity traders, but in August 2011 was extended to networks.4 On the day of its extension, SNAM and Terna (two transmission companies in Italy – gas and electricity, respectively) saw their share prices fall 10% in just one day.
In 2013 and 2014, three rounds of regulatory changes in Spain led, among the other things, to cuts in the return on renewable assets with cuts applied retrospectively; although these cuts are being challenged in a number of courts, they are still applied. Changes in tariffs for distribution of electricity also led to cuts in revenues of the order of hundreds of millions of euros.
Little wonder that investors hold “political risk” high on their agenda. In most cases, this is the root cause behind good or bad performances of portfolios and eventually may influence their decision to invest in a certain asset or country in the future. It goes without saying that political intervention in a regulated market is to be avoided whenever possible.
1.3.2. Regulatory Risk
Regulatory risk is indeed similar to political risk but comes from a different source (i.e., the power to impose changes on tariffs or return on assets contrary to what was initially established). However, regulatory risk takes a slightly different form and typically relates to regulator independence.
We will describe this later in the chapter, suffice it here to say that if the regulator is perceived as being just “an agency” at the service of the government, the cost of capital investors will apply to a project or an asset is likely to be higher than if the regulator is independent.
1.3.3. Management Risk
History shows that when utilities are cash rich their desire to build upon the existing asset base by way of acquisitions (external growth) or the rollout of new infrastructures (organic growth) in a number of cases has led to shareholders’ value being destroyed.
This is why investors place so much emphasis on “meeting with management.” The same principle applies to assets, projects, or companies that are not listed but for which a country wants to attract investors.
2. The role of institutional investors
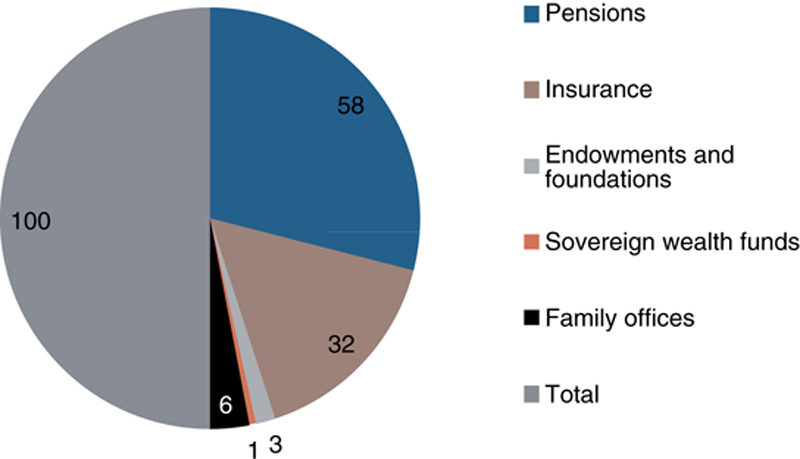
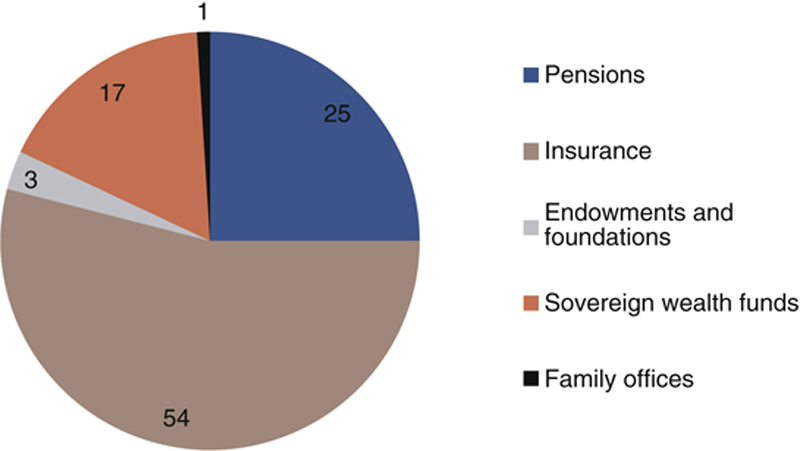
The “money management” industry is huge (World Economic Forum, 2014). It is calculated that institutional investors (IIs) manage around US$70 trillion worldwide. Of this US$25 trillion are in the Europe, Middle East, and Africa (EMEA) region (Fig. 17.2).
Figure 17.2Funds under management (US$ trillion, 2013) – geographical split.Source: SG Cross Asset Research/Equity, Oliver Wyman.
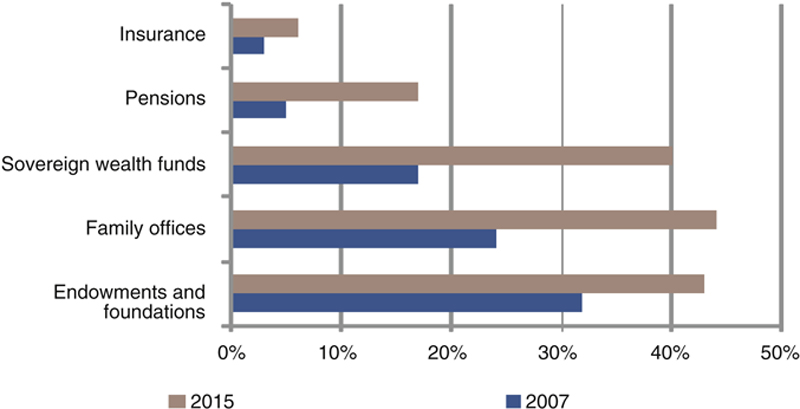
Focusing on EMEA, insurance funds (IFs) take the lion’s share with 53% of assets under management (AUM) while pension funds (PFs) are the second largest with 29% (Figs 17.3–17.5). Sovereign Wealth Funds (SWFs) and Family Offices (FOs) have a lower but growing share of the market.
Figure 17.3Americas.Source: SG Cross Asset Research/Equity, Oliver Wyman.
Figure 17.4EMEA.Source: SG Cross Asset Research/Equity, Oliver Wyman.
Figure 17.5APAC (%).Source: SG Cross Asset Research/Equity, Oliver Wyman.
The investable universe available to IIs is equally huge though (Fig. 17.6). Typically, these invest in traditional asset classes such as money market instruments, fixed income (e.g., sovereign or corporate bonds), and equity (shares). Futures and options can be seen as complementary to fixed income/equity investments or can be done in isolation. Some funds are instead specialized in commodity trading.
Figure 17.6Investable universe.Source: SG Cross Asset Research/Equity, Oliver Wyman.
However, there is an increasing appetite for alternative asset classes, and certainly investments in renewable capacity, networks, and indeed conventional generation capacity are gaining ground.
IFs overall manage c. US$31 trillion, and it is estimated they could invest in alternative assets up to US$1.9 trillion by 2015 (Fig. 17.7), PFs up to US$4.7 trillion, and SWFs up to US$2.5 trillion while FOs invest up to US$1.2 trillion. In total, including endowments and foundations (E&Fs) investments in alternative assets could reach US$11.1 trillion this year (2015).
Figure 17.7Estimated allocation to alternative assets.Source: SG Cross Asset Research/Equity, Oliver Wyman.
2.1. Decision-Making Process and Targets
The decision-making process has varied over the years and so has the structure of IIs. That IIs conduct their own research on the assets they invest in is a relatively new thing that started toward the end of the 1990s.
The process certainly accelerated after the telecom bubble burst and the number of scandals that hit the sell-side industry5 as a consequence. IIs (or the “buy-side”) invested heavily in inhouse research departments. Today, these inhouse research departments are still very much in place although most of them have been downsided, reflecting the prolonged crisis of financial markets (at least in Europe).
These research capabilities, of course, are not only used to invest in traditional assets classes, as it certainly was originally the intention, but are now also deployed for investing in alternative investments.
Within these, investments in infrastructure equity are certainly gathering pace. A number of relevant transactions have taken place in Europe over the past 2–3 years. To name just a few: Macquarie and the acquisition of Open Grid Europe (one of the leading gas transmission companies in Germany) or the recent acquisition by Credit Agricole of 10% of the French company Total Infrastructures Gaz France (TIGF) (gas transmission).
Direct investment and mergers and acquisitions (M&A) activities are normally directed at existing assets or “Brownfield projects.” Analysis of Brownfield projects requires different levels of skill depending on the type of asset traded. In all cases, analysis comprises both a top-down and a bottom-up approach.
The presence of IIs in Greenfield projects is admittedly smaller as here the execution risk in realizing a new infrastructure can be a risk too high for certain IIs to bear. The technical knowledge required (e.g., for a hydro station or an offshore wind park) is a set of competencies that usually rests with a utility not with a financial investor. The situation may change in the future although it is a struggle to foresee major developments in this sector of the market (Fig. 17.8).
Figure 17.8II’s decision-making process – an example.Source: SG Cross Asset Research/Equity; Oliver Wyman.
2.1.1. Top-Down Analysis
Top-down, investors will look at the political setting of a country, economic indicators, and demographic trends to gauge the future need for infrastructures.
The political setting is particularly relevant because investing in infrastructures that stay in place for many years is like “writing a long-term contract” with the government, the problem being governments typically do not last as long as the infrastructure itself.
A stable political and economic environment is also a precondition to granting investors a future exit, which is often needed. Even pension funds, which have a long investment horizon, may end up needing to sell assets (e.g., during a period of financial crisis).
For example, the existence of a tariff deficit in the Spanish electricity market has been one of the main investors’ concerns for many years, eventually resulting in a hefty cut of tariffs for all regulated activities and taxes for unregulated ones.
The fragile state finances of Italy, Spain, and Portugal have been at the center of investor discussions for a long time – until recently when a wave of liquidity hit the European bond markets with sovereign bond yields hitting all-time lows.
2.1.2. Bottom-Up Analysis
Bottom-up analysis typically consists in setting up a financial model for the assets to be purchased/built.
Analysis of revenues requires a detailed analysis of regulation or wholesale markets. As we explain later, the clearer and the more transparent the regulation, the easier it will be for investors to build a financial model that eventually translates into using a lower discount rate for evaluating the project or the assets.
For networks, RAB regulation is usually the one investors understand best, although all aspects of regulation (calculation of the RAB and constituents of the allowed return) need to be published (AEEGSI, 2015a,b). For deregulated generation assets, long-term purchasing power agreements (PPAs) are usually the preferred form because they ensure long-term visibility of earnings and cash flows (Table 17.3).
Table 17.3
Target Sectors
Water
Attracting all types of institutional investors, either on listed or nonlisted target companies. In the United Kingdom, private equity funds have been very active mainly with the aim of releveraging the acquired business
Gas
There is an increasing number of assets that have been listed over the years with greater emphasis on transmission rather than distribution. Some transactions have occurred involving nonlisted entities
Electricity
The same as with gas. Less M&A, save for a number of deals with municipal utilities (e.g., in Germany and Italy)
Motorways
Listed companies have been active in M&A of smaller entities or concessions
Solar
Initially a residential-led business but gradually attracting financial investors in large projects, mainly Greenfields
Airports
Infrastructure funds have an active role although most of the M&A is dealt with by large corporates
Wind
A number of transactions have occurred in Europe of late, the buyers being chiefly pension funds. M&A mainly focused on onshore assets as the operational risks of offshore are still perceived as being too high
Source: SG Cross Asset Research/Equity.
2.2. A Very Lively industry
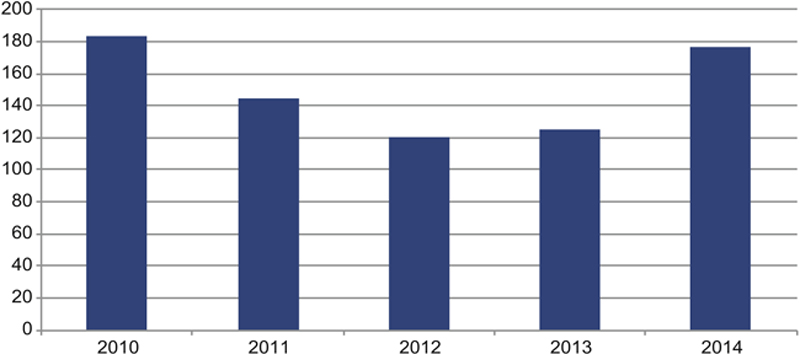
Utility assets are a very lively industry indeed where M&A is concerned. It has been calculated that the total value of M&A deals in 2015 reached US$177 billion, getting close to the peak reached in 2010, US$184 billion (Fig. 17.9).
Figure 17.9Global power and utility deal value (US$ billion) 2010–2014.Source: SG Cross Asset Research/Equity, EY – Power Transactions and Trends (EY, 2014).
Apart from integrated and other tariffs (Table 17.4) the one sector in the market where most transactions took place was in transmission and distribution (T&D) reaching US$42 billion, the Americas taking the lion’s share with a total deal value of US$25 billion.
Table 17.4
Global Power and Utility Deal Value (US$ billion) by Geography and Market Sector in 2014
Generation
Transmission and distribution
Renewables
Integrated, water, and other tariffs
Americas
14.2
25.4
21.2
35.0
Europe
8.6
10.9
8.5
20.4
Asia-Pacific
11.1
5.6
8.2
7.4
Total
33.9
41.9
37.9
62.8
Source: SG Cross Asset Research/Equity. EY – Power Transactions and Trend (EY, 2014).
It is worth noting that financial investors contributed 24% of total deal value (i.e., c. US$42 billion), thus reaching their highest participation ever in the M&A of global utilities.
2.3. Regulatory Regimes
There are many models regulators can refer to when deciding how to regulate assets under their jurisdiction. Table 17.5 summarizes some of them.
Table 17.5
Examples of Regulatory Regimes
IRR (un)levered
Return on equity
CAPs
RAB
PPAs
Typically with inflation link and no specific regulatory review
Typically with inflation link, financial costs are a passthrough
Price or revenues cap
Value of the RAB fixed but not always disclosed
Value of revenues or tolling agreement decided
IRR not always specified or officially announced
ROE often published
Typically long-term contracts
Allowed return published but not always its constituent parts
Very few details typically released
For example, wind, motorways
For example, certain electricity distribution networks
For example, water and gas/electricity networks
For example, power generation
Source: SG Cross Asset Research/Equity.
The question often asked is whether one model is better than another; a question that is difficult to answer as in most cases the answer depends on the use of a given model. However, as far as financial investors are concerned, certain models appear superior to others.
For example, a PPA model often suits corporates wishing to invest in power generation. It is not well suited to financial investors, particularly in a Greenfield project, because it would force them to meddle with the intricacies of often complex tolling agreements, which may go beyond their areas of expertise.
ROE and IRR models are often used for motorways or water concessions; financial investors are more akin to this type of regulation. However, regulated asset based (RAB) regulation is probably the one that best conjugates the need for attractive returns and long-term visibility of earnings.
In Europe, not all networks are regulated with tariffs based on RAB but in those countries where they are utilities usually enjoy higher market valuations. Moreover, where tariffs based on RAB have been in place for longer, and regulation proved to be stable, premia to RAB are higher.
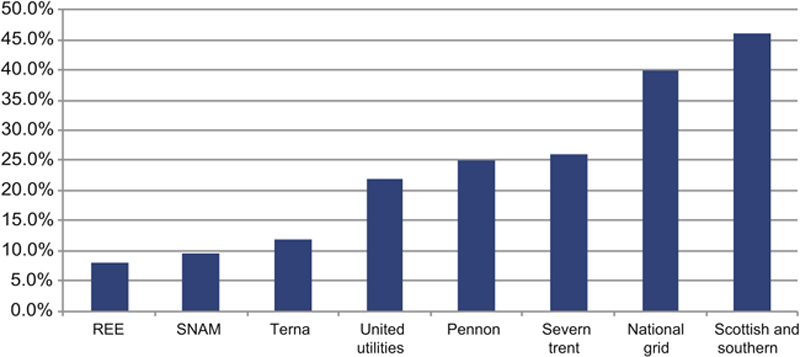
Figure 17.10 shows our estimates for premia to RAB of a sample of utilities in Europe. The United Kingdome, where RAB regulation has been in place the longest, enjoys a higher premium than in Italy. In Spain, where RAB regulation has just been introduced, the premium is lower.
Figure 17.10Premia to RAB.Source: SG Cross Asset Research/Equity.
Of course, premia to RAB are a function of many factors and not just time consistency of regulation or its age; yet investors over the years have attributed higher valuations to UK assets versus Italian assets, for example.
3. The four key conditions to stimulate investments in infrastructures
As mentioned earlier, there are a number of regulatory regimes in Europe and each has its own attractions and features. Each regime meets different investors’ expectations; it is beyond the scope of this chapter to say which regime is better or which delivers the ideal setting.
However, experience shows that any regulatory regime should at least have four characteristics. Each of these, if met, proves to be effective in attracting investments to a country’s infrastructures but ultimately proves to be beneficial to consumers too, which is the primary goal of any regulatory body. Investments in infrastructures, at the same time, allow regulators to achieve the other goal of paramount importance (i.e., security of supply).
3.1. Attractiveness
For a regulatory regime to be attractive (from the perspective of investors) returns on investments need to be aligned or above the returns of other investments (opportunity cost, risk adjusted). Typically, returns are defined using the weighted average cost of capital (WACC) formula, and it is advisable to do so as this is the main reference for financial markets.
Returns so defined need to take into account the long duration that investments in infrastructures usually require and should allow for a level of leverage that can be high (e.g., debt to total investments) of up to 60–70% (this is common practice in most European regulatory regimes), but not too high so as to endanger overall investment in the case of exogenous shocks or so high that it can affect the cost of financing via increased cost of debt or required higher equity risk premium.
3.1.1. A Common Misconception
From all the above, it could be inferred that the higher the return the easier it is to attract investments. However, experience shows that too high returns may have the opposite effect. In fact, investors will hardly be attracted by a return that appears too high if it is not justified by the economics of the project or the risk profile of the assets subject to regulation. In other words, returns have to be fair to be attractive: too high returns will leave investors with the fear of possible cuts in the future; too low returns instead discourage investors from the start.
Of course, return is not the only element of a regulatory setting, but it is the key driver of profitability investors and financial markets usually focus on. Other elements are equally important. For example, certain regulations stimulate new investments allowing a base return plus a premium and this can extend for a number of years; others define standard investment costs and if the asset operator beats the regulator assumption it keeps all (or part) of the outperformance.
3.2. Transparency
Regulatory regimes need to be transparent. This means, for example, that the constituents of the WACC formula all need to be published. Furthermore, it is advisable that the criteria used to set the parameters in the WACC formula (e.g., the beta, gearing, etc.) are also laid out in full.
For example, in some cases it is not clear how regulators estimate the beta in the WACC formula (e.g., returns regressed against what index and over what period) or what sample of comparators they use. In some other cases it is not specified whether rational and/or peer comparison is used to determine gearing levels and how the regulator sees this parameter evolving in the future.
As regulation matures in Europe, incentives to investments are also changing. In the early stages of regulation, when Europe had a strong need for investments, an incentive based on the simple rule of a premium return on top of the base return was often used. This is a rule that is well understood by investors. As mentioned earlier, provided the return is not too high, it will be perceived as sustainable, so investors will “buy into it.”
However, as markets and regulation mature, incentives are now becoming output based (as is the case of RIIO in the United Kingdom). In Italy it is being proposed that future incentives to investments will also be output based, the simple principle being that investments are remunerated at a rate that is commensurate to the actual (or estimated ex ante) benefits brought to consumers and/or the system. In this case though, it is necessary that key performance indicators (KPIs) are introduced, published, and consistently applied. It is also advisable that these KPIs are simple in their formulation and possibly allow quick and simple ex post control.
There are cases in Europe where the value of the RAB is published and its evolution over time is estimated by the regulator (e.g., in the United Kingdom and France), where the RAB is published but not its future evolution (e.g., Italy), where the RAB is not entirely recognized in existing tariffs (e.g., Portugal and Belgium), where the RAB is communicated by utilities to the market but not by the regulator (Spain), or indeed instances where the RAB is not part of the regulatory formula (e.g., Germany).
Consultations are also a central part in ensuring transparency. Through consultations, stakeholders have the opportunity to participate in the formation of a particular regulatory decision. While any regulatory decision may result in an appeal against it, a wide consultation process is likely to minimize litigation risks. A regulatory regime with a high level of litigation often results in a higher cost of capital required by investors because litigation means uncertainty in the application of tariffs and, eventually, in the returns investors expect.
3.3. Consistency
Regulatory regimes need to be applied consistently over time. If there is something that markets and investors really despise it is unexpected change. Changes can manifest themselves in many forms but typically these boil down to new taxes or changes in returns on assets.
One important caveat is that returns can indeed change provided that these changes are within the regulatory framework that is defined ex ante. For example, most regulatory regimes allow for a regulatory period that lasts for a number of years (usually 4 or 6).
At the end of the regulatory period the return and the value of the asset base are typically reestimated. This is not a problem for investors, of course, since they will be able to anticipate the changes and in some cases hedge the risks if regulation is transparent.
3.4. Independence
The structure and corporate governance of regulatory bodies in Europe varies quite substantially. In some cases the government sets the tariffs directly and the regulatory body as such does not exist. In other cases the regulatory body exists, but it only has an advisory role to the government (e.g., Spain) or it has some autonomy (e.g., France where the regulator is pretty independent in setting network tariffs but the government retains full power on generation and end customers tariffs). Other countries boast a fully independent regulator (e.g., the United Kingdom or Italy).
Ultimately, all regulators are administrative bodies, so a government will always be able to overrule a regulator’s decision with a new law. However, if the regulator is independent and is set up with a dedicated law (which also defines its powers and jurisdiction) the government may find it difficult to do so.
Independence can be defined in many ways, but policy makers should take particular care in the definition of at least a few elements in our view. First of all the prerequisites to candidates being appointed members of the board of the regulatory body should be the right mix of different skills where possible. For example, with the notable exception of the United Kingdom, representatives of financial markets are hardly ever considered possible members of any board in continental Europe.
The duration of the board is also important, and it is advisable that its renewal does not overlap with political cycles so as to keep possible interference to a minimum.
Independence also lays in a clear set of powers that are attributed to the regulator. While it remains clear that it is within the mandate of the government to set the energy policy of a country, it is equally important that implementation of that policy is left to the regulator. The regulator also needs sanctioning powers, but this is not always the case.
4. Conclusions
Investments in European utilities or European infrastructure assets are facilitated by the existence of liquid markets for their equity and debt and by a rather lively M&A market. On top of this, regulatory frameworks have been converging over the past, say, 10 years.
Initially based on the “cost-plus” notion, European regulatory frameworks have gradually developed toward RAB regulations. The latter has the benefit of defining a precise (although not always published) value for assets to be regulated, which constitutes the basis for calculating the tariffs consumers have to pay.
The return “allowed” by the regulator6 is also published and the most recent experience shows gradual alignment on this front too. For example, regulators’ betas are today more aligned than in the past or the equity risk premia (ERP) are between 4.5% and 5.5%.
Most regulators in continental Europe also define a level of operating expenses (OPEX), and utilities are allowed to recover depreciation charges via the application of tariffs charged to consumers. However, in the UK regulators are moving away from this approach toward what is called TOTal EXpenses (TOTEX), whereby utilities are given the flexibility of choosing how to allocate their expenses (i.e., charging them on their profit and loss (P&L) statements or capitalizing them in their balance sheet) in an attempt to push utilities to find the most efficient combination between the two while at the same time making them more accountable for investments in existing and new infrastructures. Recently, the Italian regulator has proposed moving to TOTEX regulation starting in 2019.
Therefore, as experience shows, RAB and then TOTEX-based regulations typically appear in mature markets after a long investment cycle has been executed, often coinciding with either a major refurbishment/upgrade of the existing infrastructures or when a substantial increase in existing capacity is planned.
4.1. The Use of Long-Term Contracts
With this in mind, RAB or TOTEX-based regulations may not be ideal in the MENA countries, and empirical evidence also suggests they are not necessary to attract investments. Instead, what is important is long-term visibility and stability of the rules set by national governments.
For example, long-term contracts are valid substitutes as the experience of many Latin American countries shows. Such countries as Brazil, Chile, or Mexico were able in the past, and still are today, to attract substantial investments from all over the world thanks to the use of long-term contracts.
Certain long-term contracts for networks define an overall amount of revenue that is earned by the developer/operator over a predefined life of the asset – updated yearly by inflation. In the case of generation, developers typically want to hedge their fuel exposure with offtake or tolling agreements, but the long-term nature of the supply contract remains the basis for building the new asset.
4.2. A Clear “Energy Policy”
Governments in MENA countries seeking financing for existing/new infrastructures would need a clear and official energy policy,7 better if substantiated in a national law. Investors, in fact, typically start their assessment of an infrastructural investment by looking at a country’s need for a specific asset (e.g., a gas pipeline or a power station), since the actual need that country has for that asset is perhaps the strongest guarantee investors have on future earnings.
4.3. Country Risk
So-called “country risk” is an unavoidable complication for investors in countries that are perceived either less politically or financially stable, or both. A typical example was that of Italy and Spain in 2011 whose 10-year bond yield spreads versus the German Bund increased more than 500 bps during the sovereign crisis of 2011–2012, and this despite the two countries being in the Eurozone.
Investors can hedge their currency risk although such hedging is usually limited to a much shorter horizon than the life of the assets, and in any case it cannot eliminate the operational and political risks an infrastructure is structurally subject to. So it is fair to assume that returns granted to investors in MENA countries will on average be higher so as to offset the higher country risk.
4.4. The Four Key Conditions
As a partial offset to country risk and other risks, the four key conditions previously mentioned should be seen as mitigating factors and this is regardless of the regulatory setting (i.e., whether they are long-term contracts, RAB tariffs, or any other regulatory regime).
As a simple rule of thumb, the more transparent the tariffs and the more independent the regulator, and the less politicians have a track record for meddling with regulation/tariffs, the lower the return required by investors for investing in a country/infrastructure.
4.5. A Typical Trade-Off and the “Usual Temptation”
Transparent regulation usually presents regulators or national administrative agencies with a trade-off.
As mentioned, the upside from transparent regulation is lower overall cost of the infrastructure to be financed. The downside is that politicians/regulators have both hands tied to the regulatory regime chosen, with little flexibility to change tariffs in due course. This, for example, may not be optimal (for them) at times when economic conditions change rapidly (for the better or worse).
For example, when tariffs are based on a published value for the allowed return (WACC) and its constituents, a change in tariffs becomes possible only if regulators/politicians explain the change with sound financial empirical evidence. Of course, they can decide to change it anyway, but the loss in reputation that would ensue could have substantial repercussions on projects yet to be financed.
The usual temptation therefore is that of withholding some of the information as to what is the basis for allowing a certain level of return so that this can be changed at any point in time.
However, reputational losses often lead to much bigger costs than the short-term benefits of deviating from an announced tariff structure. So, in conclusion, transparency and consistency in regulation are ultimately what maximizes benefits to consumers and minimizes cost to tax payers from financing new/existing infrastructures in any given country.