Chapter 13
Private Participation in Energy Infrastructure in MENA Countries: A Global Perspective
Ernesto Somma
Alessandro Rubino DISAG Department of Business and Law Studies, University of Bari Aldo Moro, Bari, Italy
Abstract
Investment in infrastructure, although historically dominated by public intervention, is experiencing a growing role via public and private partnerships (PPP). This trend traced a steady increase since the start of the privatization and liberalization process that took place in most OECD countries in the 1990s and peaked in 2012. While the study of the long list of factors that determine the attractiveness of an investment in energy infrastructure has been performed elsewhere in this book, we look at the emerging global trends in the energy, transport, and water and sewage sectors. We then narrow our overview to the energy sector, showing an interesting peculiarity both in terms of the relative regional attractiveness and the dynamics of the countries concerned. Finally, we explore the private participation in infrastructure (PPI) picture for energy investments in the Middle East and North African (MENA) countries, which are lagging behind both in relative and absolute terms. Moreover, the two countries that dominate the scene in the MENA region (Morocco and Jordan) are those that perform better in terms of a political stability score and rule of law score according to the World Bank. While further analysis will be necessary to define the relative impact of each enabling factor in the investment decision-making process, it appears evident that those two indicators are likely to determine the attractiveness of the market concerned for investment dominated by long lead times and irreversibility.
Keywords
public private partnership
investment
Middle East and North Africa
energy transition
institutional endowment
1. Introduction
The global electricity landscape is rapidly changing, creating challenges even for the most advanced nations. Consumption of electricity continues to grow, and yet over 1.3 billion people still do not have access to electricity, most of whom live in rural areas. Universal access, volatile prices for fossil fuels, and climate change make the energy sector a key priority for the global development community. Lack of available electricity hinders progress on many other development fronts, and high prices are able to dampen, if not halt, progress and innovation in large sectors of the economy.
Other chapters in the book analyzed the expected trends for energy-related supply and demand. Chapter 15 shows us that significant additional investment will be required in the near future in the region to match growing demand. A significant portion of this additional capacity will be provided by renewable energy source (RES) generation in Middle East and North African (MENA) countries (see Chapters 3, 4, and 5). We have also learned from Chapter 1 that creating the right condition to foster investment in energy infrastructures (in both generation and transport) requires the existence of a number of preconditions that need careful consideration when planning policy interventions. Chapter 14 highlights how a National Regulatory Agency could play a significant role in promoting investment in additional generation capacity, and shows a strong and positive correlation with other institutional dimensions measuring enforcement of the rule of law and of the control of corruption.
At the same time, severe budget constraints will not allow public investment alone to close the gap between growing demand and projected supply. Therefore, new business models need to be developed to allow active private sector participation, as underlined in Chapter 17. In light of the evidence collected in the literature and recalled in this book, it is useful to understand how public and private partnership (PPP) in investment is faring in countries belonging to the MENA region, and how they compare when we look at investment in the energy sector on a global scale.
We will look at this evidence by providing information on the evolution of PPP and by looking at private participation in infrastructure (PPI). Private sector participation in the provision of infrastructure services began in the early 1990s in a few pioneering countries including Argentina, Chile, Malaysia, and Mexico (Panayotou, 1998). It has since spread throughout the developing world: 137 developing countries have implemented infrastructure projects with private participation in at least one sector since 1990 (Private Participation in Infrastructure Database, 2015). Whereas governments remain the main source of infrastructure financing in developing countries, providing around 70% of the funds necessary, the private sector is also a key source, contributing 22% – well beyond the 8% provided by official development assistance.
Large deficits remain, with current investment in infrastructure meeting less than half the needs in developing countries. These deficits have motivated many governments to view private participation in the provision of infrastructure services as an integral part of their development strategy. This is particularly true with reference to the current needs and the status of the energy sector in the Mediterranean region.
The Mediterranean energy sector presents a high degree of interdependence, both for electricity and gas. Despite its long history of interaction, the Mediterranean today is a highly fragmented region that is facing unprecedented challenges in its social, economic, and political dimensions. The events connected with the so-called “Arab Spring”1 that started in 2011 are deeply connected with a process of democratization of civil societies and with the unbalanced distribution of wealth and opportunities at national and at regional levels. The region, in fact, is characterized by uneven distribution of wealth, ranging from the affluent north basin2 to areas of deep poverty and scarcity of resources, despite which the population is increasing rapidly in the south and in the east of the basin.3 Strong asymmetries in terms of socioeconomic development in the region are confirmed when we look at the distribution of gross domestic production (GDP) and the population today as well as in projections for the region. The analysis highlights a number of remarkable diverging scenarios.
South and East Mediterranean Countries (SEMCs) are expected to grow at a faster rate than North Mediterranean Countries (NMCs). Also population trends will describe a strong upward curve in countries located in the SEMCs. As underlined by Cambini and Rubino (Capter 8), this will mean that most of the population will be based in the MENA region by 2030.
This unbalanced situation has profound implications for energy balance and trade too. In fact, even at current energy availability and consumption we can observe a great disparity between north and south. While it is expected that this gap will be reduced in the coming 20 years, NMCs will still be consuming twice as much as the south on a per capita basis. All this takes on even greater emphasis when we consider that the Mediterranean region, as a whole, imports nearly half of its energy needs (over 90% for NMCs). Energy consumption, and in particular electricity demand, in the Mediterranean is closely linked to economic development and population growth. Thus, demographic trends and economic development expected in the south imply a significant increase in demand, whereas in NMCs economic maturity and weak population trends contribute to declining electricity consumption. However, despite these expected trends, regional discrepancies between NMCs and SMCs will continue.
In a situation where persisting discrepancies are expected to last for decades to come, although with a declining gap, there is certainly economic justification for the promotion and development of crossborder electricity and gas transmission infrastructures (L’Abbate et al., 2014). Crossborder interconnection is expected to play a positive and significant role in reducing the energy gap among subregional markets (Rubino, 2014). Moreover, the significant role that renewable energy generation will play in the Euro-Mediterranean region requires national electricity systems to become highly interconnected and robust to growing demand. In addition, they need to be able to accommodate the presence, in the generation mix, of large quantities of, or intermittent, wind and photovoltaic generation. According to the Mediterranean Observatory of Energy (OME) projection (Observatoire Méditerranéèn de l’Energie, 2011) over €700 billion will be needed by 2030 to ensure the additional generation required, with an additional 3000 MW of north–south interconnections in the Mediterranean basin, requiring investment of the order of €20 billion up to 2020 (Med-TSO, 2013).
Although state-level energy policies are still dominant in the energy sector, it is indisputable that MENA countries will not be able to deliver investment of this variety and size via the public budget only. Therefore, it is important at this stage to shed light on how regional markets are scoring in terms of capability to attract private investments, and their abilities to cooperate with the private sector to deliver the necessary investment required.
This chapter initially discusses how infrastructure investments are evolving worldwide; it will then look at the performance of the energy sector in the various regions. Subsequently, we look at the MENA region’s performance. This overview will allow, in the final section of this chapter, some conclusions to be drawn.
2. Global overview
The focus of this analysis is to evaluate the performance and trends of PPP in infrastructure. Infrastructure investment is considered to entail public–private participation when a public–private partnership establishes a contract “[…] for providing a public asset or service, in which the private party bears significant risk and management responsibility” (World Bank, Asian Development Bank, Inter-American Development Bank, 2014). In addition, the remuneration allowed to finance the infrastructure needs to be linked to performance, in order for the investment to qualify as a PPP. This proposed definition, adopted by the World Bank, allows inclusion in the analysis of a wide spectrum of investment projects, including new assets and services and different levels of private participation and engagement in projects. We will consider these types of investments further in the chapter.4
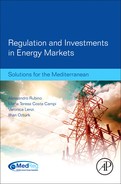
Total PPP investment5 in infrastructure6 was US$109.4 billion in 2014, compared with US$102.7 billion in 2013. The level of total investment is still below the record values of 2012, but registers a +7% increase from 2013 (Fig. 13.1).
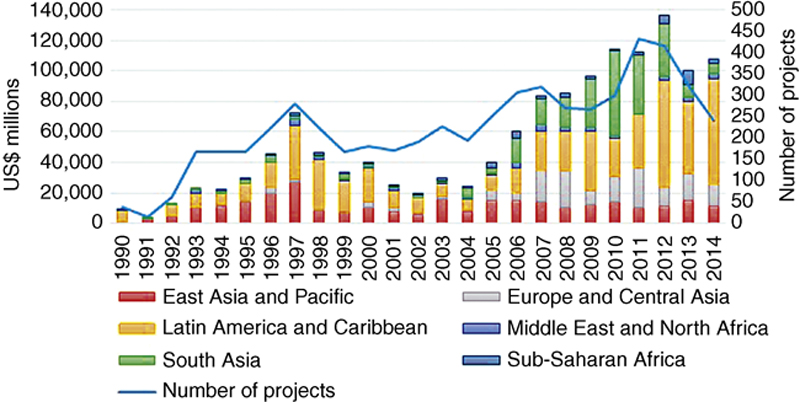
Figure 13.1 Total investment in energy, transport, and water by region (in current US$ million). Source: World Bank and PPIAF, PPI Project Database (http://ppi.worldbank.org accessed 06.08.2015).
The largest number of new projects were in energy (157), followed by transport (49), and finally water and sewerage (33). Although the energy sector had the most new projects, the sector with the greatest investment was transport, receiving US$55.2 billion, or 51% of total global investment. The energy sector accounted for US$48 billion, or 45%, and the water and sewerage sector had just above US$0.4 billion, which was 4% of total investment committed (Table 13.1).
Table 13.1
Investment Committed by Sector, 2014
| Sector | Number of projects | Average investment (US$ million) | Total investment (US$ million) | Total investment (%) |
| Energy | 157 | 30,613 | 48,063 | 45 |
| Transport | 49 | 112,802 | 55,273 | 51 |
| Water and sewerage | 33 | 12,424 | 4,100 | 4 |
| Total | 239 | 107,436 | 100 |

Source: Authors’ elaboration based on World Bank and PPIAF, PPI Project Database (http://ppi.worldbank.org accessed 07.11.2015).
When we look at performance per region, there is a significant drop in the level of investment in Sub-Saharan Africa (SSA) on a year-on-year (YoY) basis (from 9.2% to 2.5%). At a more general level, MENA countries and SSA together represent 5% of the level of global investment against 64% of Latin America and the Caribbean and, respectively, 11 and 13% of the East Asia Pacific region and Europe and Central Asia.
Of total cumulative PPI of US$107.4 billion, the ranking of regions by order of volume in 2014 was (1) Latin America and the Caribbean, (2) Europe and Central Asia, (3) East Asia and Pacific, (4) South Asia, (5) Middle East and North Africa, and (6) Sub-Saharan Africa (Table 13.2).
Table 13.2
Investment Committed by Region, 2014
| No. | Region | Total investment (US$ million) | Total (%) |
| 1 | Latin America and the Caribbean | 69,113 | 64 |
| 2 | Europe and Central Asia | 14,254 | 13 |
| 3 | East Asia and Pacific | 11,514 | 11 |
| 4 | South Asia | 6,743 | 6 |
| 5 | Middle East and North Africa | 3,302 | 3 |
| 6 | Sub-Saharan Africa | 2,510 | 2 |
| Total | 107,436 | 100 |

Source: Authors’ elaboration based on World Bank and PPIAF, PPI Project Database (http://ppi.worldbank.org accessed 07.11.2015).
In this framework, investment in MENA is slowly recovering after the complete halt registered in the region in 2011, following political turmoil during the Arab Spring. Historically, the MENA region has been unable to attract investment commitments to private infrastructure projects, representing only 3% of total PPP investment committed since 1990.7 It is extremely sensitive to political instability. If we look at private participation as a percentage of GDP (Fig. 13.2), we find that Latin American (LAC) countries are those best suited to attract private investments (1.09%), compared with the size of their economy. The small amount of private participation is striking when we look at EAP countries. Although the trend is stronger for China, it remains true throughout the rest of the region.
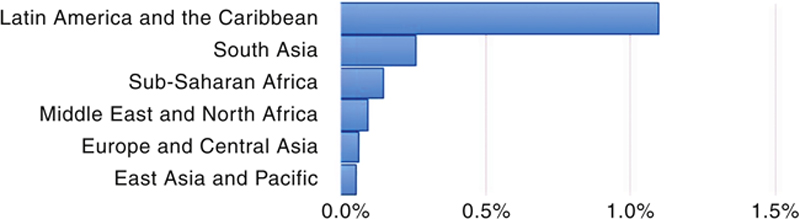
Figure 13.2 PPI as %GDP by region. Source: World Bank and PPIAF’s PPI Project Database.
The top six countries engaged in PPI in the last 3 years (2012–2014) were: (1) Brazil, (2) Turkey, (3) Peru, (4) Chile, (5) Mexico, and (6) Morocco. These six countries attracted US$141 billion of investment, representing 72% of all the PPI commitments in the developing world in the considered period. Brazil drew the highest volume of investment (US$70.6 billion), followed by Turkey (US$32.2 billion), and Peru (US$12.5 billion).
Private participation in the largest PPI market – Brazil – continued to show strength by attracting 36% of PPI in the 3-year period considered.8 The largest global investment, a US$10.0 billion airport project in Rio de Janeiro, alone accounted for 20% of global totals. Galeao International Airport, originally built in 1952, will receive another major upgrade to accommodate the upcoming 2016 Olympics in Rio de Janeiro. Sao Paulo’s Orange Line Metro was the second largest overall investment at US$3.8 billion.
Turkey was able to rank second because of a number of transport projects – the US$1.05 billion Istanbul Salipazari Cruise Port and the US$2.9 billion Third Bosporus Bridge and Northern Maramara Highway Project. Growing consumerism continues to drive investment in Turkey, and the expansion of the Salipazari passenger terminal on the west coast of the Bosporus is no exception as tourism in the country increases. In addition, energy demand in Turkey continues to rise faster than most OECD countries. With an expected annual growth rate of 4.5% from 2015 to 2030, electricity demand should grow even faster. To meet these needs, Turkey is rapidly becoming an energy transit hub between Europe, Russia, and the Middle East by being an integral part of the oil and natural gas supply movement (Fig. 13.3).
Figure 13.3 PPI in the top six countries. Source: Authors’ elaboration based on World Bank and PPIAF, PPI Project Database (http://ppi.worldbank.org accessed 07.11.2015).
3. Energy investment
While the global value of infrastructure investment is in line with levels registered in 2010 (if not describing an upward trend), the energy sector has failed to recover the level recorded in 2010, in terms of both volume and numbers of projects. This was due to the dramatic drop in investment in India and Brazil, where the energy sector is facing multiple challenges. Total number of PPI9 in the energy sector in developing countries in 2014 was 157, a 44% decrease from 2013 (Fig. 13.4). Average project size was US$306.1 million suggesting a significant increase in size compared with 2013 (US$259.2 million).

Figure 13.4 Total investment in energy by region. Source: Authors’ elaboration based on World Bank and PPIAF, PPI Project Database (http://ppi.worldbank.org accessed 07.11.2015).
Moreover, despite the reduction in investment registered in two large countries, there was significant movement in regional rankings. The traditionally strong South Asia (SA) region dropped from second to fifth place in 2013, and fourth place in 2014 as the Indian PPI market faced multiple challenges. Europe and Central Asia moved from fourth place in 2012 to second in 2013 and third in 2014 registering a more than twofold increase in overall investment levels (in 2013). This was largely fueled by a spike in Turkish PPI. MENA and the SSA region consistently registered low levels of investment throughout the period (Fig. 13.5).
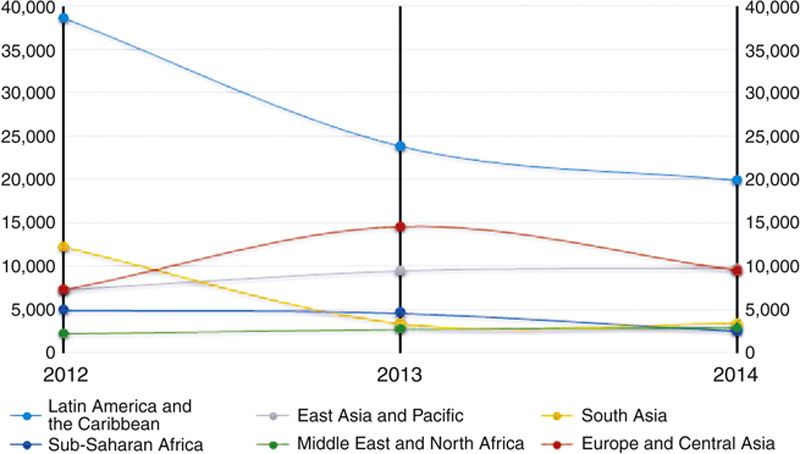
Figure 13.5 Total investment in energy by region (2012–2014). Source: Authors’ elaboration based on World Bank and PPIAF, PPI Project Database (http://ppi.worldbank.org accessed 07.11.2015).
The top six countries in PPI for energy in the period 2012–2014 were: (1) Turkey, (2) Brazil, (3) Chile, (4) Thailand, (5) Morocco, and (6) Mexico. These six countries attracted US$106 billion, representing 67% of all PPI commitments in the developing world for the energy sector. Turkey attracted the highest volume of investment (US$23 billion), followed by Brazil (US$21.7 billion) and Chile (US$9.3 billion). Thailand saw the largest energy PPI for the SA region, attracting US$5.9 billion out of a total of US$18.9 billion. There was little correlation between number of projects and total energy PPI levels, with Brazil, India, and China having the greatest number of projects and India and China occupying secondary positions for PPI levels. On the other hand, Turkey came just below China for number of projects, but had a greater average project size at US$527 million. Morocco had the largest average project size of US$1.4 billion from just four projects in the period (Table 13.3).
Table 13.3
Investment Committed by Country in the Energy Sector (2012–2014)
| Countries | 2012* | #2012 | 2013* | #2013 | 2014* | #2014 | Grand total* | Total* | Total (#) | Percentage of total |
| 1990–2014 | 2012–2014 | |||||||||
| Turkey | 2,223 | 11 | 13,246 | 20 | 7731 | 13 | 49,940 | 23,200 | 44 | 21.9 |
| Brazil | 19,312 | 34 | 220 | 35 | 2171 | 31 | 68,033 | 21,703 | 100 | 20.5 |
| Chile | 885 | 9 | 5092 | 13 | 3338 | 12 | 17,885 | 9315 | 34 | 8.8 |
| Thailand | 1,280 | 9 | 1251 | 12 | 3410 | 15 | 177,156 | 5941 | 36 | 5.6 |
| Morocco | 1,867 | 2 | 1438 | 1 | 2600 | 1 | 15,317 | 5905 | 4 | 5.6 |
| Mexico | 1,326 | 3 | 1179 | 10 | 2749 | 8 | 14,968 | 5254 | 21 | 5.0 |
| Grand total | 42,711 | 271 | 32.969 | 226 | 30,333 | 157 | 1,466,774 | 106,013 | 654 | 67.27 |

Source: Authors’ elaboration based on World Bank and PPIAF, PPI Project Database (http://ppi.worldbank.org accessed 07.11.2015).
* In US$ million.
Private participation in Turkey increased sixfold in 2013, rising from US$2.2 billion in 2012 to US$13.2 billion in 2013. This was mainly driven by Turkey’s energy privatization drive, which resulted in a series of brownfield concessions for state-owned and operated power distribution projects. This constituted four out of six projects of more than US$1 billion in size, with a total investment of US$7.2 billion. Chile also did well in 2013, attracting 380% more PPI than in 2012. On the other hand, investment in Brazil slowed dramatically, dropping 69% from US$19.3 billion in 2012 to US$220 million in 2013. A major reason for this drop was the completion of large investments in 2012, such as the US$15 billion Belo Monte mega hydro project.
There was significant investment in renewable energy in the period considered. Renewable energy investment in 2013 totaled US$21.4 billion, which comprised 38% of total PPI in the energy sector. Within this, the top three PPI regions for renewable energy were LAC (66%), followed by EAP (12%) and SSA (11%). The top five renewable energy PPI destination countries reflected the regional investment distribution, with Brazil coming in top, followed in sequence by Chile, China, South Africa, and Mexico. However, overall PPI levels in renewable energy contracted by more than half as compared with 2012 levels. While all regions experienced drops, the global decrease was largely due to a US$15 billion drop in the LAC region.
4. Regional overview – the MENA region
The MENA region moved from sixth position to fifth in 2014 increasing slightly from the prior year and comprising just 6% of global energy sector PPI at US$3 billion. Between 2012 and 2014 only Jordan and Morocco managed to commit PPI investments in energy projects for a total of US$7.7 billion (Table 13.4).
Table 13.4
Investment Committed in the MENA Region by Country in the Energy Sector (2012–2014)
| 2012* | 2013* | 2014* | Grand total (1992–2014)* | Total (2012–2014)* | |
| Morocco | 1,867 | 1,438 | 2,600 | 13,017 | 5,905 |
| Jordan | 350 | 1,102 | 371 | 2,812 | 1,823 |
| Algeria | 0 | 0 | 0 | 2,462 | 0 |
| Egypt, Arab Rep. | 0 | 0 | 0 | 1,092 | 0 |
| Tunisia | 0 | 0 | 0 | 291 | 0 |
| Total MENA | 2,217 | 2,540 | 2,971 | 19,674 | 7,728 |
| Grand total (global PPI) | 42,710 | 32,969 | 28,643 | 1,224,927 | 104,322 |

Source: Authors’ elaboration based on World Bank and PPIAF, PPI Project Database (http://ppi.worldbank.org accessed 07.11.2015).
* In US$ million.
If we look at the longer history of PPI energy investment in the region, we notice that investment in the MENA region only represents 2% of global investment in the sector, making it the worst performing region globally. Investment in the MENA region is recovering from a 15-year investment low. In 2014, two projects reached financial or contractual closure, no new projects have been operational since 2009. The number of transactions is still below 2009 levels, and is struggling to recover after the financial crisis.
Several drivers appear to dominate the energy scenario which can be broadly summarized as: (1) continued political instability in the region, (2) strong demographic growth, and (3) increased penetration of nonprogrammable renewable energy sources. These all have a number of relevant repercussions on the investment outlook in the region.
Country risk (Chapter 17), which takes into consideration, among other indicators, political unrest in the region, is likely to require a significant markup in the return required by investment remuneration in the region, in particular when characterized by long lead times. Finally, the great emphasis currently placed on investment in RES is likely to require governments to be adept at adapting the existing energy paradigm, mostly based on fossil fuel generation, to a new and diverse model, thereby showing a certain capacity to evolve to the changing needs emerging in the new energy scenario.
As discussed in Chapter 14, there is robust evidence that suggests a positive correlation between the presence of an appropriate institutional framework in each country and the level of investment realized. It is therefore not surprising that Morocco and Jordan register a (relatively) high score in terms of political stability10 (PS) and for Rule of Law11 (RoL). These two factors (see Tables 13.5 and 13.6) play a significant and positive role in providing an environment conducive to better engagement of private investments. PS signals the existence of sufficient social and political stability that, among other benefits, contributes to lowering the returns on investment required by investors (via a lower country risk). The RoL score, on the other hand, influences the growth rate of developing countries by restraining the government from intervening with ad hoc actions and offsetting private initiatives. This improves investors’ confidence about expected return on investments and provides legal protection to business activities. Morocco and Jordan register the highest scores in both indicators, and not surprisingly they are the only two countries that have been able to attract a significant number of PPP investments in energy infrastructures.
Table 13.5
Political Stability and Absence of Violence/Terrorism (2012–2014)
| 2011 | 2012 | 2013 | |
| Morocco | 2.11 | 2.04 | 2.00 |
| Jordan | 1.98 | 1.98 | 1.88 |
| MENA average | 1.71 | ||
| Tunisia | 2.13 | 1.76 | 1.59 |
| Algeria | 1.14 | 1.18 | 1.33 |
| Egypt, Arab Rep. | 1.05 | 1.04 | 0.88 |

Source: Authors’ elaboration from World Bank. WGI, Worldwide Global Indicators.
0, weak; 5, strong.
Table 13.6
Rule of Law (2012–2014)
| 2011 | 2012 | 2013 | |
| Jordan | 2.76 | 2.87 | 2.89 |
| Tunisia | 2.37 | 2.35 | 2.30 |
| MENA average | 2.31 | ||
| Morocco | 2.28 | 2.29 | 2.25 |
| Egypt, Arab Rep. | 2.10 | 2.04 | 1.90 |
| Algeria | 1.71 | 1.73 | 1.82 |

Source: Author’s elaboration from World Bank. WGI, Worldwide Global Indicators.
0, weak; 5, strong.
5. Conclusions
PPP is a relatively new feature of infrastructure investments in many low- and middle-income economies. Since 1990, a growing number of countries are experiencing increasing participation of the private sector in supporting the development and diffusion of effective infrastructure endowment. PPP can be beneficial for public service provision for at least a couple of economic reasons: first, it enhances the economic efficiency of service provision (de Bettignies and Ross, 2004) and, second, allows governments to define the characteristics of the service they need and the business model around which this service has to be provided without the need to own (entirely) the assets (Kirkpatric et al., 2006).
Theoretical studies and empirical evidence have illustrated how a number of factors coalesce to play a relevant role in determining the level and magnitude of private engagement in PPI. According to Mengistu (2013), these factors can be grouped into three main categories: (1) factors that determine governments engaging the private sector in infrastructure financing; (2) the underlying context in terms of the overall macroeconomic environment, which drives to some extent respective motivations of the public and private sectors; and (3) factors that affect the incentive and motivation of the private sector to enter into a PPP with the government.
The factor included in the first group has been discussed in other chapters of this book. The evidence collected indicates that available public budgets are not able to match the investment needs of the region (Chapter 15) and that an enhanced level of private participation in infrastructure investment is needed (Chapter 8) in most MENA countries. Chapter 1 also discussed how some of the most recent energy policy initiatives (e.g., RES targets and feed-in tariffs) have been specifically set up to encourage private participation in energy investment. Therefore, it appears that the factors inducing governments to engage the private sector in infrastructure financing are present in the MENA region and currently represent one of the main drivers in recent policy dynamics.12
The second group of factors, those that determine the general framework under which infrastructure investment takes place and define the conditions that both private and public investors need to consider, have been discussed in Chapter 17. Chapter 17 concluded that country risk is always considered when planning long-term investment. Countries that are perceived less financially stable are obliged to grant investors higher returns to offset country risk, thus increasing total investment costs.
Finally, the third group of factors, which takes into consideration those aspects considered critical by private investors, include adequate regulatory frameworks and proper enforcement of laws, independence of regulatory institutions and processes, access to credit, consumer ability to pay for services, government effectiveness and responsiveness and political stability, and favorable public opinion on private provision of infrastructure services. Chapter 14 has carefully explored the role that institutional endowment plays in favoring investment in the energy sector. It emerges that the presence of a National Regulatory Agency (NRA) determines a positive impact on investments.
In our qualitative analysis, we have turned our attention to how PPP investment evolved in low- and middle-income countries at the global level and looked for possible explanations for the observed trend. Analysis, performed looking at the data made available by the PPI Database,13 has shown that the region was able to attract most investment was Latin America and the Caribbean collecting more than 64% of the global investment in 2014. MENA countries only represented 3% of global investment in the same year. Historically, MENA countries have been unable to attract an adequate level of investment compared with the GDP level of the region. When we focus on the regional level we find out that only Morocco and Jordan have been able to attract PPP investments, with Morocco alone representing almost 6% of PPP investment in the energy sector. Moreover, the social and political unrest experienced in 2011 stopped this already weak trend, reducing the level of PPP investment in the region to zero. The region has been struggling to recover ever since.
Whereas the list of factors deemed to play a significant role in this dynamic is long, we have focused our analysis, following Mengistu (2013), on some of the dimensions that appear to be more significant when we look at the institutional endowment of recipient countries. As illustrated in Section 3, the indicators “Political Stability” and “Rule of Law” are positively correlated with the level of investment. The greater the political (and financial) stability, the lower the perceived country risk, thus the lower the return required over the investment. A high score related to the “Rule of Law” indicator implies greater certainty on the judicial and legal system, thus improving the level of contract enforcement in the country considered. The analysis performed shows significant disparity both within MENA countries and among the different regions globally. These differences yield a similar disparity in the level of investment. In this respect, our intraregional analysis shows that Jordan and Morocco are better endowed compared with other countries in the region (Algeria, Egypt, and Tunisia). When we compare the political stability score in MENA countries with that of LAC, we found that there is a persistent and increasing gap (see Fig. 13.6), which is able to partially explain the different performance observable in these two regions. MENA countries register the lowest score for political stability among the considered regions (with the sole exception of SA).

Figure 13.6 Political stability and absence of violence/terrorism (2003–2013) in MENA and LAC.
Percentile rank 0–100 indicates world ranking (0 corresponds to the lowest and 100 to the highest). Source: World Bank. WGI, Worldwide Global Indicators.
Percentile rank 0–100 indicates world ranking (0 corresponds to the lowest and 100 to the highest). Source: World Bank. WGI, Worldwide Global Indicators.
PPP is projected to play a growing role in infrastructure investment. This is particularly so in energy investment among low- and middle-income countries, as recent policy development suggests. It is a shortcut to modernizing the energy sector and provides the much-needed infrastructure. MENA countries show a significant gap in the level of PPP committed when compared with other regions globally. Among the long list of institutional dimensions predicted to play a role in this negative trend, political instability and rule of law seem to penalize MENA countries heavily. Our qualitative analysis suggests that MENA countries should look at the most successful experience worldwide to adopt international best practice and transition their institutional and regulatory dimension to become “investment friendly.” While a more stable political and institutional environment undoubtedly favors a better investment climate, the MENA region should provide investment incentives that are robust to the existing financial and institutional uncertainty, which most Mediterranean countries experience these days. While this chapter has analyzed and described a number of interesting trends taking place in the region, further work should be carried out to explore the way in which international best practices can be adapted to the specific MENA situation. In addition, the role that financial markets can play in attracting PPP in a region dominated by radical uncertainty is a promising area of analysis which could bring together the diverse interest of private and public stakeholders in the region, and should be explored thoroughly in future work.
..................Content has been hidden....................
You can't read the all page of ebook, please click here login for view all page.