
TWO
Assess the Relationship between Job Performance and Strategic Value
What Is the Automation Payoff?
Pivotal strategic goals, like agility, customer responsiveness, cost control, and innovation drive automation decisions. Often, leaders assume that automation itself produces those results, but, in fact, they depend on execution. Execution happens through the work and how it’s organized. That’s obvious, but is improving all work performance equally valuable? No. Improving certain pivotal areas of work performance has an outsized impact on strategic goals, while improving other areas of work performance has little effect.
As John Boudreau and Peter Ramstad explained in their book Beyond HR, optimizing the connection between strategic goals and work requires understanding how improved work performance actually adds value and requires investing in work performance based on that value. Unfortunately, most strategies stop short of this deep understanding about work, relying instead on generic investments in people, such as “get me the best person for every job” or “create a culture where everyone strives for their highest performance.” Such generic approaches produce generic work improvements that are not targeted to strategic goals.
The same thing applies to work automation. Automation can only achieve its strategic goals when organizations invest in where it produces the most pivotal payoffs. Those payoffs uniquely reflect the organization’s strategic goals, resources, processes, and culture. Generic work-automation investments are wasteful and potentially harmful.
So, reaping the benefits and mitigating the risks of your strategy requires addressing a new set of challenges:
- Should you automate all the work elements in an entire job? That would follow the typical idea of “robots replacing workers.”
- Should you automate the work elements that take up the most time? That would cut labor costs but might reduce productivity and increase risk if those time-consuming tasks need a human touch.
- Should you automate the work elements where humans are less capable? That would follow the idea that people should do the work that is most “human,” but mundane work may be more productive, less risky, or less costly if done by humans.
None of these simple challenges adequately captures the required trade-offs, because not all work tasks pay off in the same way. Some tasks yield a high return only when performed very well. Other tasks damage company value and brand when they fall below a certain standard. Still others create no difference in value even though they are done in many ways.
How can we more clearly understand these differences and the potential role of automation in optimizing performance? The key is to clearly define the relationship between work performance and the value it creates, the “return on improved performance” (ROIP).
Consider the job of science director in the pharmaceutical industry. If you ask, “What is the value of better job performance?” you can’t really answer the question because the job contains so many elements. One work element is research, where performance can range from moderate (being aware of leading research) to great (being a big thinker who publishes breakthrough research). Another work element is team leading, where performance can range from moderate (providing input to the team) to great (creating collaboration that transforms breakthrough ideas into unique drug formulations). The value of different tasks depends on the strategic goals. For organizations that already have lots of breakthrough ideas, the strategic goal of innovation is most improved by a research scientist who is great at team leading and moderate at research. Conversely, when an organization already has team processes that are running well, the strategic goal of innovation is most improved by a research scientist who is great at research and moderate on team leading.
ROIP applied to deconstructed work tasks reveals the payoff patterns that connect work performance to strategic goals. Let’s return to the ATM example to see how this works.
ATMs, Bank Tellers’ Work, and ROIP
Deconstructing the teller job into its tasks has revealed more options than you or your technologists imagined when you thought simply to “replace tellers with ATMs.” But now you have a new dilemma. Choosing among the options requires identifying which options are most pivotal, how they pay off, and what should be your priority.
Work performance pays off in different ways, and that varies among the tasks in a job. Some tasks create value by avoiding mistakes, but not performing beyond that standard. Verifying that an account has sufficient funds to cover a withdrawal is vital, but once you know funds are sufficient, there is little additional value in being more precise about the available amount or type of funds. Other tasks create additional value from each incremental performance improvement. When recommending additional banking services, each increment in the accuracy and enthusiasm of the teller adds additional value. For some tasks, different ways of performing don’t create a different payoff. Conversing with customers in a pleasant and friendly way can be done in many ways, but creates the same value.
If you apply the ROIP idea to your ATM dilemma, you might identify different payoff functions for the different work elements (see table 2-1).
TABLE 2-1
ROIP for bank tellers’ tasks
Work elements of the job of bank teller |
Return on improved performance (ROIP) |
Greeting and welcoming customers |
Many different ways, same value |
Receiving customer’s request for cash withdrawal |
Avoid mistakes |
Verifying that customer’s account balance contains sufficient funds |
Avoid mistakes |
Processing the withdrawal to debit the customer’s checking account |
Avoid mistakes |
Counting and giving the cash to the customer |
Avoid mistakes |
Counseling customers when account balances are insufficient to process the transaction |
Avoid mistakes; very high performance can salvage a potentially lost customer |
Engaging the customer in conversations |
Many different ways, same value |
Detecting customer’s receptivity to additional banking services |
Better performance produces incrementally more value |
Recommending and describing additional banking services |
Better performance produces incrementally more value |
Referring customer to other bank employees for further services and products |
Many different ways, same value |
Collaborating with bank product designers and process leaders to improve products and processes |
Little danger of damage from poor performance, moderate value of medium performance, very high value for exemplary inventiveness |
Automating some tasks will reduce risk, automating others will incrementally increase quality, and automating others will reduce variance that adds no value. Each type of ROIP implies a different payoff. ROIP connects your original strategic goals to actual task performance, so now your payoff analysis can be more precise.
So, ROIP is also key to optimizing strategic work automation. If we applied automation to the research scientist job, being moderately good at research means being aware of newly published findings, so an automated research alert provides the optimal payoff. Here, automation reduces the chance of missing an important publication, though it won’t increase unique breakthroughs. On the other hand, being great at research means generating unique new breakthroughs, so that outcome will require different work automation using highly advanced AI that can observe and interact with the research scientists, learning the patterns that lead to unique breakthroughs. ROIP defines the payoff from the work tasks, which determines the payoff from work automation and its contribution to strategic goals.
Four Fundamental ROIP Curves
ROIP can take many forms, but we can illustrate the power of the idea with four prototypical ROIP relationships. We use tax preparation as our example, noting that these patterns exist in virtually all work.
In figure 2-1, the vertical axis represents the value of work performance to the organization, and the horizontal axis represents the level of performance. The height of the curve shows the ROIP of a particular performance level. The ROIP curve is divided into four sections, depicting four prototype curves.
FIGURE 2-1
Step 2: Assess return on improved performance (ROIP)
ROIP for full range of potential work performance
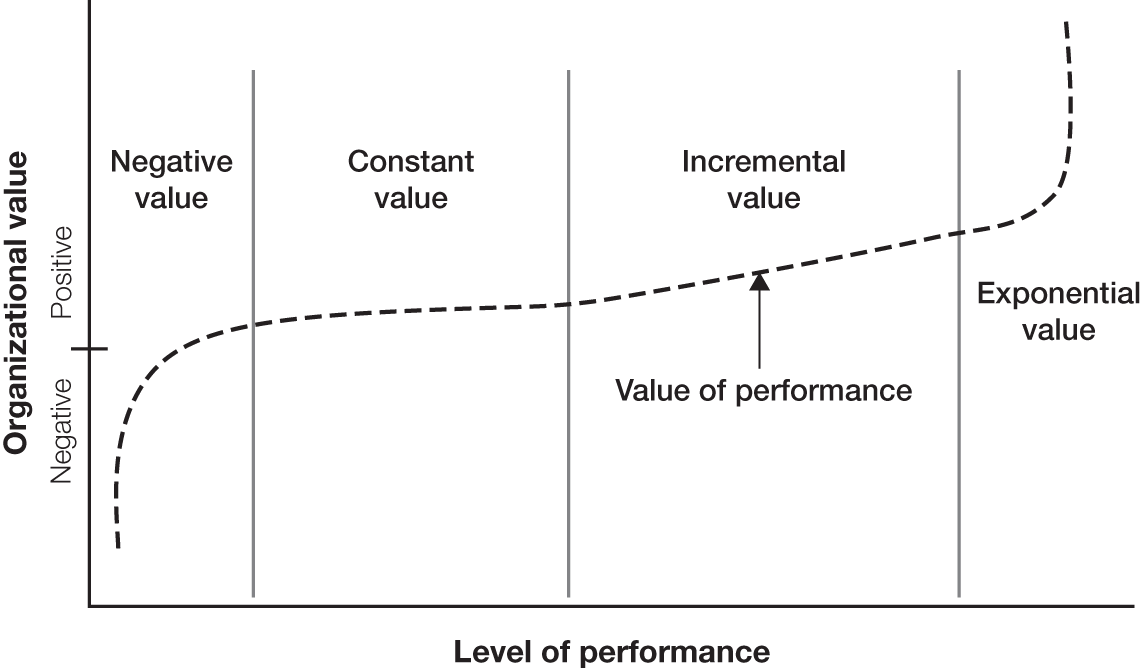
Negative Value: Reduce Mistakes
The left section of the figure shows the return on improving performance ranging from very low levels that generate negative value to the minimally acceptable level. The payoff to performance improvements in this range is from reducing the negative value. For tax form preparation, this range would include performance at a very low level, with many mistakes or missing deadlines. The top of this range is not great performance, but rather a minimally acceptable performance level that generates a small positive strategic value. For tax preparation, this would be completing forms correctly and on time.
Constant Value: Reduce Variance
The second section of the figure shows the ROIP range where better or worse performance actually makes little impact on strategic value. Performance differences in this range all produce the same value. For tax form preparation, this range would include completing the form at any time before or at the due date. Better performance (getting the form completed far ahead of the due date) adds no more value than completing the form just in time for the due date. This range could also reflect differences in accuracy that have no material effect on the tax outcome, such as the difference between calculating values to the penny when the form requires accuracy only to the nearest dollar. The constant-value curve often reflects work tasks with many ways to reach the goal, such as when different workers might assemble components in different sequences, but the final assembly is essentially identical. Or, different call-center representatives might use a customer’s name between one and three times, but that makes no difference to the customer’s satisfaction with the service.
Incremental Value: Steady Improvement
The third section of the figure shows the ROIP range where each performance improvement produces a steady incremental increase in strategic value. In tax form preparation, this ROIP range might reflect performance on the clarity and grammar quality of the summary letter that accompanies a client’s tax form. A minimally clear letter satisfies the minimum requirement, but if the letter is more clearly written and/or points out more important highlights, that is incrementally valuable to the client and the organization. Another example would be when a call-center representative upsells customers in incremental ways by suggesting additional features or faster shipping.
Exponential Value: Breakthrough Performance
Finally, the right section of the figure shows an ROIP range where improved performance increases value exponentially. This range often represents very rare or creative performance that surprises and delights a customer or disruptively improves a process. In tax form preparation, this ROIP range might reflect when a tax preparer discovers an obscure tax deduction or a very intricate method of restating income to significantly reduce owed taxes. Another example would be when an in-store retail associate or call-center representative uncovers obscure customer information that reveals an unusual need for products or services that carry a much higher value to the organization. In this performance range, breakthrough innovations have huge payoffs, such as when biochemists make rare and pivotal disease treatment discoveries or when social media productions achieve viral popularity.
ROIP and Strategic Performance on McDonald’s versus Starbucks’s Front Line
In Beyond HR, John Boudreau and Peter Ramstad suggested that the ROIP can explain how the different strategies of McDonald’s versus Starbucks show the different performance value of in-store service associates.1 Their job descriptions are similar. Both roles involve interacting with customers, taking payments, working with the team, having reliable attendance, and correctly preparing and delivering the orders. But ROIP analysis reveals hidden and important strategic differences.
McDonald’s and Starbucks choose to compete differently. McDonald’s is known for consistency and speed. Its stores automate many of the key tasks of food preparation, customer interaction, and team roles. McDonald’s has assigned numbers to its products, so associates need only press the number on the register to place the customer order and calculate the price. Indeed, McDonald’s customers often order by saying, “I’ll take a number three with a Coke and supersize it.”2 This is a good strategy for McDonald’s, because it can acquire and deploy a wide variety of talent in its stores. The work design minimizes mistakes. However, the chance for significant performance breakthroughs is also low. The ROIP range for McDonald’s associates is negative value and constant value.
Contrast this with Starbucks, where baristas are a multitalented group. The allure of Starbucks as a “third place” to hang out and work is in part predicated on interesting, extended interactions with Starbucks baristas. Some are opera singers who sing out the orders. Their styles are clearly on display and range from Gothic to country to hipster. Starbucks counts on that diversity as part of its image.3 That means it gives its baristas wide latitude to sing, joke, and kibitz with customers. The ROIP range for Starbucks is wider and includes incremental value and even exponential value, but also negative value. There is more upside performance value but also more room for error at Starbucks. That room for error is the price that Starbucks pays to gain the opportunity for breakthrough value. (See figure 2-2.)
FIGURE 2-2
ROIP analysis for frontline work: McDonald’s versus Starbucks
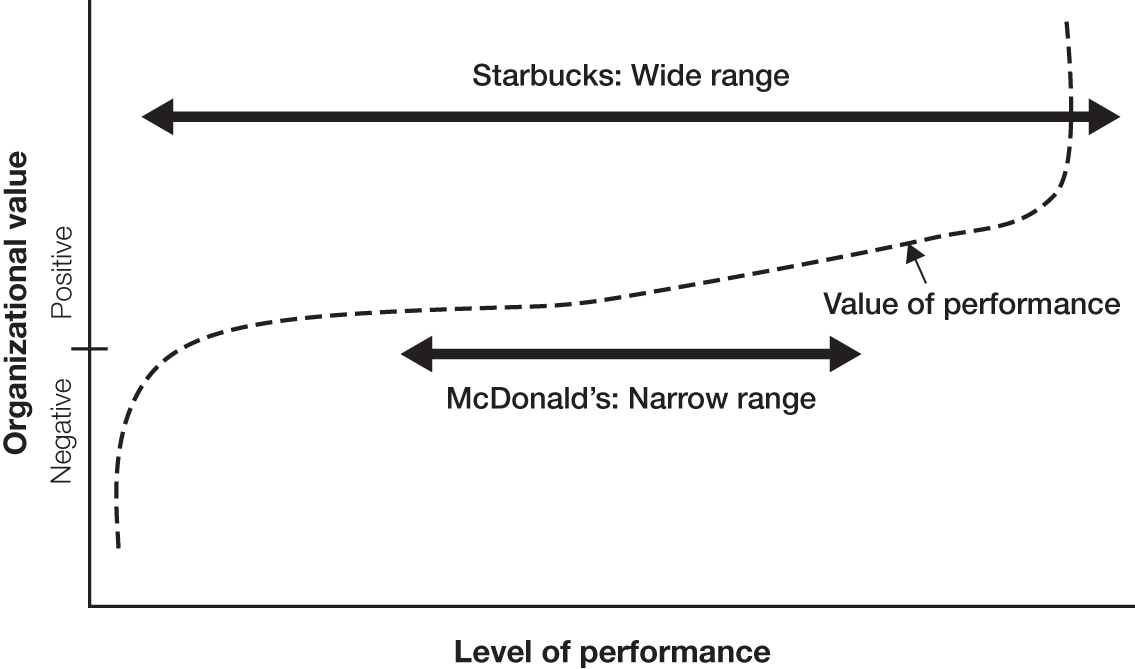
McDonald’s designs the work to maintain very tight distribution (shown by the bottom arrow in the figure). It guards against poor performance by restricting the performance range because its strategy does not require creative service on the high end of the performance scale. McDonald’s wants high performance on the job, but it defines “high” within a narrow range. Starbucks accepts and even encourages a wide array of performance levels, because the way it competes creates a high payoff from an extraordinary innovation (the top arrow in the figure). Starbucks also wants to guard against poor performance, but if it wants the high end, it may have to accept some risk of the low end. For example, some customers may be annoyed if the opera singer gets too boisterous, but Starbucks can’t simply say “no singing,” as McDonald’s can. Starbucks must allow the singer to have a chance to delight the customer.
How does this reveal different work-optimization solutions at McDonald’s versus Starbucks? McDonald’s extensively uses automated ordering systems and kitchen process automation that minimize variations, achieving the same outcome with limited choices. Starbucks also has automated ordering systems, but it must encompass a vast array of customized preferences, relying on the human associate to interpret and execute them. When Starbucks introduced systems that allowed customers to order online before they arrived at the store, some in-store customers resented that their barista was so busy filling those online orders that he or she didn’t have time to chat. Starbucks’s automation must balance efficiency and scale very differently with customer interaction. Indeed, breakthrough automation at Starbucks might use algorithms to recall and communicate customer details like favorite music, children’s names, and so on, so that associates can have immediate familiarity with repeat customers.
Applying Deconstruction and ROIP to Pilots and Flight Attendants
We use the example of airline pilots and flight attendants here and in chapter 4 to show how the steps in the framework combine. We’ll apply work deconstruction and ROIP to these jobs.
Pilots are a critical talent pool for an airline, and operating the aircraft is a vital work task. Let’s apply the ROIP analysis to that task. In figure 2-3, the task of operating the aircraft has an ROIP curve range from negative value to constant value. Operating the aircraft at a very high standard achieves full value. Higher performance will not yield additional strategic value, but having even one pilot perform at below minimum standards can have a significantly negative impact. This is the reason airlines invest in elongated career paths for pilots. For instance, it takes twenty years to move from the right seat of an Embraer 175 doing a short-haul flight to the left seat of a Boeing 747 going across the Pacific Ocean. Airlines significantly invest in cockpit technology as well as in training and development (e.g., minimum simulator hours required) in order to ensure that performance does not fall to the left of standard.
FIGURE 2-3
ROIP for pilots versus flight attendants
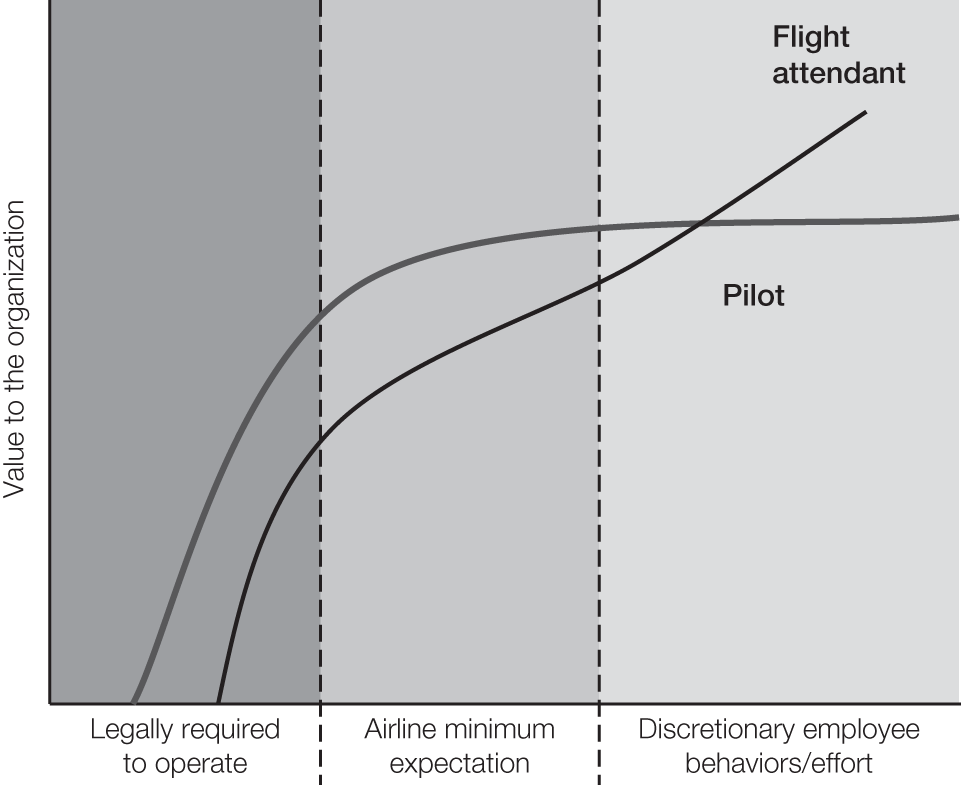
Now, compare the ROIP curve for pilots to that for flight attendants, also shown in the figure. As airlines pursue value by differentiating the customer experience—particularly for premium passengers—flight attendants are the face of the airline. Flight attendants achieving higher performance on the work element of serving passengers add great strategic value. Flight attendance performance on the work element of serving passengers includes the full ROIP range. In the middle range of performance, this is an incremental-value ROIP curve. At very high performance levels, such as delivering an unusual service that truly delights a passenger, the airline achieves the exponential-value ROIP. Flight attendant performance also includes the negative-value ROIP range at the left of the figure, because attendants must avoid mistakes. The left side of the flight attendant ROIP curve is very much like that for pilots. However, unlike pilots’ performance, the improved performance of flight attendants, beyond the minimum standard, adds significant value.
Deconstruction, ROIP, and Work Automation
Deconstructed work elements, combined with the four ROIP curves, reveal deeper insights about work and automation optimization beyond job descriptions that assume incremental ROIP for all work tasks. However, that’s just the beginning.
In the next chapter, we provide a framework that describes several categories of automation. When we apply these automation categories to the four different ROIP curves, we reveal new work automation options, and the relative value of those options is clearer. The framework reveals better and more nuanced answers to questions such as: “How can we apply the rapid advances in artificial intelligence to further enhance the impact of these roles?” “Should work automation merely reduce labor costs, or should it increase the performance of the human workers, or both?”
You can imagine lots of work automation options, such as giving flight attendants AI-enabled glasses that display the passengers’ names, preferences, and history with the airline. Imagine flight attendants wearing a version of Google Glass, through which they can access customer data and personalized preferences. No nut dishes served to Charles in 3C given his allergy, but black coffee and a predisposition for onboard duty-free purchases. Early seating meal for Sarah in 2A so she can get to sleep quickly. That might enable attendants to deliver breakthrough service along the exponential-value ROIP curve. On the left side of the performance curve, the airline might install automated sensors that detect unfastened seat belts or bags blocking the aisle, which would more reliably ensure that it meets minimum safety and legal requirements. This would reduce flight attendants’ mistakes in the negative-value ROIP range and free them to focus on highly personalized service in the exponential-value ROIP range.
For pilots, social robotics might change the negative-value range of the ROIP curve. The aircraft could become a remotely piloted collaborative robot, with in-cockpit pilots replaced by a highly skilled human pilot who oversees multiple flights from an air-traffic control center, intervening when an unforeseen event requires work beyond the capabilities of the robotic pilot. This would allow leveraging the experience and insight of the shrinking pool of skilled pilots much more efficiently. The net effect is a reduction both in labor cost (as fewer pilots are required) and in the risk of an accident.
Once you’ve done the first two steps—deconstructed jobs into tasks and analyzed the ROIP for those tasks—you can better choose among the AI options. That requires unpacking the different types of automation (chapter 3) and then combining ROIP and automation to reinvent and optimize the work (chapter 4).