
HASARD
A Model-Based Method for Quality Analysis of Software Architecture
Hong Zhu1; Qian Zhang2; Yanlong Zhang3 1 Oxford Brookes University, Oxford, UK
2 The National University of Defense Technology, Changsha, China
3 Manchester Metropolitan University, Manchester, UK
Abstract
HASARD stands for Hazard Analysis of Software ARchitectural Designs. It is a model-based method for the analysis of software quality as entailed in software architectural designs. In this method, quality hazards are systematically explored, and their causes and effects are identified. The results of hazard analysis are then transformed into a graphical quality model of the system under assessment. Queries about quality-related properties of the system can be answered automatically through a set of algorithms with the quality model as the input. Such queries include (1) the relationships between various quality attributes as manifested in the particular design, (2) the design decisions critical to a given quality concern, (3) the impacts of a given design decision to quality attributes, and (4) trade-off points in the design that balancing conflict quality concerns. The chapter will present a prototype tool called SQUARE to support the whole process of HASARD analysis. It will also report a case study with a real software system to demonstrate the feasibility and usability of the HASARD method.
Acknowledgments
The work reported in this chapter is partly supported by China High-Technology R&D Programme (863 Programme) under the grant 2002AA11607. The authors are grateful to our colleague Dr. Sue Greenwood and Mr. Qingning Huo at Oxford Brookes University, UK, for their contribution to the research and Mr. Jian Wu of the National University of Defence Technology, China, for the participation in the development of the tools.
Introduction
An extraordinarily powerful means of software engineering is architecture analysis, which enables the early prediction of a system's quality at design stage. As Bass et al. (1998, 2012) pointed out, without them, we would be reduced to building systems by choosing various structures, implementing the system, measuring the system's quality, and all along the way hoping for the best. This chapter presents such a method for analyzing software architectural designs to predict their quality.
Motivation
Software architecture is a structural model of software system at a very high level of abstraction. In this structural model, a software system is represented as a collection of components interconnected through connectors (Bass et al., 1998; Bosch, 2000; Hofmeister et al., 2000; Shaw and Garlan, 1996; Taylor et al., 2010). Being at a high level of abstraction, the implementation details of the components and the connectors are hidden, but the focus is on their characteristic features and/or the assigned functionality. For a given software system, a number of architectural models can be constructed to represent different views of the system in order to achieve different engineering purposes.
For example, to demonstrate that a system correctly satisfies its functional requirements, a conceptual view depicts the system in terms of how functions are decomposed and assigned to conceptual components and how these components are controlled and interact with each other through conceptual connectors. In order to provide instructions for further detailed design and implementation, a module view focuses on how the functionality of the system is mapped to the implementation environment, such as how the system uses the facilities and resources in the underlying software platform. It depicts software structures in terms of software modules and characterizes them with implementation-related features. In order to facilitate the construction, integration, installation, and testing of the system, a code view describes how the source code that implements the system is organized. To assist organizational management of the development process, a development view depicts a software system in terms of a repository of software artifacts that are created, modified, and managed by the programmers, maintainers, testers, etc. In order to understand the dynamic behavior of a system, a behavior view (or execution view) describes the system's execution in terms of its runtime platform elements, concurrency, communication, and the physical resources used.
One of the most important engineering purposes of software architecture is to predict the system's quality. To achieve this purpose, a quality view manifests the architectural design decisions made specifically to address quality requirements (Bass et al., 2012). Usually, a quality view builds on top of a conceptual view with the relevant elements characterized by properties that are either directly or indirectly related to quality attributes. Such properties are referred to as quality-carrying properties in the sequel. However, how to use such a quality view to predict software quality remains an open problem. This is the subject of this chapter.
Related works and open problems
The approach reported in this chapter is model-driven: that is, we will first construct a quality model based on the architectural design, then infer the quality of the system based on the model. In this section, we review the current state of art in the related areas and discuss the open problems.
Software quality models
Software quality is one of the most elusive concepts (Kitchenham and Pfleeger, 1996). A great amount of effort has been made since the 1970s to define software quality models in order to understand the concept, to measure software systems' quality, and to guide software development activities in order to improve software quality (Deissenboeck et al., 2009).
A software quality model defines a set of properties that are relevant to software quality and the relationships between them. Such a relationship can be either quantitative or qualitative. The former is the subject of research on software metrics. The latter is widely used in the literature on software quality models and often combined with metrics for the evaluation of software quality.
Existing qualitative software quality models fall into two types: hierarchical models and relational models.
A hierarchical model defines a set of aspects of software quality, then decomposes each aspect into a number of factors, which are in turn decomposed into a number of attributes, and further decomposed into several metrics. In this way, the abstract notion of software quality is characterized by a set of quality-related properties that are organized into a hierarchical structure to express the positive relationships between them. Some properties are more abstract, thus are at a higher level of the hierarchical structure. Some are more concrete, even directly measurable in a quantitative way, thus at a lower level of the hierarchy. The lower level properties have a positive contribution to the parent property. Here, a positive relationship from property A to B in a hierarchical model means that improving a software system's quality on property A implies an improvement of its quality on property B. Typical examples of such hierarchical models include the McCall model (1977), the Boehm model (1978), the ISO model (1992, 2012), the Dromey model (1995), the Bansiya-Davis model of OO software (2002), the Goeb-Lochmann model for service-oriented systems (2011), and the Franke-Kowalewski-Weise model for mobile software (2012). One of the main weaknesses of such models is that they are incapable of expressing negative relations between quality attributes.
A relational model overcomes this problem by defining a number of stereotypes of relationships between quality attributes, such as positive, negative, and neutral relations. Typically, a positive relation between two quality attributes indicates that a software system that is good on one attribute will also be good on the other. A negative relation means that a software system is good on one attribute implies that it is inevitably bad on the other. A neutral relation means that the attributes are not logically interrelated. Typical examples of relational quality models include the Perry Model (1991) and the Gillies Model (1992, 1997). There are also a number of such quality models of information systems (Zhang, 2005). Such models have significantly improved our understanding of software quality.
Both hierarchical and relational quality models can help software developers to improve software quality by providing guidelines for software development activities, such as in the elicitation of quality requirements. However, as Deissenboeck et al. (2009) pointed out, despite successes and standardization efforts, quality models do not live up to expectations and disappointed practitioners. In particular, they fail to take software structures into account (Dromey, 1995, 1996). Moreover, they are incapable of dealing with complicated relationships between quality attributes that are difficult to stereotype. They provide little help to the design of software systems, especially the architectural design. These problems will be addressed in this chapter by proposing a new quality modeling approach, that is, graphic quality modeling.
Quality analysis of software architecture
Two types of quality analysis activities are often performed at software design stage: quality assessment and evaluation and quality exploration.
• Quality assessment and evaluation aims at evaluating software architecture with regard to a set of well-defined criteria and in a set of well-defined usages or scenarios. It assesses the software to determine whether the design meets the given design goals.
• Quality exploration intends to explore the architecture in order to discover problems in a design, where the problems are normally unknown and there are no fixed criteria and/or usage scenarios.
Each of these types of quality analysis has its own uses in software development. The former has its value in software validation and verification against known users' quality requirements, while the latter manifests its importance to software engineers by discovering and predicting unintended side effects of design decisions. This is particularly important for software that has large user bases and long lifespan such as systems software and utility software, where usages are complicated and may change significantly in the future.
In the past decade, a significant progress has been made in the research on the quality analysis of software architectures. A number of methods have been advanced in the literature to evaluate and assess the quality of software architectural designs. The existing architecture quality analysis techniques and methods can be classified into two types: scenario-based and model-based.
• Scenario-based methods examine software architecture in the context of a set of scenarios, although the ways that scenarios are elicited and used vary. Among the most well-known scenario-based methods are SAAM (Bass et al., 1998, 2012; Kazman et al., 1996) and ATAM (Clements et al., 2002); see Dobrica and Niemela (2002) for a survey and Babar and Gorton (2004) for a comparison of them. They have been applied to the evaluation and assessment of architectural designs on various quality attributes, such as modifiability (Kazman et al., 1994, 1996), usability (Folmer and Bosch, 2005), and security (Alkussayer and Allen, 2010). They have a number of advantages, including the examination of software behavior in real situations and reduction of complexity of analysis through focusing on typical scenarios. Each method is suitable for one specific quality attribute/factor. They are applicable to the evaluation and assessment type of quality analysis. However, there are difficulties in building an overall picture of the system's quality, especially when there are intensive and complicated interactions between scenarios. The elicitation of a complete and representative set of scenarios is by no means a trivial task, which currently still relies on brainstorming. The result of quality analysis heavily depends on the selection of the most representative scenarios as reported in practices (see Kostelijk, 2005). It was also perceived as complicated and expensive to use in industrial context (Woods, 2012).
• Model-based methods start the analysis of software architecture with the construction of a model of the software system and then systematically deduce the quality based on the model. Typical examples of such quality analysis techniques are used in performance evaluation, reliability estimation, and security analysis. Such methods are good at exploring the unknown quality problems in a design. However, each of them also aims at a single quality attribute.
Therefore, it is highly desirable to develop a method that enables software engineers to systematically explore software architecture in order to discover and predict quality problems, especially when multiple quality attributes are involved.
Hazard analysis methods and techniques
For constructing quality models, we will adapt existing system hazard analysis methods and techniques that are widely used for safety engineering.
Hazard analysis techniques have been widely used in the development and deployment of safety critical systems. Originally, hazard analysis aims at systematically identifying, assessing, and controlling hazards before a new work process, piece of equipment, or other activity is initiated. In such a context, a hazard is a situation in which there is actual or potential danger to people or to the environment. Associated with each hazard is a risk, which is the product of the likelihood of the event occurring and its consequences. Once the hazards are identified and analyzed, safety requirements can be specified for each component. Risks can be avoided or reduced ultimately through technical design, management, and organizational means. Consequently, the safety of the system is improved (Leveson, 1995; Neumann, 1995; Storey, 1996).
Here, we adapt the methods of hazard analysis and extend the concept of hazard in order to cover all quality aspects besides safety. In our context, the word hazard has its widest meaning, which means any situation that may cause harm as designed or due to a deviation from the design decision. The more likely a hazard occurs and the more serious the consequences of the hazard, the higher the risk, and thus the more important the corresponding quality attribute is with the system in question.
There are a number of hazard analysis techniques available in the literature of safety engineering. These techniques fall into two types: (a) hazard identification techniques and methods and (b) cause-effect analysis techniques and methods. The former aims at discovering hazards systematically while the later aims to find out the causes and consequences of the hazards.
One of the most effective hazard identification technique is HAZOP (MoD, 2000), which has been adapted to the analysis of software safety. In order to deal with a wider range of quality attributes rather than just safety, in this chapter we will extend the method and interpret the technique in a wider context.
A typical example of cause-effect analysis techniques is the FMEA technique, which stands for Failure Modes and Effects Analysis. It is a mature and well-defined safety analysis technique. Its engineering principle and process are similar to what software engineers are familiar with. It progressively selects the individual components or functions within a system and investigates their possible modes of failure. It then considers possible causes for each failure mode and assesses their likely consequences. In the original FMEA, the effects of the failure of a component are first determined for the unit itself, then for the complete system. Possible remedial actions are also suggested. It requires engineers to identify the potential failure modes and to link each failure mode to its possible causes and the consequences. This process is also adapted with some minor changes in order to make it closer to what software engineers familiar with and more suitable for software engineering.
Overview of the proposed approach
This chapter presents a model-based method for exploratory quality analysis of software architecture. It aims at systematically analyzing an architectural design through building a quality model for the system under scrutiny. The method consists of the following technical elements.
• A graphical quality modeling notation. In this graphical notation, detailed and complex relationships between quality attributes and/or design decisions can be represented in the context of a given architecture design.
• A software hazard analysis method. It identifies the potential hazards in the development, operation, and maintenance of the software and the causes and effects of such hazards.
• A quality model construction technique. It transforms software hazard analysis results into a software quality model represented in the graphic notation.
• A set of algorithms for automatically analyzing quality models. They are applied in order to identify critical quality issues, trade-off design decision points, the impacts of a design decision and the factors that influence a quality attribute.
• A software tool. It supports the software hazard analysis process and the construction of graphic quality model and implements quality analysis algorithms.
The proposed quality analysis process is illustrated in Figure 5.1, which consists of the following activities.

• Hazard identification: Identifies the potential quality hazards of the software system as the consequences of the software architectural design decisions. The result is a list of quality hazards.
• Hazard cause-consequence analysis: Recognizes the cause-consequence relationships between software quality hazards and design decisions. The result is the causal relations between hazards. It may also result in additional hazards added into the list of hazards.
• Hazard classification: Associates each identified hazard to a quality attribute or a quality-carrying property that the hazard is concerned with. The result is a set of classified design hazards.
• Quality model assembling: Transforms the results of the above steps into a graphic quality model represented in the graphic quality modeling notation.
• Quality concern analysis: Analyzes the graphic quality model constructed through the above steps to infer quality concerns of the whole system, such as to find the critical design decisions that affect certain quality attributes, to recognize the trade-off points for certain conflict quality attributes, and to discover the consequences of a design decision on various quality attributes.
Organization of the chapter
The remainder of the chapter is organized as follows.
Section 5.1 is devoted to the hazard analysis of software systems. It is an adaptation and extension of the hazard analysis methods and techniques of system engineering.
Section 5.2 proposes the diagrammatic notations for graphical modeling of software quality and the technique for constructing such models from the results of hazard analysis of software architecture.
Section 5.3 presents the algorithms for the derivation of system quality features from graphic quality models.
Section 5.4 describes a software tool called SQUARE that supports the whole process of HASARD analysis and implements the quality analysis algorithms.
Section 5.5 reports a case study with the method and the tool.
Section 5.6 concludes the chapter with a comparison with related work and a discussion of future work.
5.1 Hazard Analysis of Software Architectural Designs
This section introduces the software hazard analysis method. It takes an architectural model of a software system as input. It systematically explores observable quality-related phenomena of the system and then seeks to establish the causal relationships between the phenomena. Here, a phenomenon is a property or event that is observable and concrete in the development, operation, maintenance, and evolution of the software system. The process consists of two phases: The first is the identification of design hazards. The second is the discovery of causal relationships between such hazards and design decisions. The following subsections present each of these phases.
5.1.1 Identification of design hazards
The process of hazard analysis starts with the identification of hazards. In systems engineering disciplines, one of the most effective methods of hazard identification is the so-called Hazard and Operability Studies (or HAZOP for short) (MoD, 2000). The method relies on asking and answering questions of what-if nature.
For example, in the analysis of a design of a chemical reactor, a typical what-if question is: What would happen if temperature in the reaction container is higher than the designed range? An answer to this question could be: The reactor will explode. Consequently, the engineer will identify that controlling the temperature is a critical issue in the design of the reactor.
Similarly, such what-if questions are effective to identify quality issues in a software architectural design. For example, one may ask the what-if question: What would happen if the authentication of the user is not checked before granting an access to the database? An answer could be: The integrity of the database will be broken. In such a way, the importance of authentication to system security can be identified.
The effectiveness of HAZOP method heavily depends on systematically asking such what-if questions. In HAZOP technique, this is achieved by designing and applying a set of guide words to cover all aspects of the design in question.
For example, more and less are typical examples of guide words that are applicable to a quantitative attribute in the design of a system. Applying such a guide word to a quantitative attribute prompts the engineer to ask the what-if questions of what will happen if the actual value of the quantitative attribute is more than the designed value or less than the designed value. For instance, suppose that a design decision of a chemical reactor is that the temperature of the reaction container is to be controlled in the range of 650 ± 10 °C. The what-if questions corresponding to these two guide words are:
• More: What will happen if the temperature of the reactor container is higher than 650 + 10 °C?
• Less: What will happen if the temperature of the reactor container is lower than 650 − 10 °C?
The same method can be applied to the identification of software hazards.
For example, the guide word No can be applied to a type of data produced by a component in the software system under analysis. In such a context, it means no data is produced by the component. In hazard identification, the analyst will ask the what-if question, What would happen if the data is not produced by the component?
Worth noting: First, each guide word may be applied to more than one type of design features and architectural design decisions. Its meaning depends on the type of design decisions and the context in the system. For example, the same guide word No can also be applied to an architectural component. In such a context, it means that the component is not contained in the system. For example, a dynamic link library is not available when the system is initialized at runtime. A what-if question can be asked to identify the consequences of missing such a component.
Second, not all what-if questions will lead to a hazard. However, systematically asking all such what-if questions reduces the chance of omitting serious hazards during hazard identification.
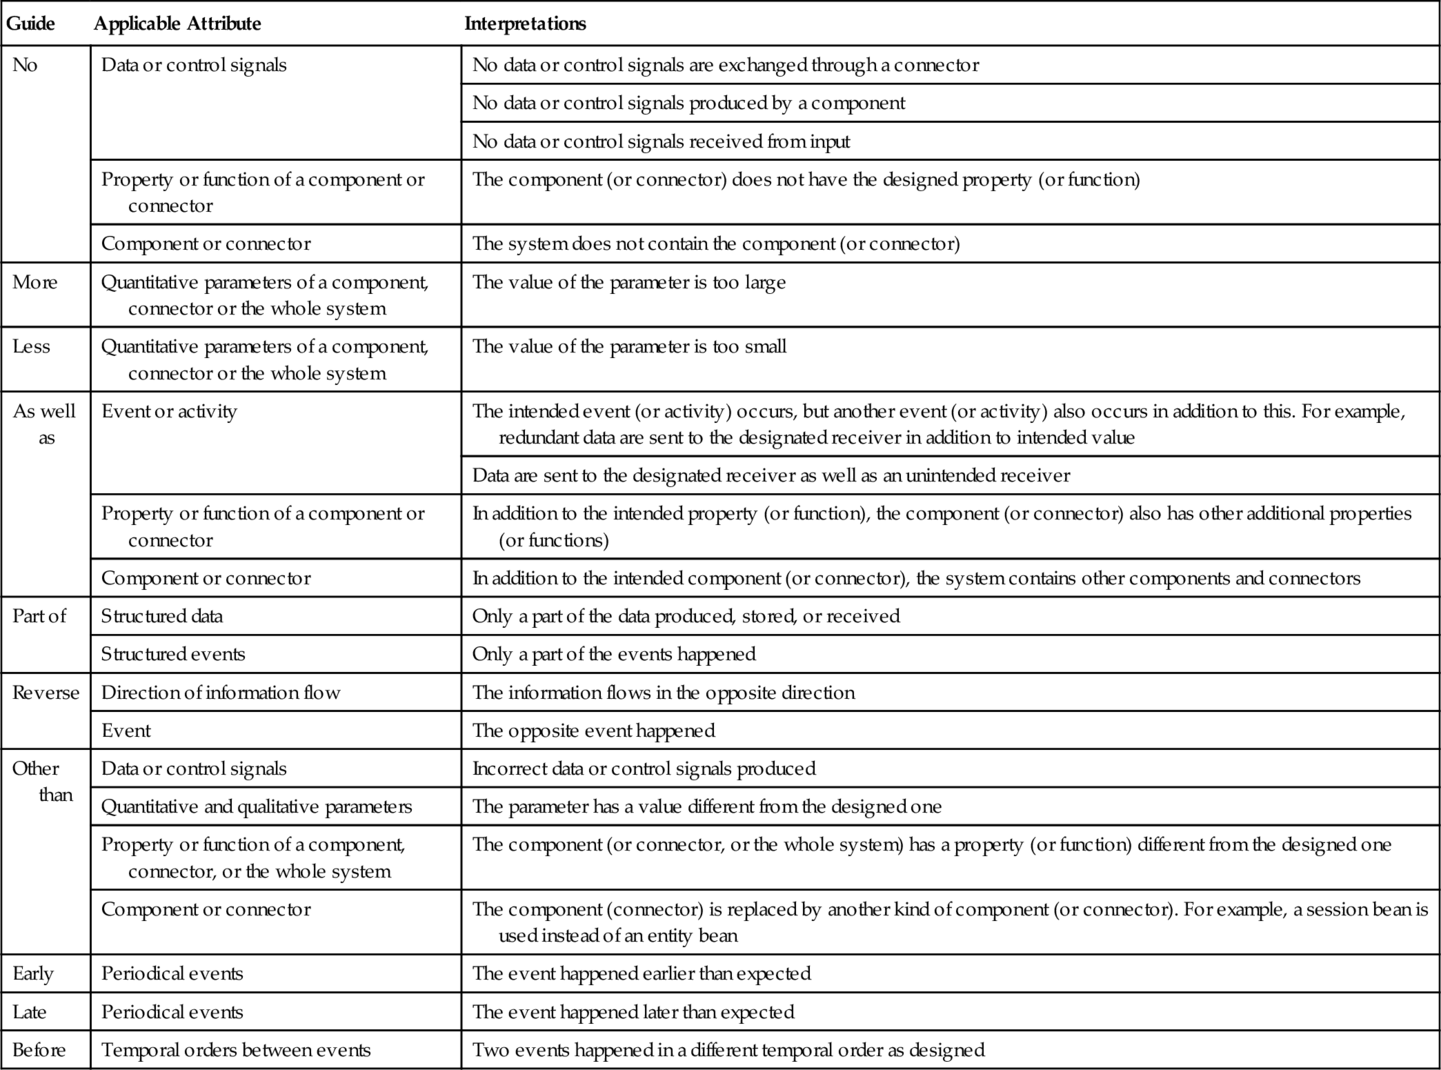
In order to identify hazards hidden in a software architectural design, we have developed a set of guide words for software engineers to systematically develop a collection of what-if questions. They are applied to the elements in an architectural design, where a design element can be a property or function assigned to a component and/or a connector, the component or connector itself, the configuration of the system, or other choices. If a deviation from the design is credible, the corresponding behavior of the element is considered as a potential hazard. Then, its causes, effects, and recommendations of the further investigation are documented. Table 5.1 lists the guide words for analyzing software architectural designs.
Table 5.1
Guide Words for Software Hazard Identification
| Guide | Applicable Attribute | Interpretations |
| No | Data or control signals | No data or control signals are exchanged through a connector |
| No data or control signals produced by a component | ||
| No data or control signals received from input | ||
| Property or function of a component or connector | The component (or connector) does not have the designed property (or function) | |
| Component or connector | The system does not contain the component (or connector) | |
| More | Quantitative parameters of a component, connector or the whole system | The value of the parameter is too large |
| Less | Quantitative parameters of a component, connector or the whole system | The value of the parameter is too small |
| As well as | Event or activity | The intended event (or activity) occurs, but another event (or activity) also occurs in addition to this. For example, redundant data are sent to the designated receiver in addition to intended value |
| Data are sent to the designated receiver as well as an unintended receiver | ||
| Property or function of a component or connector | In addition to the intended property (or function), the component (or connector) also has other additional properties (or functions) | |
| Component or connector | In addition to the intended component (or connector), the system contains other components and connectors | |
| Part of | Structured data | Only a part of the data produced, stored, or received |
| Structured events | Only a part of the events happened | |
| Reverse | Direction of information flow | The information flows in the opposite direction |
| Event | The opposite event happened | |
| Other than | Data or control signals | Incorrect data or control signals produced |
| Quantitative and qualitative parameters | The parameter has a value different from the designed one | |
| Property or function of a component, connector, or the whole system | The component (or connector, or the whole system) has a property (or function) different from the designed one | |
| Component or connector | The component (connector) is replaced by another kind of component (or connector). For example, a session bean is used instead of an entity bean | |
| Early | Periodical events | The event happened earlier than expected |
| Late | Periodical events | The event happened later than expected |
| Before | Temporal orders between events | Two events happened in a different temporal order as designed |
For example, consider the Internet connection between the client and server in a web-based application. As shown in Table 5.2, by applying these guide words, we can identify all of the most well-known hazards of web-based applications related to Internet connection.
Table 5.2
Example of HAZOP Analysis: The Application of Guide Words to Identify the Hazards of the Internet Connection Between Client and Server
| Guide | Hazard | Causes | Consequences |
| No | The Internet connection passes no messages between the client and server | Physically disconnected; Traffic jam; Software failure; Network server is down | Client cannot communicate with the server |
| More | More messages are delivered to the server than what the clients sent out: duplicated messages | Hacker's attack; Heavy traffic on the Internet caused resending packages | System clash; Overload on the server |
| Less | Fewer messages are delivered than what the server (or the client) sent out: lost messages | Discontinued Internet connection; Heavy traffic on the Internet; Software failure | Incomplete transactions; System crash; Damage the data integrity of the server (and/or client) |
| As well as | Messages are delivered to other destinations in addition to the designated receiver | Hacker's attack; Software failure | Leak of sensitive information |
| Part of | Only a part of the packets of a message is delivered to the destination client (or server) | Discontinued Internet connection; Heavy traffic on the Internet; Software failure | Software failure; Production of incorrect computation results if incompleteness is not detected |
| Other than | A message not from the client (or the server) is passed to the server (or client) | Hacker's attack; Other software system's failure | System failure; Damage the integrity of the data and the program |
| Other than | The message is in a different format | The client (or the server) is modified; Fault in the software | System failure |

A HAZOP study requires the analyst identify not only the hazards but also their effects and causes. Table 5.2 also shows the possible causes and the consequences of each hazard. Such analysis is preliminary but indicates which hazard is important and deserves further investigation in cause-consequence analysis.
5.1.2 Cause-consequence analysis
The cause-consequence analysis of hazards aims at deepening the understanding of the hazards. For example, consider the hazard more messages are delivered to the server than the clients sent out in Table 5.2. There are several possible causes of the hazard, which include that (a) the traffic on the Internet results in duplicated packages being generated, (b) a malicious source generates false request messages on purpose. A direct consequence of a large number of false request messages is a high workload on the server. This, in turn, could lead to (a) a poor performance of the system, even (b) the clash of the system. Consequently, the clients cannot get the requested services responsively. In the above analysis, we can see a sequence of hazardous phenomena or events is identified as a cause-effect chain.
The cause-consequence analysis can be performed in the backward or forward direction or a combination of both. Forward analysis extends from a hazard in search of potential effects, or the consequences. Backward analysis starts with a hazard to search for its causes.
In forward analysis, the consequences of a hazard are identified and added into the list of identified hazards until the consequence is terminal. A hazard is terminal if it does not affect any other component of the system or does not cause any other hazards/failures. In many cases, we consider a hazard as terminal simply because we are not interested in its further consequence. For example, the phenomenon that a user cannot find required information could be considered as terminal if we are not interested in what would happen afterwards. However, in certain context, what happens afterwards may become a serious problem. For example, suppose that the system stores patients' medical records. The situation that a doctor cannot find a patient's record may lead to serious consequences in the treatment of the patient.
In backward analysis, the causes of a hazard are identified and added into the list of identified hazards until the hazard is primitive. A hazard is primitive if its causes cannot be further identified without additional knowledge of the system. A hazard can also be considered as primitive if we are not interested in its causes. For example, in most cases a broken link in a HTML file can be considered as primitive. However, in a different context, we may well be interested in its causes and want to find out why the hyperlink is broken.
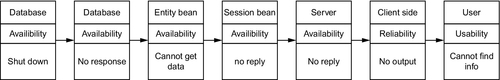
The cause-consequence relationships between hazards can be recorded in a form as the results of cause-consequence analysis. They are used for the construction of a graphic quality model at the next step. Figure 5.2 shows the structure of the form with some examples of the hazards associated to web-based applications.

Most hazards should have already been identified in the initial hazard identification step. However, some new hazards may still be discovered in cause-consequence analysis. These new hazards are then added into the hazard list and assigned with a unique identification number.
5.2 Graphical Modeling of Software Quality
In this section, we present the graphic notation for modeling software quality and the process of constructing such quality models based on hazard analysis.
5.2.1 Graphic notation of quality models
As shown in Figure 5.3, our proposed diagrammatic representation of quality models is a directed graph that consists of two principal elements: the nodes and links. Each node contains three basic elements:

1. A design element in the architectural design
2. Quality-carrying properties of the design element
3. An observable phenomenon of the property
where a design element can be a component, a connector, or any design decision. An observable phenomenon could be a positive indicator of the quality-carrying property or a negative indicator. When it is a negative indicator, the property is marked with the symbol “−.” The positive indicator is omitted, and it is the default.
It is worth noting that although there may be more than one observable phenomenon that reveals a quality-carrying property for a design element, each node can only have one such phenomenon. This is to enable different causal relationships between phenomena to be easily represented without transforming the graphic model and to enable the causal relationships to be validated separately.
The links are directed arcs between the nodes. Each link must contain an impact factor, which can be either positive or negative. A positive link from node A to node B means that the occurrence of the phenomenon of node A implies the occurrence of the phenomenon on node B. A negative link means that the occurrence of the phenomenon of node A prevents the occurrence of the phenomenon on node B. When a link has a negative impact, the arc is marked with the symbol “−” on the arrow. It is omitted when the impact factor is positive, and it is the default.
Each link can also contain an optional annotation for the reasons why the two nodes are related. This enables manual validation of the model.
Figure 5.4 shows a fragment of a quality model of web-based information systems. This fragment of a quality model shows that the usability of a web-based system is related to the correctness of the HTML files, the load and performance of the server, the sizes of HTML files, the compatibility of client-side platform, and the availability of the online helps. It described in detail how these properties are related to each other and affect whether the user can find the required information.
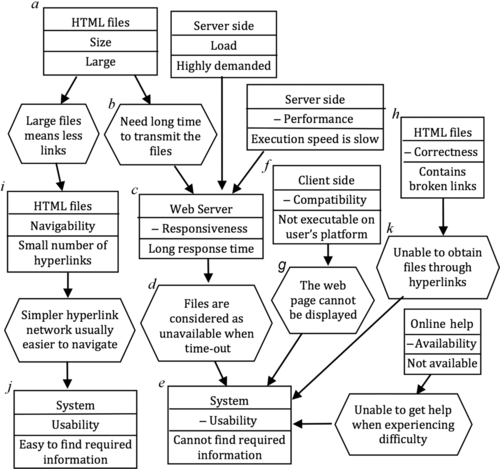
For example, if the sizes of HTML files are large as shown in node a of Figure 5.4, the Web Server will need a long time to transmit a file from the server side to the client side. This results in Web Server's long response time as link b and node c shown. When the response time is longer than the time-out setting, the browser will regard the requested file as unavailable. This implies that the required information cannot be found, which is a negative phenomenon of the system's usability. This is depicted in Figure 5.4 by link d and node e. Therefore, using this quality model, we can infer that to achieve a good usability, the software designer should make each web page a reasonable size to avoid excessive response time.
Similarly, Figure 5.4 also shows how the compatibility of the client side (node f) and the broken links in the HTML files (node h) will affect the usability of the system through links g and k, and so on.
It is worth noting that the links between the nodes must be understood as the implications of one phenomenon to another, rather than simply the relationship between two quality attributes. For example, a collection of large-sized HTML files may contain fewer hyperlinks between them than a collection of smaller-sized files that contain the same information. This makes the navigation between the files easier, which is a positive observable phenomenon of the navigability of the HTML files (node i). Consequently, the user may find it easier to locate required information, which is a positive phenomenon of system's usability (node j). Therefore, the property that the HTML files are of large size is positively related to the usability of the system. On the other hand, as discussed above, large-sized HTML files will increase the response time and in extreme cases may cause poor usability. Such complexity cannot be represented in a quality model that only relates two abstract quality attributes as in hierarchical and relational models.
5.2.2 Construction of a quality model
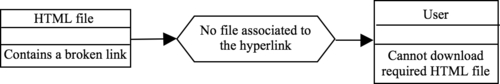
The construction of a quality model takes the information charted in the cause-consequence analysis form as input. Each hazard in the chart forms a node with the component and phenomenon as specified in the form. Each row in the chart forms a link from the node that represents the cause to the node that represents the hazard. The explanation column of the row forms the reason of the link. For example, from the first row in Figure 5.2, the nodes and the link in Figure 5.5 are generated.
The nodes and links representing the hazards and their causal relationships are thus assembled together to form a diagram. However, such a diagram generated from a hazard analysis chart may be incomplete. The property slots of the nodes need to be filled in. In some cases, the quality-carrying property is the same as the property that the guide word is applied to. Otherwise, the observable phenomenon is compared with the definitions of a set of quality attributes and quality-carrying properties. The property that a phenomenon demonstrates is, then, identified; otherwise, a new attribute or property is recognized. This property is filled into the slot of the node.
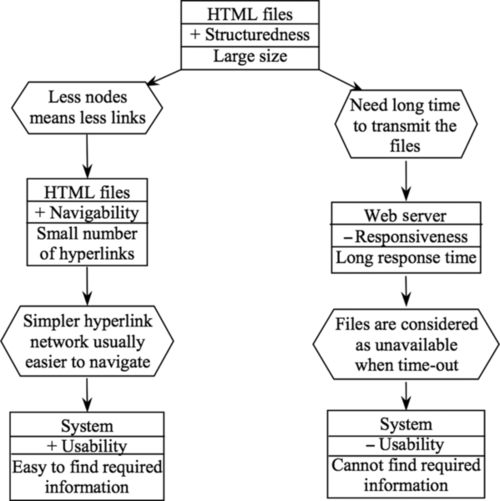
For example, An HTML file contains a broken hyperlink is a correctness issue of the HTML file, thus the quality attribute of the hazard is correctness. Server is down is a problem of the reliability of the server, or more precisely, availability. User cannot find required information is associated to the usability of the system. Therefore, from the hazard causal relationships given in Figure 5.2, we can derive the quality model shown in Figure 5.6.

5.3 Reasoning About Software Quality
In this section, we discuss various tasks of quality analysis at the software design stage and how they can be supported by automated tools. The algorithms for such tool support are presented.
5.3.1 Contribution factors of a quality attribute
In the analysis of a software architectural design, we often want to know how a quality issue is addressed. We want to know which components, connectors, or properties of the configuration are related to the quality issue and how they collectively provide the solution to meet quality requirements. The contribution factors of a quality attribute is a set of properties of the components and/or connectors or other design decisions such as the configuration of the architecture that affect the quality issue according to the design.
For example, consider the quality model given in Figure 5.4. We can derive the sub-graph shown in Figure 5.7 for the contribution factors of a server's responsiveness.

This quality analysis task can be automatically performed by using the following algorithm. Note that, given link L from node A to node B in a quality model, we say that node A is the tail of the link L and B are the head of L.
ALGORITHM A1
 INPUT:
   QualityModel (* which is < NodeList, LinkList >*);
   Component; (* the name of the component *)
   QualityAttribute; (* the quality attribute *)
 OUTPUT:
   RelatedNodeList;
   RelatedLinkList;
 BEGIN
   RelatedNodeList := { };
   RelatedLinkList := { };
   FOR each node N in NodeList DO
    IF (N's component name ==Component) AND (N's property ==QualityAttribute)
    THEN add N into RelatedNodeList;
   END_FOR;
   REPEAT
     FOR each link L in LinkList DO
      IF (L's head is in RelatedNodeList) AND (L's head is not equal to L's tail)?
      THEN
       IF L is not in RelatedLinkList
       THEN Add link L to RelatedLinkList;
       IF L's tail is not in RelatedNodeList
       THEN Add L's tail to RelatedNodeList;
      END_IF
     END_FOR;
   UNTIL no more element is added into RelatedLinkList or RelatedNodeList;
   OUTPUT RelatedLinkList and RelatedNodeList;
  END
END_ALGORITHM
Informally, Algorithm A1 searches for all the nodes and the links in the quality model that link to the nodes containing the component and its quality attribute that the user is interested in.
5.3.2 Impacts of design decisions
Another frequently asked question in the analysis of a software architectural design is What are the consequences of a design decision? In such cases, we need to find out what are the quality attributes that are affected by the design decision. Such information can also be derived from a well-constructed quality model.
For example, consider the quality model depicted in Figure 5.4. We can obtain the sub-graph shown in Figure 5.8 that represents the impacts of the quality-carrying property of HTML file's size on other quality attributes. It shows that the size of HTML files affects the navigability and responsiveness of the system, which in turn affects the usability of the whole system.
This analysis task can be automated by using the following algorithm.
ALGORITHM A2
 INPUT:
   QualityModel (* which is < NodeList, LinkList >*);
   Component (* the name of the component *),
   QualityAttribute (* the property of the component *),
 OUTPUT:
   EffectedNodeList;
   EffectedLinkList;
 BEGIN
   EffectedNodeList := { };
   FOR each node N in NodeList DO
    IF (N's component name ==Component) AND (N's property== QualityAttribute)
    THEN add N into EffectedNodeList;
   END_FOR;
   EffectedLinkList := { };
   REPEAT
    FOR each link L in LinkList DO
     IF (L's tail is in EffectedNodeList) AND (L's head is not equal to L's tail)?
     THEN
      IF L is not in EffectedLinkList THEN Add link L to EffectedLinkList;
      IF L's head is not in EffectedNodeList
      THEN Add L's head to EffectedNodeList;
     END_IF
    END_FOR;
   UNTIL no more element is added into EffectedLinkList or EffectedNodeList;
   OUTPUT EffectedLinkList and EffectedNodeList;
 END
END_ALGORITHM
Informally, Algorithm A2 searches for the subset of nodes and links in the quality model to which the node(s) with user interested component and quality are directly or indirectly linked.
5.3.3 Quality risks
A design decision may have positive as well as negative effects on a quality attribute. The negative effects may impose quality risks to the system. Therefore, it is often desirable to know what are the quality risks. This can also be derived from a quality model.
A negative effect of a design decision can be recognized by searching for the links and nodes in the quality model that have a negative effect on the quality attribute. Such a negative effect could be in one of the following two forms.
First, there is a negative indicator in a node while there is a positive influence factor on the link. In this case, if the phenomenon of the node is observed, the quality will be worse on that attribute.
Second, there is a negative influence factor on the link while there is a positive indicator on the node. In this case, the phenomenon that indicates a better value of the quality attribute will be prohibited from happening.
For example, in the quality model depicted in Figure 5.4, there is a link from the node HTML files with the property of large size to the node Web Server with a property of responsiveness. There is a positive influence factor marked on the link between the large size of HTML file and the phenomenon of long response time. This is because that the larger the HTML file size is, the longer the response time will be. Because the phenomenon of long response time is a negative indicator on usability, a large file size has a negative effect on usability. Therefore, a design decision of large file size is a risk to the quality attribute of responsiveness. The further effects of a quality risk can be identified and analyzed. In certain cases, a negative effect, such as a quality risk, is not the consequence of a single design decision. Instead, it can be the consequence of a number of design decisions. In that case, all the causes must be identified so that a better design can be made. These causes can also be automatically derived from graphic quality models using the following algorithm.
ALGORITHM A3
 INPUT:
   QualityModel (* which is < NodeList, LinkList >*).
 OUTPUT:
   RelatedNodeList;
   RelatedLinkList;
 BEGIN
   RelatedNodeList := { };
   RelatedLinkList := { };
   FOR each node N in NodeList DO
    IF (N's influence indicator is negative)
    THEN add N into RelatedNodeList;
   END_FOR;
   FOR each link L in LinkList DO
    IF (L's influence factor is negative) AND (The indicator of L's head is positive)
    THEN add L into RelatedLinkList
   END_FOT;
   OUTPUT RelatedNodeList, RelatedLinkList;
 END
END_ALGORITHM
Informally, Algorithm A3 searches for all nodes that have negative phenomena of quality attributes and implications that prevent positive quality phenomena.
5.3.4 Relationships between quality issues
An important question to be answered in quality analysis is the interrelationship between two quality issues. For example, how is a server's performance related to the system's usability? Answers to such questions can be found from the quality model by searching for all paths from a node that represents one quality issue to the nodes that represent the other quality issue. The algorithm for this purpose is given below.
ALGORITHM A4
 INPUT:
   QualityModel (* which is < NodeList, LinkList >*),
    Component1 (* the name of the first component *),
    Component2 (* the name of the second component *),
    QualityAttribute1 (* the first quality attribute *),
    QualityAttribute2 (* the second quality attribute *),
 OUTPUT:
    RelatedNodeList;
    RelatedLinkList;
 BEGIN
    RelatedNodeList := { };
    RelatedLinkList := { };
    Node1 := NULL;
    Node2 := NULL;
    TemptNodeList := { };
    TemptNode := NULL;
    FOR each node N in NodeList DO
     IF (N's component name == Component1)
      AND (N's property == QualityAttribute1)
     THEN Node1=N;
     ELSE IF (N's component name == Component2)
        AND (N's property == QualityAttribute2)
     THEN Node2 := N
     END_IF;
    END_FOR;
     Add Node1 to TemptNodeList;
    CurrentNode := Node1;
    Search(CurrentNode, Node1, Node2, QualityModel,
     TemptNodeList, RelatedLinkList, RelatedNodeList);
    OUTPUT RelatedLinkList and RelatedNodeList;
 END
END_ALGORITHM.
In Algorithm A4, the following function of depth-first search is used.
FUNCTION Search (Component, Component1, Component2, QualityModel,
       CurrentNodeList, ResultLinkList, ResultNodeList)
(* Depth-First Search *)
   BEGIN
    TemptNode=NULL;
    FOR each link L in LinkList that L's head == Component DO
     Add L's tail to CurrentNodeList;
     IF L's tail == Component2
     THEN (* Find a path and record it*)
      TemptNode := L's tail;
      REPEAT
       Add TemptNode to ResultNodeList;
       TemptNode := TemptNode's previous node of CurrentNodeList;
       Add link TemptL( whose head == TemptNode's Next node of
        CurrentNodeList AND whose tail == TemptNode)
        to ResultLinklist;
       UNTILL TemptNode == Component1;
       Remove L's tail From CurrentNodeList;
     ELSE (* Depth first *)
      Search (L's tail, Component1, Component2, QualityModel,
        CurrentNodeList, ResultLinkList, ResultNodeList);
    END_IF
   END_FOR;
   remove Component from TemptList;
 END_FUNCTION
Informally, Algorithm A4 uses a depth-first search algorithm to search for a sub-graph of the quality model that contains all paths between two input nodes.
5.3.5 Trade-off points
In many situations, a quality risk cannot be resolved without compromising on another or a number of other quality issues because these quality issues are conflicting with each other. In such cases, a trade-off between the quality attributes must be made and a balance between them must be achieved through appropriate design decisions.
For example, consider the quality model depicted in Figure 5.4. The size of HTML files positively affects the navigability of the hypertext network but negatively affects responsiveness of the web server. Therefore, navigability is in conflict with responsiveness. A trade-off between them must be made so that responsiveness is within a tolerable range while navigability is also acceptable. Such a trade-off occurs in the form of deciding on a suitable size of HTML file. In other words, HTML file size is a trade-off point.
From this example, we can see that a trade-off point is a node in the quality model that has a negative effect on one or more quality attributes and at the same time it has positive effects on one or more other quality attributes. Trade-off points can also be derived from quality models automatically. The algorithm is given below.
ALGORITHM A5
 INPUT:
   QualityModel (* which is < NodeList, LinkList >*);
 OUTPUT:
   RelatedNodeList (* the set of trade-off points *);
 BEGIN
   RelatedNodeList := { };
   TemptNodeList := result from calling A3;
   FOR each node N in TemptNodeList DO
    FOR each link L in LinkList AND ( L's head == N OR L's tail ==N) DO
     IF ( L's head !=N AND (L's head's indicator == L's influence factor))
     THEN Add L's head to RelatedNodeList;
     IF (L's tail !=N AND (L's tail's indicator == L's influence factor))
     THEN Add L's tail to RelatedNodeList;
    END_FOR
   END_FOR
   OUTPUT RelatedNodeList;
 END
END_ALGORITHM
Informally, Algorithm A5 first searches for those nodes of negative quality by employing Algorithm A3. Then for each of such nodes of negative quality, it searches for the nodes that link to this node of negative quality as well as a node of positive quality.
5.4 Support Tool SQUARE
To support the construction of quality model and the quality analysis of software architectural designs using HASARD method, we have developed a software tool called SQUARE, which stand for Software QUality and ARchitecture modeling Environment. It provides the following functions.
• Modeling software architecture in the visual notation proposed by Bass et al. (1998).
• Analyzing software architecture models using HASARD method.
• Constructing software quality models in the graphical notation.
• Reasoning about the system's quality using the quality model.
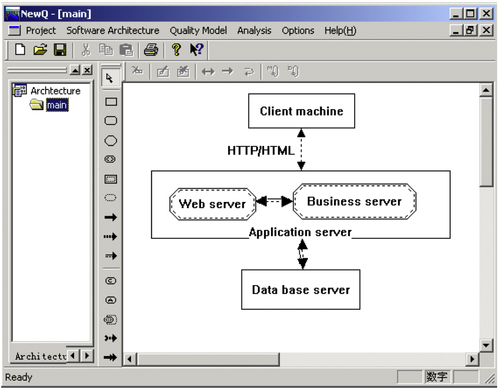
As shown in Figure 5.9, the SQUARE tool consists of the following components.

• The Architecture Model Editor supports software architecture modeling through an interactive graphical user interface and represents software architectural models in the Software Architecture Visual Notation proposed by Bass et al. (1998). Figure 5.10 shows the graphic user interface of the architectural modeling tool.
• The Hazard Analysis Tools help the developers to analyze software architecture using HASARD method. It records the analysis results and automatically transforms them into the graphic representation of quality models. It consists of three tools. The hazard identification tool helps the users to apply guide words to various attributes of components/connectors in software architecture models so that hazards are systematically identified. The cause-consequence analysis tool helps the user to identify the causal relationships between the hazards. The quality model generation tool automatically transforms the results of hazard analysis into a quality model in graphical notation. Figure 5.11 shows the interfaces of the hazard analysis tools.

• The Quality Model Editor provides an interactive graphical user interface to the users for the display and modification of software quality models.
• The Quality Model Analysis Tools automatically recognize and identify the quality features of the software designs from a quality models when invoked by the user. The results of the analysis are also displayed as a diagram in the graphical notation of software quality models.
• The Model Repository stores the information about the architecture and quality models as well as the quality analysis results to enable them to be managed within a project and reused across different development projects.
• The Project Manager provides a graphic user interface to software engineers for managing the artifacts used and generated in the quality analysis process through accesses to the Model Repository.
5.5 Case Study
A case study has been conducted with a real e-commerce application to evaluate the usability of the approach. This section reports the main results of the case study.
5.5.1 Research questions
The research question addressed in this case study is to test whether the proposed method and the supporting tools are practically applicable. This research question is decomposed into the following sub-questions:
• Can a quality model be constructed for a real-world software system with acceptable effort?
• How complex will a quality model be for a real software system?
• Can the quality model for such a real software system adequately cover the quality issues that a developer would be interested in?
• Can the automated quality analysis technique and the support tools derive the right quality predictions from the quality model?
• How well will the predictions of quality problems by the HASARD method match the real situation?
5.5.2 The object system
The object of the case study is an e-commerce system for online trading of medicine. The system is operated by the Medicine Trading Regulation Authority of the Hunan Province, P. R. China, to supply medicines to all state-owned hospitals in the province. Its main functions include (a) customer relationship management, (b) product catalogue management, (c) online trade management, (d) online auction of medicine supply bids, (e) order tracking and management, (f) advertisement release, and (g) a search engine for medicine information. The system was implemented in the J2EE technology.
The system includes the following functional components.
• Management component: Supports the management activities, including the management of information release, trading centers, users' membership, manufacture membership, permission of trade and/or production of medicine, and log information of online activities.
• Content management: Manages information contents stored, processed, and displayed by the system, such as medicine catalogues, prices, geographical information, and sales information.
• Online trading: Provides an interface and facilities for online trading activities and the links to other information contents such as catalogue, product information, and contract templates.
• Public relationship: Maintains the public relationship between the organization and its various types of customers, including sending out invitations to the public to bid on auctions, and so on.
• Order tracking: Provides the interface and facilities to track the business process of each deal.
• Communication management: Provides the secure communications facilities for sending messages and manages the mails sent and received by the system.
• Report generation: Answers queries from managers about various statistical data of the online trading and generates financial reports.
The case study was conducted after the object system was released and in operation for more than 1 year. However, the problems in the operation of the system were not revealed to the analysts involved in the case study before the predictions of the system's problems were made. This enables us to see how well the result of quality analysis matches the reality.
5.5.3 Process of the case study
The case study consists of the following activities.
• Construction of the architectural model of the system through reverse engineering. The system's design and implementation were fairly well documented. Access to the chief developers were available. The design documents as well as parts of the source code were reviewed. An architectural model of the system was constructed, which was reviewed by some of the chief developers of the system for approval of its accuracy. Figure 5.12 shows a part of the architectural model for the user management sub-system.

• Application of HASARD method and construction of quality model. The architectural model of the system was then analyzed using the HASARD method. The quality hazards of the system were identified. The cause-consequence relationships between the hazards were recognized. The information was then transformed into a quality model in the graphical notation. The quality model contains 70 nodes and 64 links between the nodes. For the sake of space, the details of the quality model are omitted in this paper.
• Analysis of the quality model. The quality model developed in the previous step was analyzed by applying the SQUARE analysis tools to identify quality risks and quality trade-off points and to derive the impacts of design decision on certain quality attributes and the contribution factors to certain quality attributes. More details are given in the next subsection.
• Validation of analysis results. The results obtained from quality analysis of the system were fed back to the developers of the e-commerce system. A workshop was run to validate whether the outcomes of the quality analysis matched the reality in the development and operation of the system. It was found that all our findings were consistent with what was observed in the operation of the system. Some of the phenomena observed in the operation of the system were satisfactorily explained through the architecture and quality models of the system. Based on the analysis results, a number of specific suggestions on the improvement of the system's architecture were made. Some of them were taken by the development team in the development of the new release of the system. Some would result in major changes of system's architecture and regrettably cannot be implemented within the budget of the new releases.
The following provides some details of the main findings of the case study to illustrate the kinds of quality issues that the method can discover and the kinds of analysis activities that the automated tools can support. Some sensitive issues related to the privacy of the system are carefully removed because the main purpose here is to validate our quality analysis method and tool.
5.5.4 Main results of quality analysis
In the case study, we discovered a number of quality issues of the system. The following are some examples.
• Critical quality attributes. One observation made during the operation of the system is that the some users complained that they cannot find desired information. In the case study, we analyzed the causes of the problem by finding the factors that affect the system's usability. The tool generated a sub-diagram that contains 35 nodes out of the 70 nodes in the quality model. This means that most components affect usability of the system. Consequently, we concluded that usability is a very sensitive quality issue in the design of the system. The generated sub-diagram provided detailed information about how properties of various components affect the usability of the whole system. Our case study provided useful guides to the developers for how to enhance the usability.
• Contribution factors of a quality attribute. Intuitively, the server's availability is of particular importance to a number of other quality attributes. To find out what are the factors that affect server's availability, we applied the tool and generated the sub-diagram shown in Figure 5.13. The diagram shows that the factors affecting this quality attribute include hardware reliability, software reliability, power supply, system security, and maintenance. Therefore, we can conclude that necessary measures must be adopted to prevent hackers from attacking the server, to ensure a reliable power supply and the stability of server's hardware and software system to avoid the server crashes, and to implement tools to enable online maintenance in order to reduce the time that the system has to be shut down for maintenance tasks.

• Relationships between two quality attributes. Our quality model can help us to understand the relationships between quality attributes. For example, the quality model demonstrated that usability of the client side is affected by performance of the web server. So we must consider carefully the system's hardware configuration and the deployment of software components onto the hardware cluster to balance the communication and computation workload according to the operation profiles.
• Quality trade-off points. In the case study, quality trade-off points were also identified. For example, we found that the size of HTML files is a trade-off point, because when the size is large, it has two different impacts on other quality attributes. On one side, the large-size HTML files will make users find necessary information through fewer clicks. On the other side, the large-size HTML files also make the response time longer. Both of these are related to the usability of the system, but one has a positive impact while the other is negative. Therefore, it is a trade-off point. Another trade-off point identified in the case study is the granularity of session beans. A small-sized session bean can only implement relatively simpler functions in comparison to larger-sized session beans. Therefore, to complete a task, smaller session beans need to invoke more methods of other beans. This results in more execution time to complete a task. Consequently, the performance of the whole system declines due to the time spent on creating instances of session beans. On the other hand, if session beans are of a larger size, to serve the same number of clients, more memory will be consumed. Therefore, the granularity of session beans is a trade-off point between the response time of the system and the consumption of the memory space.
• Impacts of a design decision. As discussed in the previous sections, the impacts of a design decision can be easily identified by using our quality model. In the case study we derived a large amount of such information. For example, if the component of Internet has heavy traffic, the usability and performance of the whole system will be affected.
• Key quality issues. In the analysis of the impact of a quality attribute, quality risk points and critical quality issues can be recognized if the quality attribute has significant impacts on a wide range of other quality attributes. For example, in the case study, we found that the impacts of database's performance are extensive as shown in the sub-diagram in Figure 5.14, which is created by the SQUARE tool. It has the impact on a wide range of issues ranging from business layer to presentation layer. So it is necessary to take some measures to avoid a vicious attack and to ensure the stability of hardware and software of the database server.
5.5.5 Conclusions of the case study
From the findings of the case study, we answer the research questions asked in Section 5.5.1 as follows.
• Can a quality model be constructed for a real-world software system with acceptable effort?
In the case study, a quality model was successfully constructed by applying the HASARD method with the assistance of the automated tool SQUARE. Two persons (one PhD student and one MSc student of Computer Science) worked on this quality model construction task. It took them 1 month, including the reverse engineering effort. These two analysts were familiar with the method and the uses of the tools before they started the case study. We can draw the conclusion that quality models for such real-work software can be constructed with reasonable efforts.
It is worth noting that the reverse engineering including the construction of the architectural model of the system takes about half of the time. It lays a foundation for the construction of the quality model. It is necessary to have a good understanding of the design of the system and to have good domain knowledge of the application. Hazard analysis of a design heavily depends on such knowledge as well as the knowledge about how the software system operates.
• How complex will a quality model be for a real-world software system?
The quality model of the system consists of 70 nodes, which is the largest and the most complicated quality model that we have ever seen in the literature. However, we found that the model is readable. The developers of the system validated the model by checking the information contained in each node and link. It is worth noting that we believe that a quality model of such a scale cannot be constructed without a structured method. Our HASARD method is capable of handling such a complexity and scale due to the structured approach based on hazard analysis techniques and the tool support.
• Can the quality model for such a real-world software system adequately cover the quality issues that a developer would be interested in?
Our case study found that the quality model adequately covered all quality attributes in existing quality models. Quantitative analysis of the quality issues were not covered because the original requirements and design document do not contain such information. Whether the proposed method can deal with quality issues quantitatively remains an open question that is not tested by the case study. It is one of the main limitations of the case study.
• Can the automated quality analysis technique and the support tool derive the right quality concerns from the quality model?
As reported in the previous subsection, the tool SQUARE was used to derive the quality concerns for each type of the quality concerns discussed in Section 5.3 and produced meaningful output. The use of SQUARE tool to derive quality concerns after the construction of the quality model took little effort, much less than 1 week by two analysts. For each query input to the tool, SQUARE responded within 1 s. The main time that the analysts spent on is reading and interpreting the output.
• How well do the predictions of quality problems by the HASARD method match the real situation?
The main findings reported in the previous subsection were all checked by the developers of the system. All these findings were confirmed and agreed upon by the development team, who are also responsible for the maintenance of the e-commerce system. Note that the quality problems of the system in the operation were unknown to the analysts before the predictions were made. Therefore, we can conclude from the case study that the predictions made by analyzing the quality model by employing our method were correct.
During the validation workshop of the case study, the development team were also asked if they had observed any quality problems in the operation of the system that were not predicted by the analysts. They answer was negative. Therefore, we can conclude that the predictions were also precise in the sense there no serious issues were missed in the quality analysis.
5.6 Conclusion
In this section, we conclude the chapter with a comparison of our approach with related work and a discussion of the limitations and open problems that deserve further research.
5.6.1 Comparison with related work
The work reported in this chapter is related to three groups of research: (a) software quality models, (b) hazard analysis methods and techniques, and (c) software architecture evaluation and assessment. The following subsections compare our approach to the related work in these three areas, respectively.
5.6.1.1 Software quality models
The development of software quality models can be backdated to the 1970s such as the Boehm model (1978) and the McCall model (1977). Research on traditional quality models has been carried out in more recent years. Al-qutaish (2010) studied five hierarchical quality models, which are the McCall model, the Boehm model, the Dromey model, the FURPS model (Grady, 1992), and the ISO 9126 model. He compared the structure as well as the coverage of quality attributes in these models. Kayed et al. (2009) applied ontology extraction and analysis techniques to the definitions of software product quality attributes. They studied 67 most commonly discussed software product quality attributes and concluded that there is a lack of consensus on the concepts and terminologies used in this field.
The weaknesses of such quality models discussed in section “Related works and open problems” have been addressed successfully in our graphical quality modeling approach. In particular, graphic quality models make full use of the knowledge of the system's structure, where a node in the quality model associates an architectural design element, including the components, connectors, and configuration features, with an observable phenomenon of its quality-carrying property. The complicated relationships between various quality attributes can be represented by multiple links between the nodes. Our case study shows that such a quality modeling approach can represent complicated quality models of real software system adequately.
In this chapter, we demonstrated our graphical quality models as qualitative models. How to combine our graphical model with quantitative metrics is an interesting topic for further research. However, we believe that it should not be a major problem to include quantitative information in our graphic quality models. How to obtain and use such quantitative data in the analysis of software architecture is the key problem to be solved.
A closely related work on software quality modeling is the so-called activity-based approach proposed by Deissenboeck et al. (2007). In the activity-based approach, quality models are constructed based on two notions: the facts and the activities. A fact is a property of an entity in the system under consideration. It is represented in the form of [entity | attribute]. For example, the fact that a class C is complex can be represented as [ C | Complex]. An activity is an action that can be performed on or with the support of the system under consideration. Typical examples of activities are attacking the system related to system's security and modifying the code of a class related to the modifiability. In this approach, the quality of the system is manifested by how facts affect activities, where the impact of a fact on an activity can be either positive or negative depending on whether the fact contributes to the action positively or negatively. Therefore, the elements of a quality model are represented in the form of
![]()
A model can therefore be depicted in the form of a two-dimensional matrix where the entity-attribute pairs are the rows, the activities are the columns, and the impacts are the cells in the matrix. The activity-based quality modeling approach was first proposed by Deissenboeck et al. (2007) for the quality of maintainability. It is generalized by Wagner and Deissenboeck (2007) and Lochmann and Goeb (2011), applied to security by Luckey et al. (2010), to usability by Winter et al. (2008), to service-oriented architecture by Goeb and Lochmann (2011), and combined with Bayesian network to assess and predict software quality by Wagner (2010). In 2011, Deissenboeck et al. (2011) and Wagner et al. (2012) reported a tool called Quamoco that supports the construction of such quality models. An evaluating of the Quamoco meta-model and the tool was reported in Klas et al., (2011).
Both the activity-based approach (and its extensions) and our approach are concerned with the properties of entities in a software system. However, we further include phenomena as an important part of quality models. The main difference between the activity-based approach and our approach is that we emphasize the relationships between quality-carrying properties while the activity-based approach is concerned with how such properties affect the actions to be performed on the system. Thus, the complicated relationships between the quality attributes cannot be modeled in the activity-based approaches. More importantly, our method covers the model construction process and automated analysis of the models, while their work does not.
5.6.1.2 Hazard analysis
Our software hazard analysis method is an adaptation of existing system hazard analysis methods and techniques for safety engineering (Leveson, 1995; Neumann, 1995; Storey, 1996).
In particular, we extended the concept of hazard in order to cover all quality factors besides safety in the construction of quality models of software systems. In our context, the word hazard has its widest meaning, which means any situation that may cause harm as designed or due to a deviation from the design decision.
One of the most effective hazard identification technique is HAZOP (MoD, 2000), which has already been adapted to analysis of software safety. Here, we further extended it for a wider range of software quality by redefining the guide words.
From software engineering point of view, the original FMEA method has a number of weaknesses when applied to software systems. First, the original FMEA chart is ambiguous about which component causes the failure. However, it is important to clearly identify the component that causes the failure in order to enable the construction of a quality model of the software. Therefore, we modify the format of FMEA chart to include information about the component that causes the failure. Note that by the word component we meant both software architectural components and connectors.
Our second modification to FMEA is that the indirect effects of a failure mode are not charted. There are two reasons for this: First, we found that for a complicated software system, the indirect effects such as those at system level may not be so clear when a component fails. Second, information about indirect effects are redundant because they will be analyzed subsequently as the effect of other failures. The system-level effects of a component failure will eventually emerge from such a chain of cause-effect.
Our third modification to FMEA is that we also included an explanation column in the chart so that the reasons why a failure mode causes another can be provided. This is for the purpose of validating the analysis results. Such reasons are usually obvious in physical systems, but we find that they are sometimes less obvious for software systems.
Finally, in addition to what hazard analysis techniques and methods do, our approach also links the results of hazard analysis to quality attributes. In particular, each cause of a failure mode indicates a quality attribute that the developers are usually concerned with. The corresponding consequences of the failure mode indicate what quality attributes the users are usually most concerned with. Note that both causes and consequences of a failure mode are stated as observable phenomena of the system. The abstract quality attributes that a phenomenon manifested must be identified. Consequently, the relationships between the quality attributes or quality-carrying properties can be established through such concrete phenomena. This enables engineers to reason about quality at a high level of abstraction.
5.6.1.3 Evaluation and assessment of software architecture
In the past decade, significant progress has been made in the research on the analysis of software architectures. A number of methods have been advanced in the literature to evaluate and assess the quality of software architectural designs. Among the most well-known are SAAM (Kazman et al., 1996) and ATAM (Clements et al., 2002); see (Dobrica and Niemela, 2002) for a survey.
Existing scenario-based methods are for the assessment and evaluation of software quality as exhibited in architectural design. They examine software architectures in the context of a set of scenarios, although the ways that scenarios are elicited and used vary. The set of scenarios serves as the criteria or benchmarks of the assessment and evaluation. A remarkable advantage of such methods is that the examination of software behavior can be performed in realistic situations. Moreover, the complexity of analysis can be reduced through focusing on typical scenarios. However, it is difficult to build an overall picture of the system's quality, especially when there are intensive and complicated interactions between scenarios. The elicitation of a complete and representative set of scenarios is by no means a trivial task, which is currently still a brainstorming and negotiation process. The result of quality analysis may heavily depend on the selection of scenarios as reported in practical experiences (Kostelijk, 2005).
Existing model-based techniques focus on one single quality attribute, such as performance and reliability, rather than relationships between various quality attributes. Moreover, they are mostly quantitative models.
Our method is fundamentally different from these existing works.
5.6.2 Limitations and future work
The work reported in this chapter has some limitations, and there are a number of open problems that deserve further studies.
First, the quality models exemplified in this chapter are qualitative. We believe that the quality models can be extended to include quantitative data. For example, a phenomenon may occur with certain probability, and the impact of one phenomenon on another can also be quantitative as in quantitative hazard analysis in systems engineering. The key open problem for quantitative quality modeling and quality analysis is how to use such quantitative data to predict software quality. This deserves further research and will significantly improve power of quality analysis of software architectures.
Second, architectural designs can be represented in two different approaches: (a) in the form of an architectural model or (b) as a set of design decisions (Jansen and Bosch, 2005; Shahin et al., 2009). The case study was carried out with an architectural model. Further investigation could be conducted to see how the approach can be adapted to analysis architecture represented in the form of a set of design decisions.
Another problem that is worthy of investigating is combining the activity-based approach with our approach. It will be interesting to see how hazard analysis can be applied to a software process model to derive the activities. Deriving activities related to a quality issue is a problem that has not been solved in the existing work of the activity-based approach.
Moreover, the automation techniques can only be applied once a quality model is constructed. The quality model construction process depends on (a) the knowledge of analysts and (b) good definition/specification of the architecture. This model construction process is a structure process, but still a manual activity. Further tool support for this process is worth further investigating.
It is also worth further investigation to integrate existing architectural analysis methods and techniques with the approach presented in this chapter. For example, a hazard can be considered as a scenario. Can scenario-based approach be adapted and integrated with our approach? For example, can scenario identification and specification be used to replace hazard analysis? Or, on the other hand, can hazard analysis be used to replace scenario identification in scenario-based techniques? Hazard analysis techniques have the advantages of being a structured and systematic process, while scenarios are concrete and easy to understand.
Finally, when quality analysis of software architectural design is performed in the context of software evolution, it is of great importance to study how the method presented in this chapter applies when the system is restructured, re-engineered, or integrated to another system. The particular research questions that deserve further investigation include: Can quality models be incrementally modified? Can analysis algorithms be revised to be an incremental algorithm?