11
Probabilistic Design for Reliability and the Factor of Safety
To ensure the production of a reliable product, reliability activities must start early in the product development cycle. In order to analyze the reliability of a product, we have to first understand how to analyze the reliability of its components. In order to achieve the desirable reliability level, various reliability methodologies and tools can be used throughout the life cycle of the product—from the early planning stages through design, development, production, field testing, and customer use.
This chapter covers basic models and principles to quantify and evaluate reliability during the design stage. It presents the probabilistic design approach and relationships between reliability and safety factor. The relationship between tolerances on the characteristics of the parts and reliability is also discussed. Probabilistic design requires analysis of the functions of random variables.
11.1 Design for Reliability
Reliability is a design parameter and must be incorporated into a product at the design stage. One way to quantify reliability during design and to design for reliability is the probabilistic approach to design (Haugen 1968; Kececioglu 1991; Kececioglu and Cormier 1968). The design variables and parameters are random variables, and hence the design methodology must consider them as random variables.
The basic premise in reliability analysis from the viewpoint of probabilistic design methodology is that a given component has a certain strength which, if exceeded, will result in the failure of the component. The factors that determine the strength of the component are random variables, as are the factors that determine the stresses or load acting on the component. Stress is used to indicate any agency that tends to induce failure, whereas strength indicates any agency resisting failure. Failure is taken to mean failure to function as intended; it occurs when the actual stress exceeds the actual strength for the first time.
11.2 Design of a Tension Element
Let us consider the design of a tension element for a tensile load of P = 4,000 units of load, as shown in Figure 11.1. The design engineer is considering the failure mode due to tensile fracture. Based on the material and its manufacturing processes, the designer finds the value of the ultimate tensile strength to be 10,000 units of load per square inch. This value typically is some average or mean value for the strength.

The classical approach to design uses the equation (where A is the cross-sectional area of the element)
If we consider that the element has a circular cross-section with diameter D, then we can calculate that D = 0.3192 in.
Thus, it is clear that this approach does not consider the concept of reliability. We cannot answer the following questions:
- How reliable is this design? The answer is not provided by the above design approach and analysis.
- If a certain level of reliability is specified for a given mode of failure, what should be the value of the design variable (the diameter) of the tension element?
We do know that
- The load is a random variable due to varying conditions of customer usage and environmental factors.
- The ultimate tensile strength is a random variable due to material variation and manufacturing processes.
- The diameter of the element is a random variable due to manufacturing variability and is typically dealt with by introducing tolerances.
Thus we want to know what effect all types of variability have on the reliability.
The concept of design by probability, or probabilistic design, recognizes the reality that loads or stresses, and the strength of products subjected to these stresses, cannot be identified as specific values but have ranges of values with a probability of occurrence associated with each value in the range. Figure 11.2 shows f(x) as the probability density function (pdf) for the stress random variable X, and g(y) as the pdf for the strength random variable Y.
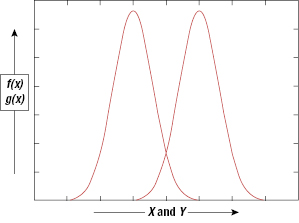
The words stress and strength are used here in a broad sense applicable in a variety of situations well beyond traditional mechanical or structural systems. As mentioned, stress is used to indicate any agency that tends to induce failure, while strength indicates any agency resisting failure. Formulaically, we can say that
The reliability of the component is the probability that the strength of the component will be greater than the stress to which it will be subjected. The factor of safety, represented by number n, is the ratio of strength (Y) and the stress (X). Since both Y and X are random variable, one definition of the factor of safety is
There are four basic ways in which the designer can increase reliability:
- Increase Mean Strength. This is achieved by increasing size or weight of materials, using stronger materials, and so on.
- Decrease Average Stress. This can be done by controlling loads or using higher dimensions.
- Decrease Stress Variations. This variation is harder to control, but can be effectively truncated by putting limitations on use conditions.
- Decrease Strength Variation. The inherent part-to-part variation can be reduced by improving the basic process, controlling the process, and utilizing tests to eliminate less desirable parts.
11.3 Reliability Models for Probabilistic Design
For a certain mode of failure, let f(x) and g(y) be the probability density functions for the stress random variable X and the strength random variable Y, respectively. Also, let F(x) and G(y) be the cumulative distribution functions for the random variables X and Y, respectively. Then the reliability, R, of the product for a failure mode under consideration, with the assumption that the stress and the strength are independent random variables, is given by

Consider a product where the stress and strength are normally distributed. Specifically, stress random variable X is normally distributed, with mean μX and with the standard deviation as σX. Similarly, the strength random variable Y is normally distributed, with mean μY and standard deviation σY. The reliability, R, for this mode of failure can be derived by:
It is known that U = Y − X is also normally distributed with
Hence,
or

where Φ(·) is the cumulative distribution function for the standard normal variable.
The reliability computations for other distributions, such as exponential, lognormal, gamma, Weibull, and several extreme value distributions, have been developed (Kapur and Lamberson 1977). In addition, the reliability analysis has been generalized when the stress and strength variables follow a known stochastic process.
11.4 Example of Probabilistic Design and Design for a Reliability Target
Let us now illustrate how to solve the design of the tension element given in Section 11.2 by using the probabilistic approach, which considers variability in the load conditions, ultimate tensile strength, and the diameter of the element. Suppose the variability of the load is quantified by its standard deviation as 100 units, and the ultimate tensile strength has a standard deviation of 5 × 10³ units of strength. Thus we have
Now we want to design the element for a specified reliability = R = 0.99990, with tensile fracture as the failure mode. Suppose the standard deviation of the diameter based on manufacturing processes is 0.5% of the diameter. The standard deviation can be converted to tolerances based on the idea of using ±kσ tolerances, where k is typically chosen as 3. If k is equal to 3 and the underlying random variable has normal distribution, then 99.73% of the values of the variable will fall within ±3σ (it must be emphasized that it can be any other number depending on the requirements). Thus, for our example, ±3σ tolerances will be ±1.5% of the diameter of the element. Then we can design (Kapur and Lamberson 1977) the tension element using a probabilistic approach, and the mean value of the diameter will be ![]() , compared with 0.3192 (calculated in Section 11.2).
, compared with 0.3192 (calculated in Section 11.2).
We can also do a sensitivity analysis of reliability with respect to all the design variables. For example, consider the effect of tolerances or the standard deviation of the diameter of the design element. Table 11.1 shows the effect on the diameter of tolerances, based on the nature of the manufacturing processes, as a percent of the dimension.
Table 11.1 Relationship between dimensional tolerances and reliability
| % Tolerances on D | Reliability |
|---|---|
| 0 | 0.999915 |
| 1.0 | 0.999908 |
| 1.5 | 0.999900 |
| 3.0 | 0.999847 |
| 7.0 | 0.999032 |
Similarly, we can study the sensitivity of R with respect to the standard deviation of the strength, which also may be a reflection of the design and manufacturing processes. This is given in Table 11.2.
Table 11.2 Relationship between strength variability and reliability
| Standard deviation for strength | Reliability |
|---|---|
| 2 × 10³ | 0.99999 |
| 4 × 10³ | 0.99996 |
| 5 × 10³ | 0.99990 |
| 8 × 10³ | 0.99157 |
| 10 × 103 | 0.97381 |
11.5 Relationship between Reliability, Factor of Safety, and Variability
When stress and strength are normally distributed,

The factor of safety is some ratio of the strength and stress variables. Since both are random variables, the question arises of which measure of the strength or the stress should be used in the computation of the factor of safety. One definition is based on using the mean values of the strength and the stress variables; then, the factor of safety, n, is defined as
The variability of any random variable can be quantified by its coefficient of variation, which is the ratio of the standard deviation and the mean value. Thus, the coefficient of variation is a dimensionless quantity. If it is 0.05, we can say that the standard deviation is 5% of the mean value, and if we use ±3σ tolerances, we can say that the tolerances are ±15% of the mean value of the underlying variable. Thus,


Then, Equation 11.7 can be rewritten as (by dividing both the numerator and the denominator by μY):

Thus, the above relation can be used to relate reliability, factor of safety, coefficient of variation for the stress random variable, and coefficient of variation for the strength random variable.
11.6 Functions of Random Variables
For any design problem, there is one design variable that is a function of several other design variables. For example, for the tension element considered in Section 11.2, the stress random variable, X, for the circular cross-section tension element is given by
where P and D are both random variables. Generally, it is very difficult to find the probability density function for one variable that is a nonlinear function of several other variables. In such cases, for engineering analysis, knowledge of the first and the second moments of the transformed variable is quite useful. This knowledge can be used for probabilistic design. Consider the following general model:
where Y is a function of n other variables, represented by vector X = (X1, X2, … , Xn).
This represents a general equation where a design random variable, Y, is a function of other design random variables. Information about the mean and variance of these n random variables is given as
Then, we can find the approximate values for μY and ![]() using Taylor's series approximations as follows:
using Taylor's series approximations as follows:
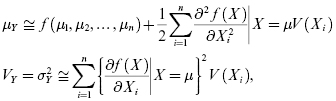
where
For approximate analysis, the second derivative terms for the mean are typically ignored.
For engineering analysis, designers think in terms of tolerances. Let the tolerances about the mean value be denoted by
If X is normally distributed with a mean of μX and variance of ![]() , and we use 3σ limits—that is, tX = 3σX, then for symmetrical tolerances about the mean, 0.27% of the items will be outside the 3σ limits.
, and we use 3σ limits—that is, tX = 3σX, then for symmetrical tolerances about the mean, 0.27% of the items will be outside the 3σ limits.
If we use 4σ limits, then tX = 4σX and 99.993666% of the values of X are within 4σ limits, or 0.006334% will be outside 4σ limits.
11.7 Steps for Probabilistic Design
Considering the total design-for-reliability program, the steps related to the probabilistic approach may be summarized as follows:
- Define the design problem. Develop system functional and reliability block diagrams to the lowest level of detail.
- Identify the design variables and parameters needed to meet customer's requirements for each component. Focus on understanding the physics/chemistry/biology of failure.
- Conduct a failure modes, mechanisms, and effects analysis (FMMEA). Focus on understanding failure mechanisms.
- Select and verify the significant design parameters.
- Formulate the relationship between the critical parameters and the failure-governing criteria related to the underlying components.
- Determine the stress function governing failure.
- Determine the failure governing stress distribution.
- Determine the failure governing strength function.
- Determine the failure governing strength distribution.
- Calculate the reliability associated with these failure-governing distributions for each critical failure mode.
- Iterate the design to obtain the design reliability goal.
- Optimize the design in terms of other qualities, such as performance, cost, and weight.
- Repeat optimization for each critical component.
- Calculate system reliability.
- Iterate to optimize system reliability.
11.8 Summary
Producing a reliable product requires planning for reliability from the earliest stages of product design. There are models and principles that can be used to quantify and evaluate reliability in the design stage. One approach is known as probabilistic design for reliability. The basic premise of probabilistic design for reliability is that a given component has a certain strength which, if exceeded, will result in failure. The factors that determine the strength of the component are random variables, as are the factors that determine the stresses or load acting on the component. Stress is used to indicate any agency that tends to induce failure, whereas strength indicates any agency resisting failure. The factor of safety is some ratio of the strength and stress variables. Since both are random variables, the engineers designing a product must determine which measures of strength or the stress should be used in the computation of the factor of safety based on probability. Following the steps for probabilistic design provided in this chapter can result in the production of a product that will achieve the desired level of reliability in its application environment.
Problems
11.1 The stress (X) and the strength (Y) random variables for a given failure mode of a product follow the normal distributions with the following parameters:
11.2 The stress (X) and the strength (Y) are random variables for a given failure mode and follow the normal distribution with the following information (CV is the coefficient of variation):
11.3 A beam with a tubular cross-section, shown in the figure below, is to be used in an automobile assembly.

To compute the stresses, the moment of inertia (I) of the beam about the neural axis is calculated as
The mean radius and thickness of the tubular cross-section have the following dimensions with 3σ tolerances:
Find the mean value of the moment of inertia and its standard deviation.
11.4 A random variable, Y, for a product is a function of three random variables, X1, X2, X3, and is given by
11.5 A random variable, Y, which determines the function of a system, is a function of three other random variables, X1, X2, X3, and is given by

Find the expected value and the standard deviation of the random variable Y, given the following information using the first-order Taylor's series approximation:
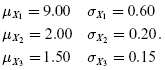
Also develop the 3σ tolerance limits for Y.
11.6 Suppose a mechanism is made of three components with dimensions X1, X2, X3. The response of this mechanism, Y, is related to Xis by: Y = 2X1 + X2 − 3X3.
The 3σ tolerances on the dimensions are as follows:

All the dimensions, Xi, i = 1, 2, 3, follow the normal distribution.
Find the mean and variance of the random variable Z and specify its 3σ tolerance limits.