
Chapter 4 Tool The EnergyPLAN Energy System Analysis Model
This chapter deals with the development of energy system analysis tools and methodologies that are suitable for the design and evaluation of renewable energy system alternatives. The specific purpose of the chapter is to present the energy system analysis model EnergyPLAN and describe how to use the model for the design of relevant alternatives. In the two next chapters, the model is used for the analysis of renewable energy system and alternatives.
The EnergyPLAN model is an input/output energy systems analysis model, which has been developed and expanded on a continuous basis since 1999. The model is deterministic and aims at identifying optimal operation strategies using hourly simulations during 1 year. The model involves total national energy systems on an aggregated basis and emphasizes the evaluation of different operation strategies. In this chapter, EnergyPLAN is described and compared to various other energy system analysis models.
First, this chapter presents some overall considerations of the use and construction of models for the purpose of designing alternative energy systems. The overall understanding of how, when, and why such specific descriptions of alternatives are needed was discussed in the previous chapters with regard to Choice Awareness. In this chapter, these issues are examined in the context of the design of energy system analysis models and concrete technical alternatives based on renewable energy technologies. Such methodology distinguishes among three implementation phases: introduction, large-scale integration, and 100 percent renewable energy systems.
1 Overall Considerations
In accordance with the idea of Choice Awareness, the overall aim of the EnergyPLAN model is to analyze energy systems for the purpose of assisting the design of alternatives based on renewable energy system technologies. Based on the description of Choice Awareness in the previous chapter, the following key considerations can be highlighted.
The model should be able to make a consistent and comparative analysis of all alternatives in question as well as a reference. It is important that all alternatives including the reference are calculated and analyzed equally to create the basis for a consistent comparison. The reference may be an existing proposal that one may want to challenge by introducing alternatives, or it may be an official plan made by authorities that can relate the discussion of the alternatives in question to other proposals.
The model should be able to analyze radical technological changes. Consequently, the model should be able to analyze both the existing system as well as other systems that are radically different both technically and institutionally. This means that the model should not be too influenced by the technical design of the existing system. Nor should the model focus solely on the existing institutional setup, such as, for example, the existing electricity market design. A balance must be created in such way that the model can conduct an analysis on the basis of existing technical and institutional setups without depending on these conditions to such an extent that the analysis of radical changes cannot be made properly. For example, if the existing version of a specific electricity market such as Nord Pool is an integrated part of the model, it may become impossible to analyze radically different alternatives. Or if the existing power station structure is an integrated part of the model, it may become impossible to analyze radically different technical options.
The model should be able to provide suitable information for feasibility studies and the design of public regulation measures based on concrete institutional economics. Therefore, the model should be able to contribute to feasibility studies with an analysis of relevant parameters such as external costs, job creation, and industrial innovation. In the case of station optimization based on market prices, the model should be able to distinguish between business and socioeconomic feasibility studies.
The model including methodology and results should be communicative. Therefore, the model should be transparent and consistent. This means that it should have a consistent documentation and be publicly available, user-friendly, and easily accessed. Moreover, good references or other forms of public acceptance will improve the model.
In addition to the preceding four important criteria, one may add that the model, in some cases, should be able to help in identifying and designing proper alternatives for future systems in which the number of alternative combinations is almost infinite. Therefore, the model should be able to explore a wide range of future options. It should be fast and capable of managing changes in various inputs in an easy and systematic way.
Moreover, the model should include temporal distributions and the intermittencies of renewable energy sources in the analysis. The time steps may be hourly or the like. As a decisive factor, the model must be able to include the impacts of fluctuations in renewable energy sources in the analysis in a suitable way. This is normally done on an hourly basis as opposed to annual or monthly time steps. However, the need for such accuracy depends on the degree of implementation of renewable energy in the system in question. In the following section, three implementation phases are defined.
Three Implementation Phases
The need for energy systems analysis tools depends on the share of renewable energy in the system. The following three phases of implementing renewable energy technologies can be defined.
The introduction phase: This phase represents a situation in which no or only a small share of renewable energy is present in the existing energy system. The phase is characterized by marginal proposals for the introduction of renewable energy—for example, wind turbines integrated into a system without or with only a small share of wind power. The system will respond in the same way during all hours of the year, and the technical influence of the integration on the system is easy to identify in terms of saved fuel on an annual basis.
The large-scale integration phase: This phase represents a situation in which a large share of renewable energy already exists in the system—for example, when more wind turbines are added to a system that already has a large share of wind power. In this phase, further increases in renewable energy will have an influence on the system, which will vary from one hour to another, depending, for example, on whether a heat storage is full or whether the electricity demand is high or low during the given hour. The influence of wind power integration on the system, and thereby the calculation of the fuel saved on an annual basis, becomes complex and requires a proper calculation with hourly simulation models.
The 100 percent renewable energy phase: This phase represents a situation in which the energy system has been or is being transformed into a system based 100 percent on renewable energy. The system is characterized by the fact that new investments in renewable energy must be compared not to nuclear or fossil fuels but to other sorts of renewable energy system technologies. These technologies include conservation, efficiency improvements, as well as storage and conversion technologies—for example, wind turbines introduced to replace the need for biomass resources. The influence on the system is complex not only in terms of differences from one hour to another but also with regard to the identification of a suitable combination of changes in conversion and storage technologies.
The definitions of these three implementation phases can be used in the selection and design of proper tools for the technical analyses. In the first phase, the technical calculations are rather simple and do not require complex models. Typically, annual fuel savings can be calculated without models or by using simple models based on duration curves or similar data. However, in the next phase, it becomes essential to make hour-by-hour calculations due to the fluctuations in most renewable energy sources. In the third phase, it also becomes essential to include proper analyses of advanced conversion and storage technologies in the system.
Different Types of Energy System Analysis Models
On a global scale, a large number of different computer models exist that can all be called energy system analysis models in the sense that they make calculations related to the analysis of energy systems. Table 4.1 lists some of the models. In general, all models address the implementation of renewable energy sources or other technologies related to renewable energy systems, such as, for example, CHP.
Table 4.1 Energy System Analysis Models
| Name | Description |
|---|---|
| Balmorel | The purpose of the Balmorel project is to support modeling and analyses of the energy sector with emphasis on the electricity and combined heat and power sectors. Such analyses typically cover a number of countries and include aspects of energy, environment, and economy. The project maintains and develops the Balmorel model, a tool that can be used by energy system experts, energy companies, authorities, transmission system operators, researchers, and others for the analyses of future developments of a regional energy sector. The model is developed and distributed under open source ideals. Hosted by the Balmorel project, Denmark. Can be accessed from www.balmorel.com. |
| COMPOSE | COMPOSE has been developed for externality-oriented technoeconomic energy projects that offer cost-benefit and cost-effectiveness analyses based on a wide range of important inputs, such as energy resources, environment, economic costs, financial costs, employment, balance of payment, and fiscal costs. COMPOSE has a solid institutional user base in Malaysia and is used by a few Danish energy consultancies as a platform for project analysis and capacity building in energy. Hosted by Aalborg University. |
| CHPSizer | A tool for conducting preliminary evaluations of CHP for hospitals and hotels in the United Kingdom. The software enables the user to make a preliminary evaluation of CHP for a building. This will guide the user in deciding whether to proceed with a more detailed examination of CHP for the building in question. Rather than being based on theoretical calculations, the software has been developed using actual energy profile data collected from buildings in the United Kingdom. Can be accessed from www.chp.bre.co.uk/chpoverview.html. |
| EnergyBALANCE | This model is a simple energy balance spreadsheet that provides a good comprehensive view of a regional or national energy system. The model is part of the Energy Planning Tool (EPT). The energy balance methodology is intended to be very simple and very easy to implement. Basically the energy balance of a country or region can be calculated on one page in a spreadsheet. Hosted by the Danish Organisation for Renewable Energy. Can be accessed from www.orgve.dk. |
| EnergyPLAN | Computer model for hour-by-hour simulations of complete regional or national energy systems, including electricity, individual and district heating, cooling, industry, and transportation. Focuses on the design and evaluation of renewable energy systems with high penetration of fluctuating renewable energy sources, CHP, and different energy storage options. Hosted by Aalborg University, Denmark. Can be accessed from www.EnergyPLAN.eu. |
| energyPRO | A complete modeling software package for combined technoeconomic design, analysis, and optimization of both fossil-and biofueled cogeneration and trigeneration projects, as well as other types of complex energy projects. Simulates and optimizes energy production in fixed and fluctuating electricity tariff systems by active use of thermal and fuel store. Hosted by EMD International A/S, Denmark. Can be accessed from www.emd.dk. |
| ENPEP | Suite of models for integrated energy/environment analysis. ENPEP was developed by Argonne National Laboratory and is distributed for use in over 70 countries. The model provides state-of-the-art capabilities for use in energy policy evaluation, energy pricing studies, assessing energy efficiency and renewable resource potential, assessing overall energy sector development strategies, and analyzing environmental burdens and greenhouse gas (GHG) mitigation options. Hosted by Argonne National Laboratory for the International Atomic Energy Agency. Can be accessed from www.adica.com. |
| H2RES | A model designed for balancing between hourly time series of water, electricity, and hydrogen demand, appropriate storage, and supply (wind, solar, hydro, diesel, or mainland grid). The main purpose is energy planning of islands and isolated regions that operate as stand-alone systems, but it may also serve other purposes. Hosted by Zagreb University. |
| HOMER | The model is made particularly for small, isolated power systems, although it enables grid connection. Optimization and sensitivity analysis algorithms provide the basis for an evaluation of the economic and technical feasibility of a large number of technologies. Models both conventional and renewable energy technologies. Hosted by National Energy Laboratory, United States. Can be accessed from www.nrel.gov/homer. |
| HYDROGEMS | Library of computer models for simulation of integrated hydrogen systems based on renewable energy. The objective is to provide a set of modeling tools that can be used to optimize the design and control of RE/H2 systems. Hosted by Institute for Energy Technology, Norway. Can be accessed from www.hydrogems.no. |
| LEAP | Scenario-based energy-environment modeling tool. Its scenarios are based on comprehensive accounting of how energy is consumed, converted, and produced in a given region or economy under a range of alternative assumptions on population, economic development, technology, price, and so on. Scenarios can be built and then compared to assess their energy requirements, social costs and benefits, and environmental impacts. Hosted by Stockholm Environment Institute in Boston. Can be accessed from www.energycommunity.org. |
| MARKAL | Integrated energy/environment analysis. MARKAL is a generic model tailored by the input data to represent the evolution of a specific energy system over a period of usually 40 to 50 years at the national, regional, state, province, or community level. Hosted by the International Energy Agency’s Energy Technology Systems Analysis Programme. Can be accessed from www.etsap.org. |
| MESAP | MESAP is an energy-systems toolbox for application-oriented system solutions in many areas: market analysis in electricity trade, database for power plant operation control, data pool for technical reporting, management of control data in grid companies, CO2 monitoring, emission inventories for air pollutants, database for energy models, as well as systems for common statistics administration. MESAP is the only software for all of these applications. It is hosted by Seven2one Informationssysteme GmbH, Karlsruhe, Germany. Can be accessed from www.seven2one.de. |
| PRIMES | Modeling system that simulates a market equilibrium solution for energy supply and demand in the European Union (EU) member states. The model determines the equilibrium by finding the prices of each energy form. Thereby, the quantity producers find the best solution that matches the quantity demanded by consumers. The equilibrium is static (within each time period) but repeated in a time-forward path under dynamic relationships. Hosted by National Technical University of Athens. Can be accessed from www.e3mlab.ntua.gr. |
| RAMSES | Simulation/planning model for electricity and district heating supply. Semilinear hour-simulation of Nordic electricity and district heating system. INPUT: Plant database (existing and new plants), transmission lines, prices and taxes, electricity and district heating demand, and load curve sets. OUTPUT: Electricity price, fuel consumption, emissions, cash flows, LOLP, and so on. Hosted by the Danish Energy Authority. |
| Ready Reckoner | Model to assist users with a “first pass” technical and financial analysis of cogeneration at their site. The programme is a Ready Reckoner intended for quick preliminary evaluations. The Ready Reckoner conducts a simple technical and financial analysis of a cogeneration opportunity. Should the cogeneration opportunity appear attractive in this evaluation, then the user is recommended to conduct more detailed analyses or engage suitable advisers to consider the project evaluation to the extent necessary to commit funds. Hosted by Department of Industry Science and Resources and the Australian EcoGeneration Association (Australia). Can be accessed from www.eere.energy.gov. |
| RETScreen | A model that can be used to evaluate the energy production and savings, life cycle costs, emission reductions, financial viability, and risk of various types of energy-efficient and renewable energy technologies. The software also includes product, cost, and climate databases. Hosted by RETScreen International Clean Energy Decision Support Centre. Can be accessed from www.retscreen.net. |
| SESAM | SESAM is a generic multiscenario model that may represent a local, regional, or national energy system consisting of several countries. A SESAM model is a physical model. A SESAM database comprises 25 data registers in which the present and the possible future structural and physical properties of the energy system in question as well as data specifying alternative quantitative development factors are registered. The SESAM programmes compute the energy flows in the system on a monthly and daily basis. Hosted by Klaus Illum, Denmark. Can be accessed from www.klausillum.dk/sesam. |
| SIVAEL | SIVAEL is a simulation program for a thermal power system with related CHP areas. The program makes a simulation with start/stop and load distribution on an hourly basis. The simulation period is from 1 day to 1 year. The program can handle condensing plants, CHP plants—both back pressure and extraction but also wind power, electricity storage (battery or pumping power), and trade with foreign countries. Hosted by the Danish TSO energinet.dk. Can be accessed from www.energinet.dk/en/menu/Planning/Analysis+models/Sivael/SIVAEL.htm. |
| WASP | Long-term electricity generation planning including environment analysis. The model determines the least cost-generating system expansion plan that adequately meets the demand for electrical power while respecting user-specified constraints on system reliability. WASP uses probabilistic simulation to calculate the production costs of a large number of possible future system configurations and dynamic programming. The model determines the optimal expansion plan for the electric power system considered. Hosted by the International Atomic Energy Agency. Can be accessed from www.adica.com. |
With regard to the idea of Choice Awareness and the introduction of the three implementation phases just described, important differences can be found among the models. One important difference is whether the model makes a detailed hour-by-hour simulation or is based on aggregated annual calculations, possibly made by using duration curves or similar data. Another important difference is whether the model addresses the national or regional system level or the project or single station level. In Table 4.2, the models are grouped according to these essential differences.
Table 4.2 Grouping of Energy System Analysis Models
| Aggregated Annual Calculations | Detailed Hour-by-Hour Simulations | |
|---|---|---|
Not all models are designed in such a way that they fit perfectly into such groupings. Consequently, one model is located in two groups, and other models may have aspects of more than one group as well. The MESAP model is not shown in Table 4.2 because it is really a database system that combines the use of other models. Moreover, some models are being further developed on a continuous basis. Typically, models based on aggregated annual calculations are added the possibilities of hourly simulations in different parts of the calculation process. Nevertheless, Table 4.2 shows two important differences.
As described with regard to the three implementation phases, models based on aggregated data are typically suitable for the introduction phase. They can provide the needed information in a proper way, and in this phase it is not necessary to run detailed hourly simulations, which is often a complicated and data-consuming process. Moreover, models based on aggregated data typically have the advantage of being easy to document and communicate compared to hourly simulation models. However, for the analysis of large-scale integration or 100 percent renewable energy systems, hour-by-hour simulation models are essential.
In the division between levels of operation, the models at the project/station level typically cannot evaluate the influence of, for example, fluctuating renewable energy sources on the overall regional and/or national system. On the other hand, they are typically better equipped for making detailed analyses of the business-economic operation and design of single stations. Consequently, in the groupings in Table 4.2, only detailed hour-by-hour simulation models at the regional/national level can fulfill the requirements for energy system analyses of renewable energy systems in the large-scale and 100 percent renewable energy implementation phases.
It should be emphasized, however, that the design of alternatives by use of such models in many cases may benefit from being combined with either models based on aggregated data or models at the project/station level. For example, analyses made with the EnergyPLAN model have, in some cases, been combined with analyses conducted by one of the “sister models”: energyPRO and EnergyBALANCE (Lund et al. 2004). The energyPRO model has been used to add analyses of how single stations will respond to changes in the energy system design defined by use of the EnergyPLAN model. The EnergyBALANCE model has been used to make fast and easy first estimates of different large-scale options, before involving the EnergyPLAN model.
Hourly Simulation Models at the National Level
Historically, energy system analysis models based on hourly simulations at the regional/national level have typically been developed with two purposes in mind. Some models have been developed to optimize the load dispatch between single power stations in utility systems, whereas others have been made for planning purposes—that is, identifying proper investment strategies.
The overall aim of the load dispatch models is to design suitable operation strategies on a day-to-day basis. Such models have, prior to the introduction of national and international electricity markets, been used and designed by electricity system operators to plan least-cost production strategies of electricity supply systems with several production units. Because the models must be able to calculate exact operational costs and emissions, they are typically very comprehensive and detailed in their description of each individual power station.
The overall aim of planning models is to identify suitable future investment strategies. Such models have been used and designed by public planning authorities, utility companies, and different NGOs, including universities and research institutions. Sometimes load dispatch models have been used for planning purposes, or planning models have been developed on the basis of load dispatch models. In practice, such models have sometimes proven to be very conservative in the sense that they have mainly been able to analyze small, short-term adjustments to the existing system rather than radical changes in the overall system design and regulation. Moreover, the use of such models is typically very time-consuming because of the need for detailed data.
Both load dispatch models and planning models have been influenced by the introduction of international electricity markets, which has taken place in many countries around the world since the late 1990s. Operation strategies for power production units are now determined by the market, and the models are used to identify optimal market behavior. Planning models have been facing the need to include the modeling of international electricity markets in the analyses. Some models have chosen to convert to solely making simulations of the results of market operations based on the present institutional setup of the international electricity market, while, for example, the EnergyPLAN model has been equipped with the ability to make both market analyses as well as simulations on the basis of pure technical optimizations.
Consequently, hour-by-hour simulation models at the regional/national level have important differences. One is whether the present electricity market structure forms the only institutional basis for the simulation and/or operational optimization procedure of the model or if this simulation is also based on technical and/or economic optimization. In the latter case, it is also important to define whether this optimization is made on the basis of a business-economic market strategy or some sort of socioeconomic least-cost strategy.
Another important difference is whether the model combines all sectors of a regional/national energy system or includes only parts of this system, such as, for example, the electricity supply. This difference is important to the analysis of large-scale integration and especially 100 percent renewable energy systems. These systems will benefit from efficiency measures such as CHP production, which makes an integrated analysis of the electricity and the heating sector relevant. They will also benefit from the use of electricity for transport purposes, which makes combined electricity and transport sector analyses essential.
In Table 4.3, the hour-by-hour simulation models applied to the regional/national level have been grouped according to their optimization and their operation levels. Again, such grouping is not 100 percent accurate for all models. The LEAP model is left out. It is characterized as a simulation model rather than an optimization model because other models optimize the operation of the system. In principle, the two models SIVAEL and Balmorel do not include all sectors, as individual heating and transportation are left out. However, they do comprise the aspect of electricity grid involvement in the case of micro-CHP or electric vehicles.
Table 4.3 National Level Hour-by-Hour Simulation Models
| Detailed Hour-by-Hour Simulation Models at the Regional/National Level | Operational Optimization Based on Technoeconomic Optimization | Operational Optimization Based on Electricity Market Simulations |
|---|---|---|
| Include all sectors: electricity, district heating, individual heating, industry, transportation | ||
| Include mainly the electricity sectors |
In Table 4.3, the EnergyPLAN model is placed in both the technoeconomic optimization and the electricity market optimization model groups. The model is designed for calculating the consequences of both types of optimization strategies. Moreover, the calculation of the market-economic strategy is based on a business-economic optimization of individual stations in which different taxes and subsidies can be specified. The aim is to be able to provide information for the discussion on proper public regulation measures.
It must be emphasized that the models have differences other than those presented in Tables 4.2 and 4.3. Models such as LEAP and RAMSES, for example, emphasize the analyses of scenarios and include the calculation of series of years.
2 The EnergyPLAN Model
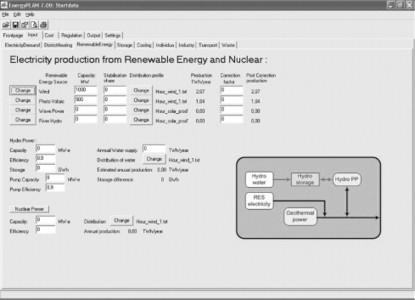
The EnergyPLAN model is a computer model designed for energy systems analysis. The model has been developed and expanded on a continuous basis since 1999. It is a user-friendly tool designed in a series of tab sheets and programmed in Delphi Pascal. Input is defined by the user in a number of technical input tab sheets and a few cost specification input tab sheets. Figure 4.1 shows an example.
The following section provides a brief description of the model. A full documentation of the model can be found on www.EnergyPLAN.eu. Moreover, the model is described and compared to other models in Lund and Münster (2003a), Lund and Münster (2003b), and Lund, Duić, Krajacić, and Carvalho (2007).
Purpose and Application
The main purpose of the model is to assist the design of national or regional energy planning strategies on the basis of technical and economic analyses of the consequences of implementing different energy systems and investments. The model encompasses the whole national or regional energy system, including heat and electricity supplies as well as the transportation and industrial sectors. With regard to electricity supply, the model emphasizes the analysis of different regulation strategies with a focus on the interaction between CHP and fluctuating renewable energy sources.
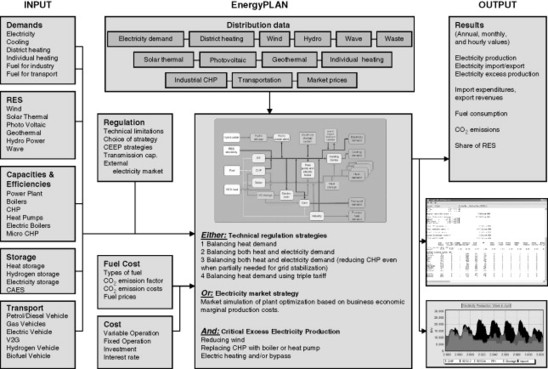
The model is a deterministic input/output model. General inputs are demands, renewable energy sources, energy station capacities, costs, and a number of optional different regulation strategies emphasizing import/export and excess electricity production. Outputs are energy balances and resulting annual production, fuel consumption, import/exports of electricity, and total costs, including income from the exchange of electricity (see Figure 4.2).
EnergyPLAN is an input/output energy systems analysis model. Compared to other similar models, the following characteristics of EnergyPLAN can be highlighted:
- • EnergyPLAN is a deterministic model as opposed to a stochastic model or models using Monte Carlo methods. With the same input, it will always come to the same results. However, as we shall see in Chapter 5, the model can perform a calculation on the basis of RES data of a stochastic and intermittent nature and still provide system results that are valid for future RES data inputs.
- • EnergyPLAN is an hour-simulation model as opposed to a model based on aggregated annual demands and production. Consequently, the model can analyze the influence of fluctuating RES on the system as well as weekly and seasonal differences in electricity and heat demands and water inputs to large hydropower systems.
- • EnergyPLAN is aggregated in its system description as opposed to models in which each individual station and component is described. For example, in EnergyPLAN, the district heating systems are aggregated and defined as three principal groups.
- • EnergyPLAN optimizes the operation of a given system as opposed to models that optimize investments in the system. However, by analyzing different systems (investments), the model can be used for identifying feasible investments, as we shall see in Chapters 5 and 6.
- • EnergyPLAN provides a choice between different regulations strategies for a given system as opposed to models into which a specific institutional framework (such as the Nord Pool electricity market) is incorporated.
- • EnergyPLAN analyzes 1 year in steps of 1 hour as opposed to scenario models analyzing a series of years. However, several analyses each covering 1 year may of course be combined into scenarios.
- • EnergyPLAN is based on analytical programming as opposed to iterations, dynamic programming, or advanced mathematical tools. This makes the calculations direct and the model very fast when performing calculations. In the programming, any procedures that would increase the calculation time have been avoided, and the computation of 1 year requires only a few seconds on a normal computer, even in the case of complicated national energy systems.
Energy Systems Analysis Structure
The model can be used to calculate the consequences of operating a given energy system in such a way that it meets the set of energy demands of a given year. Different operation strategies can be analyzed. Basically, the model distinguishes between technical regulation—that is, identifying the least-fuel-consuming solution—and market-economic regulation—that is, identifying the consequences of operating each station on the electricity market with the aim of optimizing the business-economic profit. In both situations, most technologies can be actively involved in the regulation. And in both situations, the total costs of the systems can be calculated. In the documentation of the model, a list of energy demands is presented as well as an overview of all components of the model. A short description of how they are operated in relation to the two different regulation strategies is also presented together with a list of the main inputs for each component.
The model includes a large number of traditional technologies, such as power stations, CHP, and boilers, as well as energy conversion and technologies used in renewable energy systems, such as heat pumps; electrolyzers; and heat, electricity, and hydrogen storage technologies, including Compressed Air Energy Storage (CAES). The model can also include a number of alternative vehicles—for instance, sophisticated technologies such as V2G (vehicle to grid), in which vehicles supply the electric grid. Moreover, the model includes various renewable energy sources, such as solar thermal and photovoltaic (PV), wind, wave, and hydropower.
Figure 4.3 shows the procedure of the energy system analysis. As a first step, calculations are based on a small computation, which is made simultaneously with the typing of input data in the input and cost tab sheets. The next step consists of a series of initial calculations that do not involve electricity balancing. Then the procedure is divided into either a technical or a market-economic optimization. The user chooses which one to apply. However, each calculation lasts only a few seconds, and, consequently, it is possible to make both calculations, one after another. The technical optimization minimizes the import/export of electricity and seeks to identify the least-fuel-consuming solution. On the other hand, the market-economic optimization identifies the least-cost solution on the basis of the business-economic costs of each production unit. In both situations, the model can calculate the socioeconomic consequences that provide important information for the design of different public regulation measures.
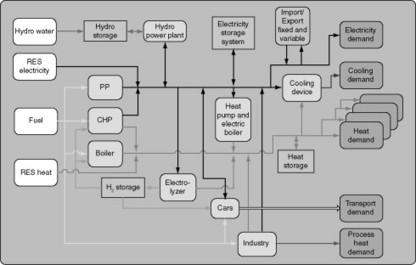
The principle of the energy system of the EnergyPLAN model is shown in Figure 4.4. In the EnergyPLAN model, an aggregated analysis is made of the many individual stations that together form a regional or national energy system. Thus, all boilers, CHP stations, and so forth that produce heat for district heating are grouped into three district heating systems. Moreover, the EnergyPLAN model includes a series of optional renewable energy sources as well as a large number of conversion and storage technologies. In this way, the model can make comprehensive analyses of rather complex 100 percent renewable energy systems without the need for an enormous quantity of detailed data.
Energy System Analysis Methodology
A short outline of how to use the model in the design of energy alternatives at the national level (Lund, Andersen, and Antonoff 2007) is presented here. On the home page of the model, www.EnergyPLAN.eu, one can download a whole set of exercises and assignments, including detailed answers, that together constitute a comprehensive set of guidelines on how to use the model. As already shown in Table 4.3, the model can be used for different kinds of energy system analyses.
- Technical analysis: Design and analysis of complex energy systems at the national or regional level and according to different technical regulation strategies. In this analysis, input is a description of energy demands, production capacities and efficiencies, and energy sources. Output consists of annual energy balances, fuel consumptions, and CO2 emissions.
- Market exchange analysis: Further analysis of trade and exchange on international electricity markets. In this case, the model needs further input to identify market prices and to determine the response of these prices to changes in import and export. Input is also needed to determine marginal production costs of the individual electricity-producing unit. The modeling is based on the fundamental assumption that each station optimizes according to business-economic profits, including any taxes and CO2 emissions costs.
- Feasibility studies: Calculation of feasibility in terms of total annual costs of the system according to different designs and regulation strategies. In this case, inputs such as investment costs and fixed operation and maintenance costs must be added together with lifetime periods and an interest rate. The model determines the socioeconomic consequences (taxes and subsidies are not included) of the productions. The costs are divided into fuel costs, variable operation costs, investment costs, fixed operation costs, electricity exchange costs and benefits, and possible CO2 payments.
A Step-by-Step Approach to National Energy Systems Analysis
The approach to energy systems analysis used in the EnergyPLAN model can be divided into four steps:
- Step 1: Defining reference energy demands
- Step 2: Defining a reference energy supply system
- Step 3: Defining the regulation of the energy supply system
- Step 4: Defining alternatives
Step 1: Defining Reference Energy Demands
The first step is to define a reference energy demand. Electricity demand is simply defined by identifying an annual demand (TWh/year) and choosing a distribution data set. The distribution data can be picked from the database of the model, or one can create a new distribution (for more information, please consult the model documentation). Energy conservation is included by modifying the energy demands. The model has been designed in such a way that it helps implementing changes into the hourly distribution of, for example, electricity demand in the case that electric heating or cooling demands decrease as a result of energy-saving measures.
Though the annual demand is sufficient, the model also offers the possibility of defining two additional demands with separate distribution data sets. One is meant to be used for adding electricity to transportation and another for fixed import/exports, but they can be used for any purpose; the model simply adds up the three demands.
The model can also include flexible electricity demands—that is, demands that are included in the regulation of securing a balance between supply and demand. One must choose among flexibility within 1 day, 1 week, or 1 month (4 weeks). For each group, a flexible demand can be identified by two values: annual demand (TWh/year) and maximum capacity (MW).
District heating demand is defined in the same way as the electricity demand—that is, an annual demand (TWh/year) and a selected distribution data set. The model divides district heating supply into three groups, and the demand of each group must be defined. The first group comprises traditional district heating stations with boilers, the second group consists of small CHP stations, and the third group comprises large CHP stations based on thermal extraction stations.
With regard to the energy systems analysis, the model focuses on electricity demand and district heating demand. However, all sectors are included in the model, and industry as well as individual heating and transportation may be included in the electricity and district heating balancing of demand and supply. If industrial CHP stations provide electricity or district heating, such productions can be specified for each of the three district heating groups. The production is specified the same way as the demand—namely, by an annual production and a selected distribution data set.
With regard to transportation as well as individual heating sectors, various options exist in terms of several different electric, hydrogen, and biofuel vehicles and various solar thermal and micro-CHP systems, including conversion and storage technologies, such as electrolyzers. If such technologies involve district heating or electricity sectors, they are included in the electricity balancing of the computation.
Step 2: Defining a Reference Energy Supply System
Step 2 is to define the reference energy supply system, divided into renewable energy sources, capacities and efficiencies of energy production units, and average division of fuel types. Renewable energy sources for electricity production, such as wind power, photovoltaic power, and wave power, are defined by an installed capacity and by a selected distribution data set. Again, the distribution data can be chosen from the existing database, or new distributions can be made. The model offers the possibility of adding a factor (between 0 and 1) to modify the distribution curve. The factor adjusts the distribution curve to higher annual productions if, for instance, new wind power capacities are being built on locations with better wind potentials.
Renewable energy sources for district heating production, such as solar thermal, can be specified for each of the three district heating groups in the same way as heat production from industry—in other words, by an annual production (TWh/year) and a selected distribution data set. Moreover, heat, electricity, and hydrogen storage and energy conversion technologies, such as electrolyzers, can be specified.
Capacities and efficiencies of the energy production units are defined as average values for each type of station in each of the three district heating groups. For group one (district heating boilers), only the efficiency needs to be stated, since the capacity of the boiler must always be sufficient. For groups two and three (CHP), capacities (MWe and MWth) and efficiencies are given for CHP units and boilers. Moreover, one can define a heat pump and a heat storage capacity (GWh) for each of the two groups. The heat pump is defined by the capacity (MWe) and the COP-factor (heat output divided by electric input). Moreover, the maximum share of heat production of the heat pump can be specified to achieve the specified COP.
Finally, the capacity (MW) and the efficiency of a condensing power station are given. The model distinguishes between the CHP stations in group three and the condensing power station. However, in practice, these stations may be the same units (extraction stations). Consequently, the model makes the calculation assuming that the capacity input of the condensing power stations constitutes the total maximum capacity of both the condensing stations and the CHP stations in group three. Thus, if the CHP capacity at a certain stage of the analysis is not used for CHP production, the same capacity might be used for condensing power production (but with a different efficiency).
The fuel consumption of the stations can be calculated by the model on the basis of efficiencies. To track fuel use and CO2 emissions, the model needs inputs in terms of the share of fuel types at the different stations. The shares are given by relative numbers, and all types of fuels are increased or decreased accordingly. However, the model enables an adjustment of the amount of one or more types of fuels.
Step 3: Defining the Regulation of the Energy Supply System
The regulation strategy is defined by choosing one of the predefined general strategies and then specifying some limitations and additional options. Basically, the technical analyses distinguish between either a technical optimization or an electricity market optimization. In the market-economic optimization, electricity production is determined on the basis of business-economic marginal production costs of the different types of electricity-producing units. Moreover, electricity-consuming units, such as heat pumps and electrolyzers, are also included. One can specify various taxes on different fuels and types of production and thereby conduct analyses of the consequences of changing taxes and/or introducing new ones.
With regard to the technical optimization, one must choose one of the two following strategies:
- Technical Regulation Strategy 1: Meeting heat demand. In this strategy, all units produce solely according to heat demand. In district heating systems without CHP, the boiler simply supplies the difference between the district heating demand and the production from solar thermal and industrial CHP. For district heating with CHP, the units are prioritized according to the sequence (1) solar thermal, (2) industrial CHP, (3) CHP units, (4) heat pumps, and (5) peak load boilers. The model offers the option of operating the small CHP units according to a triple tariff, giving an incentive to allocate electricity production during hours of high and peak demand.
- Technical Regulation Strategy 2: Meeting both heat and electricity demands. When choosing Strategy 2, the export of electricity is minimized mainly by replacing CHP heat production by boilers or by heat pumps. This strategy simultaneously increases electricity consumption and decreases electricity production, as the CHP units must lower their heat production. With the use of extra capacity at the CHP stations combined with heat storage capacity, the production at the condensation stations is replaced with CHP production and thus minimized.
Two additional technical regulation strategies exist that are variants of the preceding two. For detailed explanations, please consult the model documentation.
The model includes the ancillary services needed to secure grid stability in the electricity system. Limitations in identifying optimal operation strategies can be specified in terms of the minimum share of electricity production required from a unit for this to supply ancillary services. The condensing power stations and the CHP stations in group three are always assumed to have such abilities. Any share of small CHP stations and renewable energy sources with ancillary service abilities can be specified as an input value.
As part of the regulation strategy, one can specify system limitations on the export/import of electricity represented by transmission line capacities (MW). Depending on the situation and the chosen regulation strategy, such bottlenecks may lead to the need for higher export than the amount allowed by the transmission lines—a so-called critical excess electricity production (CEEP). Consequently, one can specify strategies to avoid this problem. As shown in Chapters 5 and 6, the description and analysis of the reference system can be used to establish a common point of departure when promoting and discussing alternative strategies.
Step 4: Defining Alternatives
When a reference is described, the analysis of alternatives is relatively easy. The computation of the whole system takes only a few seconds on a normal personal computer. Analyzing different regulation strategies is, in many cases, a simple matter of pressing a button to change regulation and run the computation once again. Changing technologies is a matter of choosing other technologies. Of course, this change depends on a proper definition of inputs in terms of efficiencies and costs, which may be time-consuming to find for new technologies.
Sister Models to EnergyPLAN
The EnergyPLAN computer model has three sister models (sister models in the sense that they originate from Aalborg University and have been made to supplement and support one another): EnergyBALANCE, energyPRO, and COMPOSE. The EnergyBALANCE model is a simple spreadsheet model based on aggregated annual calculations of energy balances. The model is designed for an easy integration of typical inputs from national statistics. The model adds different data of efficiencies, and so forth, to make overall analyses of changes in demand and supply technologies. The model is now made available by the Danish Organisation for Renewable Energy (OVE) on its home page: www.orgve.dk.
The energyPRO model excels in modeling and optimizing the operation characteristics of a single station. It has the ability to evaluate many different types of technologies and performance criteria for generating units, particularly CHP stations, and enables the user to add detailed definitions of parameters, such as heat production, electricity production, fuel costs, power curves, and control strategies. It can also conduct a sophisticated economic analysis that considers varying values for revenues (e.g., heat prices and spot market electricity prices) and costs (e.g., fuel costs, taxes, and other operational expenses). However, this level of detail may also require a significant amount of research and data input to properly initialize the model, and it implies a high level of understanding of the specific performance characteristics of the station.
The model focuses primarily on production aspects and, apart from a few exceptions such as heat distribution losses, it does not consider how the station fits into the broader energy system. The model is an advanced computer tool for the design and operation of CHP stations, and it has been used to design most of the existing small CHP stations in Denmark. The initial version of energyPRO was designed in the late 1980s. Shortly thereafter, the program was made commercially available by the software company Energy and environMental Data (EMD). Based on ongoing dialogue with users, EMD has refined and added new facilities and features to the model on a continuous basis. It has become a widely used software package for the analysis of local energy stations based on gas engines, gas turbines, and steam turbines burning both waste and wood chips, as well as stations based on boilers only. EnergyPRO has been used in Lund and Andersen (2005) and Andersen and Lund (2007).
COMPOSE (Compare Options for Sustainable Energy), designed by Morten Blarke, is a technoeconomic energy project assessment model. COMPOSE enables the evaluation of user-defined sustainable energy projects in user-defined energy systems and includes user-selected methodology options. The mission of COMPOSE is to combine the strength of energy project operational simulation models with the strength of energy system scenario models to create a modeling framework that supports an increasingly realistic and qualified comparative assessment of sustainable energy options.
The current functionality of COMPOSE focuses on the modeling of framework design. The model currently enables the user to calculate the relocation coefficient of an energy project and an energy system defined by the user. User-defined uncertainties may be specified to enable extensive risk analyses—for example, specifying uncertainty ranges for wind production. Special features currently include, among others, Monte Carlo risk assessments, import of projects from energyPRO, and import of hourly distributions from EnergyPLAN.
The vision is to establish COMPOSE as a cost-benefit and cost-effectiveness toolbox for private and public decision makers. COMPOSE focuses on assessing to which degree energy projects may support intermittency, while generally offering a realistic evaluation of the distribution of costs and benefits with uncertainty. In coming releases, COMPOSE will increasingly improve the evaluation of energy projects in a project-system hybrid perspective with respect to fossil energy consumption, emissions, economic costs, financial costs, fiscal costs, employment, balance of payment, and distributional aspects of costs and benefits.
3 Reflections
Based on the formulation of the Choice Awareness theory in the previous chapter, this chapter discussed some overall key issues to consider when designing tools for the analysis and assessment of renewable energy alternatives, representing radical technological change. The following reflections can be made regarding such key considerations and the EnergyPLAN model:
- • The EnergyPLAN model can make a consistent and comparative analysis of different energy systems based on fossil fuels and nuclear and renewable energy. When the reference energy system is described, the EnergyPLAN makes it possible to conduct a fast and easy analysis of radically different alternatives without losing coherence and consistence in the technical assessment of even complex renewable energy systems.
- • The EnergyPLAN model seeks to enable the analysis of radical technological changes. The model describes existing fossil fuel systems in aggregated technical terms, which can thereby relatively easily be changed into radically different systems, such as systems based on 100 percent renewable energy sources. The model divides the input to market-economic analyses into taxes and fuel costs and thereby makes it possible to analyze different institutional frameworks in the form of different taxes. Moreover, if more radical institutional structures are to be analyzed, the model can provide purely technical optimizations. This makes it possible to separate the discussion of institutional frameworks, such as specific electricity market designs, from the analysis of fuel and/or CO2 emissions alternatives. Compared to many other models, the EnergyPLAN has not incorporated the institutional setup of the electricity market of today as the only institutional framework.
- • The model can calculate the costs of the total system divided into investments costs, operation costs, and taxes, such as CO2 emissions trading costs. Thereby, the model can create data for further analysis of socioeconomic feasibility studies, including balance of payment, job creation, industrial innovation, and so on.
- • The model has a coherent documentation and seeks to provide a user-friendly communication in input/output tab sheets. Moreover, the model is very fast. On a normal PC, the complete hour-by-hour simulations of even very complex national energy systems take only a few seconds. Consequently, the model can be used interactively to test different input combinations in the design of references as well as to make several different calculations of many options without taking very much time. This is further helped by the library of distribution data incorporated into the model, which makes it rather fast and easy to implement comprehensive changes in the input.
- • With regard to the three different implementation phases, the model includes a very high number of different technologies that are relevant for renewable energy systems. Consequently, it serves as a good tool for making detailed and comprehensive analyses of a very wide spectrum of large-scale integration possibilities, as well as 100 percent renewable energy systems.