Chapter 6 Analysis 100 Percent Renewable Energy Systems
The implementation of 100 percent renewable energy systems adds to the challenge of integrating RES into existing energy systems on the large scale. Not only must fluctuating and intermittent renewable energy production be coordinated with the rest of the energy system, but the size of the energy demand must also be adjusted to the realistic amount of potential renewable sources. Furthermore, this adjustment must address the differences in the characteristics of different sources, such as, for example, biomass fuels and electricity production from wind power.
The design of suitable energy systems must consider both conversion and storage technologies. Renewable energy will have to be compared not to nuclear or fossil fuels but to other sorts of renewable energy system technologies, including conservation, efficiency improvements, and storage and conversion technologies—for example, wind turbines versus the need for biomass resources. The selection of technologies is complex, not only with regard to the differences in hourly distributions of the technologies but also in terms of the identification of a suitable combination of changes in conversion and storage technologies.
The design of renewable energy systems involves three major technological changes: energy savings on the demand side, efficiency improvements in the energy production, and the replacement of fossil fuels by various sources of renewable energy. Consequently, the analysis of such systems must include strategies for integrating renewable sources into complex energy systems which are influenced by energy savings and efficiency measures. The design of 100 percent renewable energy systems can be addressed at the project level as well as the national level. At the project level, this chapter describes the efforts of the Los Angeles Community College District to implement a 100 percent renewable energy system for each of its nine college campuses. And at the national level, two studies of Denmark are presented. As already mentioned in Chapter 5, Denmark is a frontrunner in that respect and therefore represents a suitable case for the analysis of large-scale integration as well as the development of 100 percent renewable energy systems.
In Denmark, savings and efficiency improvements have been important parts of the energy policy since the first oil crisis in 1973. Hence, by means of energy conservation and expansion of CHP and district heating, Denmark has been able to maintain the same level of primary energy supply for a period of more than 30 years, in spite of the fact that GDP has increased by about 100 percent in the same period (from 1972 to 2007). Moreover, approximately 15 percent of fossil fuels have been replaced by RES. In the same period, transport and electricity consumption as well as the heated space area have increased substantially.
Thus, Denmark provides an example of how renewable energy development strategies constituted by a combination of savings, efficiency improvements, and RES can be implemented. As described in Chapter 5, Denmark is now facing two problems: how to integrate the high share of intermittent electricity from RES and how to include the transport sector in future strategies. Taking this development of strategies a step further, the implementation of renewable energy systems is not only a matter of implementing savings, efficiency improvements, and RES, but it also becomes a matter of introducing and adding flexible energy conversion and storage technologies and designing integrated energy system solutions.
According to estimations of the Danish Energy Authority from 1996, the realistic biomass potential for energy purposes corresponds to 20–25 percent of the present total primary energy supply. Meanwhile, Denmark has a great potential for other sorts of renewable energy, especially wind power. In many ways, Denmark provides a typical example of the situation in many countries: The transportation sector is totally fueled by oil, and although the biomass potential is not big enough to replace fossil fuels, the potential of intermittent renewable sources is substantial.
Based on the case of Denmark, this chapter presents two studies that analyze the problems and perspectives of converting the present energy system into a 100 percent renewable energy system. The first study is a one-person university study that applies the information presented in Chapter 5 to the analysis of a coherent renewable energy system. The second study is based on the technical inputs of members of the Danish Society of Engineers (IDA). The input to the study is the result of the organization’s “Energy Year 2006,” during which 1600 participants at more than 40 seminars discussed and designed a model for the future energy system of Denmark. Both studies exercise the analysis of designing coherent and complex renewable energy systems, including the suitable integration of energy conversion and storage technologies. And both studies are based on detailed hour-by-hour simulations carried out with the EnergyPLAN model.
1 The Los Angeles Community College District Case
This Section Courtesy of Guest Writer Woodrow W. Clark II
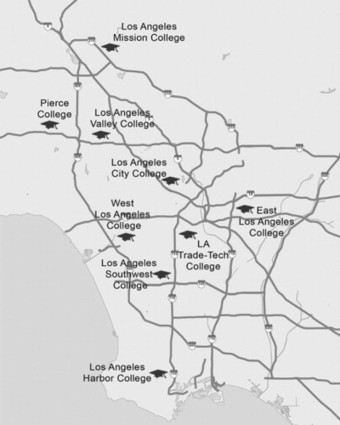
This section describes the effort of the Los Angeles Community College District (LACCD) to implement a 100 percent renewable energy system for each of its college campuses. LACCD is the largest college system in the United States, with nine campuses serving over 180,000 students and two new satellite campuses. The map in Figure 6.1 shows the locations of the nine college campuses. All of the campuses are dependent on a central power grid. However, by the end of 2009, all of them will be “off the grid.” The strategy is to change from fossil fuels to renewable energy and storage while meeting most of the energy demand of the college community.
In 2001 and 2002, the LACCD Board decided to replace 45 buildings with new ones, according to the U.S. Green Building Council standards, called LEED (Leadership in Environmental and Energy Design). Each campus has from 30 to 40 buildings. Then, in 2002 and 2003, the local community contributed more than $3 billion in bond funds to support the building programs. By mid-2007, the LACCD decided to make each of its colleges “energy independent and carbon neutral” through the use of renewable energy, primarily solar, but also geothermal and wind power, as well as storage devices and distributed renewable solar thermal energy systems. On each campus, these devices and systems would provide heating and cooling to multiple buildings. The programs were successful, and in November 2008, the local community granted another bond fund of more than $3 billion to make all of the colleges energy independent and carbon neutral (Clark and Eisenberg 2008).
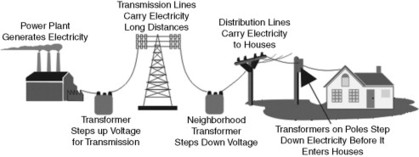
Most campuses have a power demand from 4 to 6 MW, which renewable energy and storage systems should be able to accommodate. The LACCD is an example of agile and flexible energy systems, in which the colleges generate renewable energy for themselves, while other buildings, private businesses, and homes in the community are connected to the central power grid, which is placed far from the community. Figure 6.2 shows how such communities can also provide for the energy independence of homes and businesses by implementing smart and sustainable supplies.
Renewable energy is a critical component of LACCD’s sustainable building program, which has the objective of making all nine colleges energy-independent. This will be achieved by reducing overall energy consumption, increasing energy efficiency, and producing energy through a combination of alternative energy methods—namely, solar, wind, biomass, geothermal, hydrogen generation, and storage technologies. It is also achieved by continuing the expansion of the curricula to prepare students for “green-collar” jobs. The district’s plan is to produce (and store) enough on-site power for each college to meet all of its electricity demand and, ultimately, to “go off the grid,” saving an estimated $12 million in the process.
LACCD seeks support for renewable energy projects that employ solar technologies at the Harbor Los Angeles, Pierce, Southwest, Los Angeles Trade Tech, and East Los Angeles colleges. Solar farms have already started generating renewable energy on several campuses. At East Los Angeles College, for example, a 1.2 MW solar farm, which was completed in 2008, generates nearly 2 million kilowatt-hours of electricity annually, meeting nearly 45 percent of the college’s electricity demand and saving $270,000 in utility costs.
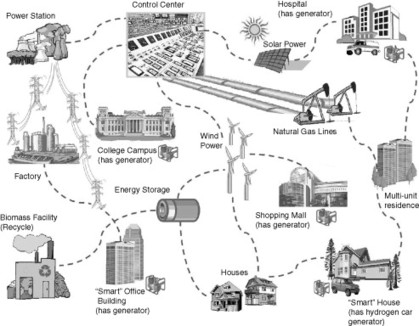
On-site renewable energy projects that use solar technologies for governmental institutions, including colleges and universities, are approved for construction by the Division of the State Architect. The private sector and businesses do not need such approvals. Flexible energy generation systems or the combination of central grid and on-site power are known as “agile energy systems” (Clark and Bradshaw 2004) and are illustrated in Figure 6.3.
The basic concept for the LACCD is that each campus can generate its entire baseload demands through renewable energy technologies. Since renewable energy generation resources, like wind and solar, are intermittent or not baseload, storage devices (flow and other batteries as well as fuel cells, flywheels, and supercapacitors) are also required, as well as some connection to the central grid that acts like a storage device.
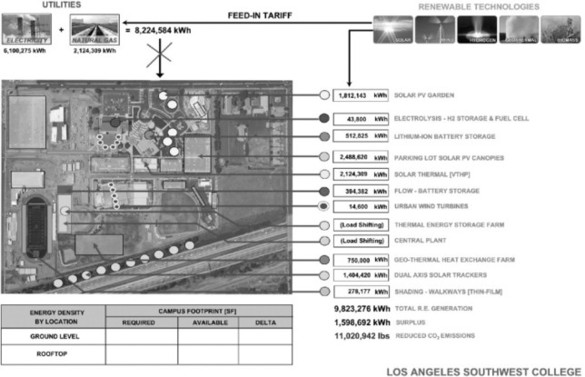
LACCD’s renewable energy program has already had a significant, long-term economic impact at the local (municipal and county), state, and national levels. First, the district will save approximately $12 million (just over $1 million per campus) in energy costs annually by becoming energy-independent. As demonstrated in Table 6.1, the primary renewable technology for achieving this goal is solar panels. The Google campus map of Mission College, however, shown in Figure 6.4, demonstrates how other renewable technologies are also being planned and implemented.
Table 6.1 Renewable Energy Program: Solar Project Summary
| Campus | Technology | Energy Producing Capability (in MW) | Project Cost (in millions of $) |
|---|---|---|---|
| East Los Angeles College | Solar: parking structure, rooftop, thin film | 3.4 | 34.6 |
| Los Angeles City College | Solar: parking structure, rooftop, thin film | 2.8 | 28.2 |
| Los Angeles Harbor | Solar: parking structure, rooftop, thin film | 3.1 | 30.3 |
| Los Angeles Mission | Solar: parking structure, rooftop, thin film | 4.6 | 47.0 |
| Northeast (satellite) | Solar: parking structure, rooftop, thin film | 0.5 | 4.9 |
| Pierce | Solar: parking structure, rooftop, thin film | 4.1 | 44.2 |
| Los Angeles Southwest | Solar: parking structure, rooftop, thin film | 3.9 | 32.7 |
| Los Angeles Trade-Tech | Solar: parking structure, rooftop, thin film | 1.3 | 17.9 |
| Los Angeles Valley | Solar: parking structure, rooftop, thin film | 3.6 | 38.3 |
| West | Solar: parking structure, rooftop, thin film | 3.0 | 30.0 |
| Total 30.3 | $308.10 |
In addition, the district can redirect its resources toward faculty and students and thus design a sustainable development curriculum.
Implementing LACCD’s renewable energy and energy efficiency programs allows the district to meet and exceed its own electricity demands (especially during peak periods), thus providing a replicable model for other colleges, universities, and cities and states to do the same. It is difficult to assess economic impact as a dollar amount tied to such measures or as the number of high-paying jobs involved in implementing renewable energy programs or conserving precious natural resources, but it appears already to be significant.
LACCD’s sustainable building program requires that new construction that is funded 50 percent or more by voter-approved funds meets or exceeds U.S. Green Building Council LEED™ certification standards. This will ultimately result in the renovation and construction of more than 90 projects. These range from state-of-the-art educational facilities and athletic fields made from synthetic turf to central (physical) plants that more efficiently heat and cool campus buildings, retrofitting existing parking structures with solar arrays, and incorporating solar arrays in the design and construction of new buildings. New construction and renovation projects incorporate green building components in the form of energy-saving features, such as low-emission materials and efficient lighting systems, and water- and waste-reduction features, including low-flush toilets and water-efficient and native landscaping. LACCD’s green building effort also uses alternative construction materials, environmentally friendly building techniques, and sustainable products.
As a result, the LACCD renewable energy program is expected to offset 46,400 tons of carbon dioxide emissions annually, the equivalent of removing 12,000 automobiles from the road.
Agile sustainable communities” such as colleges can be in a variety of configurations and can use the combination of on-site power generation (such as solar panels on roofs or wind turbines that are specifically designed for buildings) and central grid power systems for power generation. The local power generation from solar and wind sources, for example, allows public and government buildings, like city hall, fire and police departments, and public schools and universities, to generate their own power while still staying connected to the central power grid. Increasingly, more and more private businesses have been following the public sector leadership.
The Google map in Figure 6.4 shows a variety of renewable energy and storage technologies that are now incorporated into the campus plans. It is also anticipated that Feed-in-Tariffs will play an important role in financially supporting the renewable energy power generation, since the campus meets its electric power demand before supplying power to the local utility.
In conclusion, renewable energy systems and communities are flexible (agile) infrastructure systems in the sense that they are able to include both on-site renewable energy and central grid power-generation systems. An agile system can adapt due to change in such a way that innovation is welcomed rather than opposed. Agile energy systems are resourceful and are adept at developing ways to avoid or to solve conflicts while deconstructing social-economic barriers that slow down effective solutions to problems.
Such renewable energy systems foster and promote diversity along with dynamic growth. This growth can create a change applying knowledge, intellectual capital, financing mechanisms, and advanced technologies such as wind power, geothermal, solar thermal, photovoltaic, CHP (combined heat and power), fuel cells, and hydrogen options together with conservation and load management.
No one standard or uniform set of circumstances or technologies fits all communities and regions. Geothermal resources are not found everywhere, nor are sunshine and wind, but the combination of these renewable resources along with new technologies for storage, such as fuel cells and flywheels, provides for hybrid technologies that create firm baseloads and dependable power. Such systems can replace or complement conventional fossil fuel systems or be used in the transition to 100 percent renewable, energy-independent, on-site, and distributed energy systems.
2 The First approach to Coherent Renewable Energy Systems1
This section is based on Lund’s (2007a) article “Renewable Energy Strategies for Sustainable Development.” On the basis of the many studies described in Chapter 5 and the case of Denmark, this article discusses the problems and perspectives of converting the present energy system into a 100 percent renewable energy system. The conclusion is that such conversion is possible. The necessary renewable energy sources are present, and if further technological improvements of the energy system are made, a 100 percent renewable energy system can be created. Most important are the technological conversion of the transport sector and the introduction of flexible energy system technologies.
This article refers to the RES potential in Denmark as estimated by the Danish Energy Authority in 1996 as part of the Danish government’s energy plan, Energy 21 (Danish Ministry of Environment and Energy 1996). The estimate, which is shown in Table 6.2, dates back 10 years, and today it seems that some potential is underestimated. This is particularly true with regard to the offshore wind potential, which is very dependent on technological development. The potential is considered higher today, and is expected to increase in the future along with the growth in size of the wind turbines. Furthermore, it should be noted that the theoretical biomass potential in the survey from 1996 is estimated to be as high as 530 PJ/year, assuming that all farming areas are converted into energy crops, and 310 PJ/year, in the case that Denmark is self-supplied by food and the remaining areas are converted into energy crops. Again, this estimate is 10 years old, and biomass resources in particular have recently been discussed, indicating that the potential may be even higher if a selection of crops is made with the concerted purpose of both producing food and energy. Thus, the total potential of 180 PJ/year, including only a minor share of energy crops, is to be considered a “business as usual” scenario in terms of food production. All in all, the RES potential is sufficient, and only a small share is used today. In Figure 6.5, minimum and maximum potentials are compared to the present primary energy supply in Denmark, represented by the year 2003.
Table 6.2 Potential Renewable Energy Sources in Denmark
| Renewable Energy Source | Potential |
|---|---|
| Wind power (onshore) | 5–24 TWh/year |
| Wind power (offshore) | 15–100 TWh/year |
| Photovoltaic (10–25% of houses, 100–200 kWh/m2) | 3–16 TWh/year |
| Wave power | 17 TWh/year |
| Hydropower | ∼0 TWh/year |
| Total electricity | 40–160 TWh/year |
| Solar thermal (individual houses) | 6–10 PJ/year |
| Solar thermal (district heating) | 10–80 PJ/year |
| Geothermal | >100 PJ/year |
| Total heat | 100–200 PJ/year |
| Straw | 39 PJ/year |
| Wood | 23 PJ/year |
| Waste (combustible) | 24 PJ/year |
| Biogas | 31 PJ/year |
| Energy crops | 65 PJ/year |
| Total biomass fuel | 182 PJ/year |
Source: Danish Energy Authority, 1996.
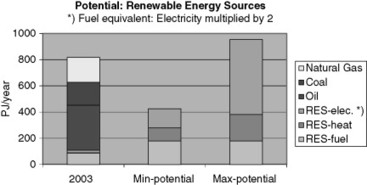
Figure 6.5 Potential of RES in Denmark as estimated in 1996 and compared to the primary energy supply in 2003.
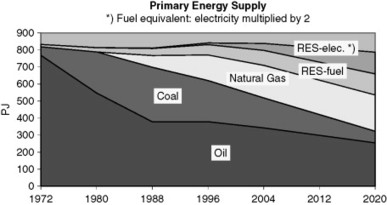
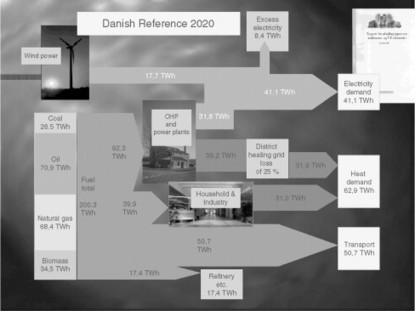
The Danish energy supply is traditionally based on fossil fuels. Denmark has a very limited hydropower potential, and during the 1960 and 1970s, the electricity supply was dominated by large oil- and coal-fired steam turbines located near the big cities. However, after the first oil crisis, Denmark became a leading country in terms of implementing CHP, energy conservation, and renewable energy. Consequently, the Danish energy system has changed from a situation in 1972 in which 92 percent out of a total supply of 833 PJ was oil into a situation in year 2005 in which only 41 percent out of 850 PJ is oil. In the same period, both transportation and electricity consumption, as well as the heated space area, have increased substantially. Today, the share of electricity produced from CHP is as high as 50 percent, and approximately 20 percent of the electricity demand is supplied by wind power. Figure 6.6 illustrates the development from 1972 until today, as well as future expectations resulting from the reference scenario we saw in Chapter 5: the 2020 projection made by the Danish Energy Authority in 2001. Figure 6.7 shows the energy flow of the system in the present situation.
When analyzing the possibilities of continuing the development and replacing more fossil fuels by RES, two problems arise. One is the transport sector, which is almost totally fueled by oil. Consumptions have increased from 140 PJ in 1972 to an expected 180 PJ or more in 2020. Thus, the transportation sector accounts for most of the expected oil consumption. Another problem is the integration of electricity produced from CHP and wind power. Until recently, CHP stations were not operated to balance fluctuations in wind power. As a consequence, Denmark has had problems of excess electricity production in periods of strong winds, if these coincided with the operation of CHP stations.
The aim of the analysis is to evaluate whether a 100 percent renewable energy system is a possibility for Denmark and to identify key technological changes and suitable implementation strategies. As a starting point for the analysis, it is assumed that the design of renewable energy systems involves three major technological changes: energy savings on the demand side, efficiency improvements in the energy production, and the replacement of fossil fuels by various RES. Consequently, the following technological changes of the reference (Ref2020) have been identified for the analysis of the first step (STEP 1) of converting the Danish energy system into a renewable energy system:
- • Savings: A 10 percent decrease in electricity demand, district heating, and heating for households and industry.
- • Efficiency: A combination of better efficiencies and more CHP. Better efficiencies are defined as 50 percent electricity output and 40 percent heat output of CHP stations. This can be achieved either by partly implementing fuel cell technology or by improving existing steam turbine/engine technologies. More CHP is defined as the conversion of 50 percent of fuels for individual houses and industry into CHP, partly through district heating.
- • RES (renewable energy sources): An increase in biomass fuels from 34 to 50 TWh/year (125–180 PJ/year) and the addition of 2.1 TWh solar thermal to district heating and 5000 MW PV to electricity production.
- • All: A combination of the three preceding measures.
It should be noted that such technological changes are moderate compared to the maximum potential. Thus, it is both possible and realistic to save more than 10 percent as well as to replace more than 50 percent by CHP, and so forth.
As STEP 1, the consequences of each of the three technological changes have been analyzed as well as the combination of the three. The results are shown in Figure 6.8 in terms of primary energy consumption. Figure 6.8 shows that an increase rather than a decrease in fuel consumption is the main tendency. This is because these STEP 1 technological changes lead to a substantial increase in excess electricity production. More CHP, better efficiencies, less demand (savings), and more intermittent resources all create a higher excess production, unless measures are taken to prevent such problems. The resulting excess productions are given in Table 6.3.
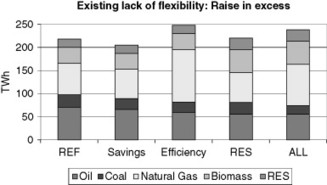
Figure 6.8 STEP 1: Primary energy supply, year 2020, in the reference Ref2020 compared to the three technological changes of STEP 1, including excess electricity production.
Table 6.3 Resulting Primary Energy Supply and Excess Electricity Production of the Three STEP 1 Technological Changes Compared to the Reference Ref2020
| TWh/Year | REF | Savings | Efficiency | RES | All |
|---|---|---|---|---|---|
| Total fuel consumption | 218 | 205 | 248 | 220 | 238 |
| Excess electricity production | 8.4 | 9.6 | 45.5 | 11.7 | 48.2 |
As a general tendency, the intention to decrease fossil fuels leads to an increased excess electricity production. One way to avoid excess electricity production is to use it for domestic purposes. In STEP 2, such an analysis has been carried out in order of priority. In the case of excess production, (1) CHP units are replaced by boilers, (2) boilers are replaced by electric heating, and (3) the production from wind turbines and/or PV is simply reduced. This is a rather simple and inexpensive way of avoiding excess production. The results are shown in Figure 6.9.
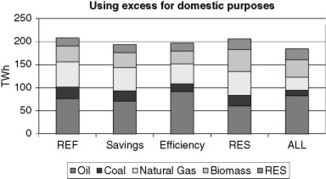
Figure 6.9 STEP 2: Equal to Figure 6.8, but without excess electricity production (the excess production is used to replace fuels by simple and inexpensive measures).
Now, all technological improvements result in a decrease in fuel consumption. However, the decrease is small, since most of the benefits derived from technological improvements are lost in the excess production. Another problem is the high share of oil for transportation. This shows that when implementing savings, efficiency measures, and RES, the problem of integration becomes important, as does the issue of including transportation. Consequently, in STEP 3 the following changes have been analyzed:
- • Transportation: Oil for transportation is replaced by electricity, according to a scenario described by Risø National Laboratory and discussed in Chapter 5 (Nielsen and Jørgensen 2000). Vehicles weighing less than 2 tons are replaced by battery vehicles and hydrogen fuel cell vehicles. In the scenario, 20.8 TWh of oil is replaced by 7.3 TWh of electricity. Here, the same ratio has been used for converting the total oil consumption of 50.7 TWh in the reference system Ref2020 into an electricity consumption of 17.8 TWh. The electricity demand has been made flexible, within the time period of 1 week, and has a maximum capacity of 3500 MW. The results are shown in Figure 6.10. In this case, both the reference Ref2020 and all three STEP 1 alternatives result in a decrease in fuel consumption.
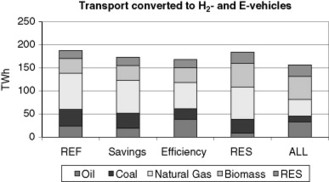
Figure 6.10 STEP 3: Primary energy consumption (same as Figure 6.9) when oil for transportation is replaced by electricity for electric vehicles and hydrogen vehicles.
STEP 4 has added better flexibility in terms of heat pumps and CHP regulation together with electrolyzers:
- • Flexible CHP and heat pumps: Small CHP stations are included in the regulation together with heat pumps added to the system. A 1500 MWe heat pump capacity with a coefficient of performance (COP) of 3.5 has been analyzed.
- • Electrolyzers and wind regulation: Electrolyzers have been added to the system, and, at the same time, wind turbines have been included in the voltage and frequency regulation of the electricity supply.
In STEP 4, together with these measures of flexibility, wind power has been added to the system until the resulting fuel consumption was equal to the available biomass resources of 180 PJ (50 TWh/year). The results are given in Figure 6.11. In this case, the main question is how much wind power is needed in order to fulfill the objective. The resulting wind power capacity is given in Table 6.4.
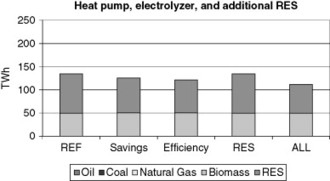
Figure 6.11 STEP 4: Primary energy consumption (same as Figure 6.10) when adding flexible energy systems and converting to 100 percent RES.
Table 6.4 Resulting Fuel Consumption and Required Wind Power Capacity
| TWh/Year | REF | Savings | Efficiency | All |
|---|---|---|---|---|
| Total fuel consumption (TWh/year) | 134 | 125 | 121 | 112 |
| Wind Power (GW) | 27.1 | 22.1 | 18.6 | 15.6 |
| Annual wind investment (MW/year) | 900 | 740 | 620 | 520 |
| Lifetime = 30 years | ||||
As seen, the Danish energy system can be converted into a 100 percent renewable energy system when combining 180 TJ/year of biomass with 5000 MW of PV and between 15 and 27 GW of wind power. In the reference, 27 GW of wind power is required, while in the combination with savings and efficiency improvements, the necessary capacity is reduced to 15 GW. With an expected average lifetime of 30 years, the total capacity of 15 GW of new offshore wind power can be reached by installing 500 MW/year. Subsequently, the 15 GW can be maintained by a continuous replacement of 500 MW each year. Since 3 GW have already been installed, the total capacity can be reached within approximately 25 years.
In Figure 6.12 and the upper part of Figure 6.13, the primary energy supply and the energy flow of such a system are illustrated. The two figures are comparable to Figures 6.6 and 6.7. Altogether, the study indicates that a 100 percent renewable energy system based on domestic resources is physically and technically possible in Denmark. However, it should be emphasized that the proposal presented here is based on a conversion of the entire transport sector into a combination of electrical and hydrogen fuel cell vehicles. Such conversion may prove unrealistic for the entire sector. The obvious technological alternative is to convert into biofuels instead, as discussed in Chapter 5. In Figure 6.13 (bottom diagram), the consequences of such a conversion are shown, based on the solution already described in Chapter 5.
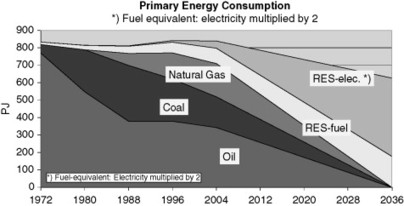
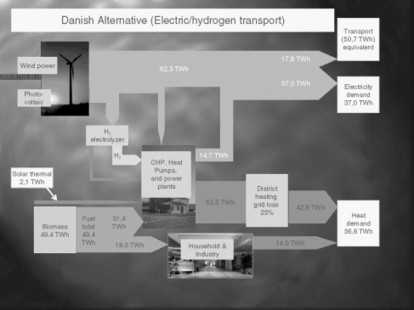
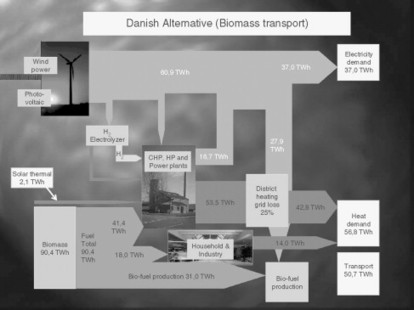
Figure 6.13 The energy flow in a 100 percent Danish renewable energy system. The top diagram is based on electric and hydrogen fuel cell vehicles referring to Figure 6.12, and the bottom diagram refers to the biofuel alternative.
As the two diagrams in Figure 6.13 show, the choice between electricity/hydrogen-based or biofuel-based transport technologies has a major impact on the size of the resulting primary energy supply of the system. In particular, the amount of biomass resources is affected. Such results emphasize the importance of further developing electric vehicle technologies and indicate that biofuel transportation technologies should be reserved for the areas of transportation in which the electricity/hydrogen solution proves insufficient.
3 The Danish Society of Engineers’ Energy Plan2
This section is based on Lund and Mathiesen’s (2009) article “Energy System Analysis of 100 Percent Renewable Energy Systems,” which presents the methodology and results of an overall energy system analysis of a 100 percent renewable energy system. The input to the system is the result of the Danish Society of Engineers’ project “Energy Year 2006,” in which 1600 participants at more than 40 seminars discussed and designed a model for the future energy system of Denmark.
As in the previous chapter, the energy system analysis has been performed using the EnergyPLAN model, including hour-by-hour simulations, leading to the design of a flexible renewable energy system with the ability to balance the electricity supply and demand. The results are detailed system designs and energy balances for two energy target years: 2030, with 45 percent renewable energy, demonstrating the first important steps on the way toward a 100 percent renewable energy system (IDA 2030), and 2050, with 100 percent renewable energy from biomass and combinations of wind, wave, and solar power (IDA 2050).
The analysis concludes that a 100 percent renewable energy supply based on domestic resources is physically possible and that the first step toward 2030 is economically feasible to Danish society. However, Denmark will have to consider to which degree the country should rely on mostly biomass resources, which will involve the reorganization of the present use of farming areas, or rely on mostly wind power, which will involve a large share of hydrogen or similar energy carriers leading to certain inefficiencies in the system design.
In the project of the Danish Society of Engineers, the method applied to the design of a future energy system in Denmark was a combination of two phases: a creative phase involving the inputs of a number of experts and a detailed analytical phase involving technical and economic analyses of the overall system and feedback on each individual proposal. In a back-and-forth process, each proposal was formed in such way that it combined the best of the detailed expert knowledge with the ability of the proposal to fit well into the overall system, in terms of technical innovation, efficient energy supply, and socioeconomic feasibility.
First, the Danish Society of Engineers appointed 2006 as the “Energy Year” in which the organization aimed at making specific proposals to advocate an active energy policy in Denmark. The targets formulated for the future Danish energy system, 2030 (IDA 2030), were (1) maintain the security of energy supply, (2) cut CO2 emissions by 50 percent by 2030 compared to the 1990 level, and (3) create employment and increase exports in the energy industry by a factor of four. The target of maintaining the security of supply refers to the fact that Denmark, at present, is a net exporter of energy from the production of oil and natural gas in the North Sea. However, the reserves are expected to last for only a few more decades. Consequently, Denmark will soon either have to start importing energy or develop domestic renewable energy alternatives.
Based on such targets, the work of the Danish Society of Engineers was divided into seven themes under which three types of seminars were held: a status and knowledge seminar, a future scenario seminar, and a road map seminar. The process resulted in a number of suggestions and proposals on how each theme could contribute to the national targets.
The contributions involved a large series of energy demand-side management and efficiency measures within households, industry, and transportation, together with a wide range of improved energy conversion technologies and renewable energy sources, putting emphasis on energy efficiency, CO2 reduction, and industrial development. All such proposals were described in relation to a Danish year 2030 “business-as-usual” reference (Ref 2030). These descriptions involved technical consequences as well as investment and operation and maintenance costs.
In a parallel process, all proposals were analyzed technically in an overall energy system analysis using the EnergyPLAN computer model. The energy system analysis was conducted in the following steps:
- 1. First, the Danish Energy Authority’s official “business-as-usual” scenario for year 2030 (Ref 2030) was recalculated using the EnergyPLAN model. It was possible, on the basis of the same inputs, to come to the same conclusions regarding annual energy balances, fuel consumption, and CO2 emissions. Consequently, a common understanding of Ref 2030 was established.
- 2. Second, each of the proposals for year 2030 was defined as a change of the reference system, and a first rough alternative was calculated including all changes. The creation of such a system led to a number of technical and economic imbalances, and, consequently, proposals of negative feasibility were reconsidered and suitable investments in flexibility were added to the system.
In the EnergyPLAN model, the analysis was done by basing the operation of the system on a business-economic optimization of each production unit. Such optimization included taxes and involved electricity prices on the international electricity market. The socioeconomic consequences for the Danish society did not include taxes. The calculation of consequences was based on the following basic assumptions:
- • World market fuel costs equal an oil price of US$68/barrel (with a sensitivity of US$40 and US$98/barrel).
- • Investment and operation costs are based on official Danish technology data, if available, and if not, on the input from the “Energy Year” experts.
- • An interest real rate of 3 percent is used (with a sensitivity of 6 percent).
- • Environmental costs are not included in the calculation, apart from CO2 emission trade prices of 20 EUR/ton (with a sensitivity of 40 EUR/ton).
A technical analysis and a feasibility study were conducted of each individual proposal. Since many of the proposals were not independent in nature, such an analysis was conducted for each proposal, in both the reference “business-as-usual” system (Ref 2030) and the alternative system (IDA 2030). One proposal—the insulation of houses—may be feasible in the reference but not in the alternative system; for instance, if solar thermal was applied to the same houses or if the share of CHP was increased as part of the overall strategy. Consequently, several of the contributions and proposals had to be reconsidered and coordinated with other contributions.
The proposed alternatives of the Danish Society of Engineers (IDA 2030 and 2050) were compared to both the present situation (2004) and to a “business-as-usual” reference scenario for 2030 (Ref 2030), assuming that the gross energy consumption (primary energy supply) would rise from 850 PJ in 2004 to 970 PJ in 2030. The IDA 2030 and 2050 alternatives were defined as a series of changes to the “business-as-usual” reference in 2030. IDA 2030 is an alternative for year 2030, and IDA 2050 is a 100 percent renewable energy system alternative for 2050. The different energy systems included everything, as well as natural gas consumption on the drilling platforms in the North Sea and jet fuel for international air transportation.
After completing the back-and-forth process of comparison and discussion among experts and the overall systems analysis, the proposals of IDA 2030 ended up being the following:
- • Reduce space heating demand in buildings by 50 percent
- • Reduce fuel consumption in industry by 40 percent
- • Reduce electricity demand in private households by 50 percent and in industry by 30 percent
- • Supply 15 percent of individual and district heating demands by solar thermal
- • Increase electricity production from industrial CHP by 20 percent
- • Reduce fuel consumption in the North Sea by 45 percent through savings, CHP, and efficiency measures
- • Slow down the increase in transportation demand through tax reforms
- • Replace 20 percent of road transportation with ships and trains
- • Replace 20 percent of fuel for road transportation with biofuels and 20 percent with electricity
- • Replace natural gas boilers by micro fuel cell CHP, equal to 10 percent of house heating
- • Replace individual house heating by district heating CHP, equal to 10 percent
- • Replace future power stations constructed after 2015 by fuel cell CHP stations, equal to 35–40 percent of the total amount of power stations in 2030
- • Increase the total amount of biomass resources (including waste) from the present 90 PJ to 180 PJ in 2030
- • Increase wind power from the present 3000 MW to 6000 MW in 2030
- • Introduce 500 MW wave power and 700 MW photovoltaic power
- • Introduce 450 MWe heat pumps in combination with existing CHP systems and flexible electricity demand to achieve a better integration of wind power and CHP into the energy system
It should be emphasized that the proposal of adding heat pumps and flexible demand was an outcome of the overall energy systems analysis process, which pointed out that the potential of flexible production should be exploited in the best possible way to overcome balancing problems in electricity and district heating supplies. Especially with regard to CHP stations based on solid oxide fuel cell (SOFC) technology, such stations should exploit the potentials of changing production quickly without losing efficiency and within the full range of loads.
The results of the socioeconomic feasibility study and the export potentials are shown in Figures 6.14 and 6.15. Figure 6.14 illustrates the economic costs related to Denmark’s energy consumption and production in Ref 2030 and in IDA 2030, respectively. In Figure 6.15, the business potential of IDA 2030 is shown, calculated as expected exports in 2030 and compared to the data of 2004.
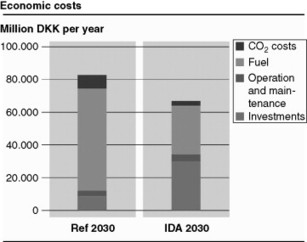
Figure 6.14 Economic costs of IDA 2030, the energy plan for 2030 of the Danish Society of Engineers.

Socioeconomic feasibility is calculated as annual costs, including fuel and operation, and annual investment costs based on a certain lifetime and interest rate. The feasibility study has been carried out with three different oil prices (as mentioned before), and the IDA 2030 alternative is compared with Ref 2030, assuming that the average oil price is applicable 40 percent of the time, while the low and high oil prices each are applicable 30 percent of the time.
Compared to Ref 2030, the IDA 2030 alternative converts fuel costs into investment costs and also has lower total annual costs. Such a shift in cost structure is very sensitive to two factors: the interest rate and the estimation of the size of total investment costs. Consequently, sensitivity analyses have been made. In the first analysis, the interest rate has been raised from 3 to 6 percent, and in the other, all investment costs have been raised by 50 percent. In both cases, the IDA 2030 alternative is competitive to the reference.
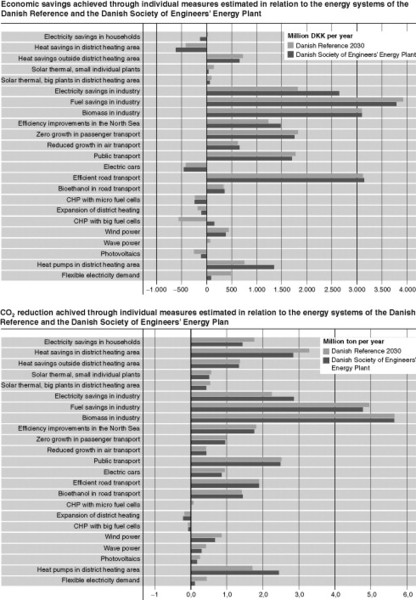
Figure 6.15 gives an indication of the export potential of IDA 2030. Such potential has been estimated on the basis of the Danish development of wind turbine manufacturing and is considered a very rough estimate. However, the estimate provides valuable information on both the different relevant technologies and the size of the total potential. The socioeconomic feasibility and the CO2 emissions of the two energy systems, Ref 2030 and IDA 2030, are shown in Figure 6.16. All measures have been evaluated marginally in both Ref 2030 and IDA 2030. As can be seen, the back-and-forth process has led to the identification of measures that are predominantly feasible. However, some proposals with negative feasibility results have been included in the overall plan for other reasons. Some have good export potentials, whereas others are important to be able to reach the final target of 100 percent renewable energy in the next step. And yet others have important environmental benefits.
The socioeconomic feasibility shown in Figures 6.14 and 6.16 is calculated for a closed system without any exchange of electricity on international markets. On the basis of such calculations, a separate study was conducted of the potential benefits of electricity exchange to assess whether the IDA 2030 energy system in such respects differed from the reference system Ref 2030. The evaluation was done for the three different fuel price levels and the two CO2 emission trade cost levels, as well as for the three Nordic hydropower circumstances: wet, normal, and dry years. The results are shown in Figure 6.17 in terms of socioeconomic net revenues for Danish society. Moreover, the diagram shows the import and export of each system: Ref 2030 and IDA 2030.
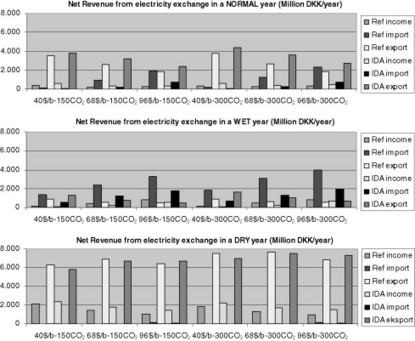
Figure 6.17 Net revenue from electricity exchange for Ref 2030 and IDA 2030 under different fuel prices, CO2 emission trading prices, and different hydro power circumstances: wet, normal, and dry years, which are determined by the hydropower reservoirs of the Nordic electricity supply system.
The net revenue from exchange is calculated in the EnergyPLAN model by comparing the results of a reference calculation of a closed system to the results of a calculation of an open system. The closed system has no exchange, while the open system benefits from exchange by selling electricity when the price exceeds the marginal production costs of the Danish energy system and buying electricity when the price is lower than the marginal costs. The modeling takes into consideration bottlenecks among the countries. The whole procedure of calculation is based on the assumption that each of the electricity production units optimizes its business-economic revenues.
As can be seen in Figure 6.17, Denmark will be able to profit from the exchange of electricity on the Nordic Nord Pool market in all situations. The net revenue is typically in the order of between 500 and 1000 million DKK/year. In years with low fuel prices and high electricity market prices, revenues are primarily earned from exporting, while in years with high fuel prices and low electricity prices, revenues are earned from importing electricity. It should be mentioned that not all combinations are equally probable. The electricity market price will, to some extent, follow the changes in the fuel price levels.
A comparison of the reference Ref 2030 and the IDA 2030 has been made by calculating the average net revenues during a period of years in which the following conditions occur:
- • Wet, normal, and dry years appear in the ratio 3:3:1.
- • Low, medium, and high fuel prices appear in the ratio 3:4:3.
- • Low and high CO2 emission trading prices appear in the ratio 1:1.
Based on such ratios, the average net revenues of the IDA 2030 system are 585 million DKK/year compared to 542 million DKK/year of the Ref 2030. Based on such an analysis, it is only fair to say that the two systems can benefit equally from the exchange of electricity on the Nord Pool market. However, compared to the total annual cost of 60 to 80 billion, the net revenue gained from the exchange of electricity is only marginal. The important economic benefits come from the fuel savings achieved by changing the system from the Ref 2030 to the IDA 2030.
To achieve a 100 percent renewable energy supply, the following additional initiatives were proposed by the steering committee, thus extending the IDA 2030 energy system and creating the IDA 2050 system:
- • Reduce heat demand in buildings and district heating systems by another 20 percent compared to the year 2030.
- • Reduce fuel demand in industry by another 20 percent
- • Reduce electricity demand by another 10 percent
- • Stabilize transportation demand at the 2030 level
- • Expand district heating by 10 percent
- • Convert micro CHP systems from natural gas to hydrogen
- • Replace oil and natural gas boilers by heat pumps and biomass boilers in individual houses
- • Replace 50 percent of road goods transportation with trains
- • Replace remaining fuel demand for transportation equally with electricity, biofuels, and hydrogen
- • Supply 3 TWh of industrial heat production from heat pumps
- • Replace all CHP and power stations with fuel cell–based, biogas, or biomass gasification
- • Supply 40 percent of heating demand of individual houses by solar thermal
- • Increase wave power from 500 to 1000 MW
- • Increase PV power from 700 to 1500 MW
The necessary wind power and/or biomass resources were calculated as residual resources and had to be increased, as described in the following.
The 100 percent renewable energy system for year 2050 (IDA 2050) has been calculated in more than one version. First, all the proposals just mentioned were simply implemented, which led to a primary energy supply consisting of 19 PJ of solar thermal, 23 PJ of electricity from RES (wind, wave, and photovoltaic), and 333 PJ of biomass fuels. In such a scenario, wind power is equal to the figure of the year 2030: 6000 MW installed capacity. A figure of 333 PJ of biomass fuels, however, may be too high. According to the latest official estimate, Denmark has approximately 165 PJ of residual biomass resources, including waste. Residual resources consist of straw that is not needed for livestock, biogas from manure, organic waste, and waste from wood industries. However, the potential of biomass fuels from the change of crops is huge. Denmark, for example, grows a lot of wheat that can be replaced by others crops such as corn, leading to a much higher biomass production while still maintaining the same output for food. Such reorganization of the farming areas together with a few other options may lead to a total biomass fuel potential as high as 400 PJ (Mathiesen, Lund, and Nørgaard 2008).
The analyses proposed a compromise with 10,000 MW of wind power and 270 PJ of biomass fuels. All three versions are shown in Figure 6.18. The energy flow of the system is illustrated in Figure 6.19, and the primary energy supply and the resulting CO2 emissions are shown in Figure 6.20.
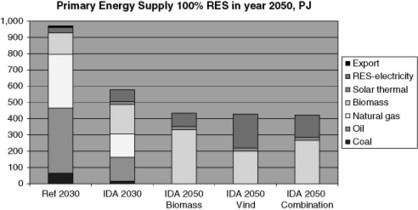
Figure 6.18 Primary energy supply for three versions of the 100 percent renewable energy system, IDA 2050, compared to the reference, Ref 2030, and the proposal for year 2030, IDA 2030.
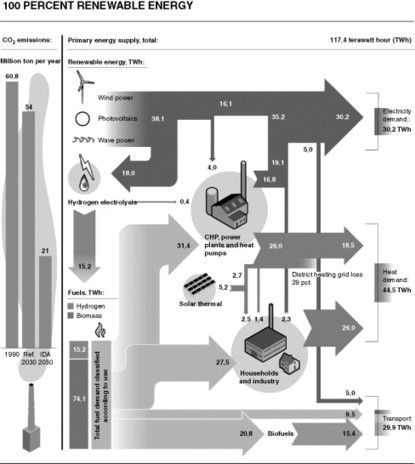
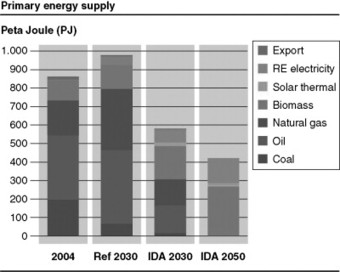
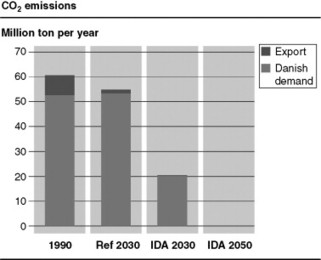
Figure 6.20 Primary energy supply and CO2 emissions. CO2 emissions are divided into domestic electricity demand and electricity net exports.
On the basis of the first version of the 100 percent renewable energy scenario, it was analyzed how much the need for biomass fuels would decrease if more wind power was added. If wind power is raised from 6000 MW to 15,000 MW, then a rise in electricity to 200 PJ will lead to a decrease in biomass fuel consumptions to 200 PJ. It should, however, be emphasized that such a replacement leads to a significant increase in the demand for hydrogen as an energy carrier, which results in considerable efficiency losses.
The primary energy supply is expected to increase from approximately 800 PJ in 2004 to nearly 1000 PJ in the “business-as-usual” reference (Ref 2030). If the proposed IDA 2030 plan is implemented, the primary energy supply will fall to below 600 PJ, and CO2 emissions will decrease by 60 percent compared to the year 1990.
If the 100 percent renewable energy system proposed for year 2050 (IDA 2050) is implemented, the primary energy supply will fall to approximately 400 PJ, and the CO2 emission will, in principle, be equal to zero. However, some waste is included in the biomass resources, of which some will result in a minor CO2 emission. Moreover, it should be mentioned that Denmark will still contribute to greenhouse gas emissions from gases other than CO2. In total, however, the Danish greenhouse gas emissions will decrease by approximately 80 percent.
4 Reflections
Reflections on the analyses of 100 percent renewable energy systems of this chapter are made with regard to principles and methodologies, as well as the implementation of renewable energy systems in Denmark and other countries.
Principles and Methodologies
From a methodology point of view, it can be concluded that the design of future 100 percent renewable energy systems is a very complex process. On the one hand, a broad variety of measures must be combined to reach the target, and on the other, each individual measure has to be evaluated and coordinated with the new overall system. Here, such a process has been implemented by combining a creative phase involving the inputs of a number of experts and a detailed analytical phase with technical and economic analyses of the overall system, providing feedback on the individual proposals. In a back-and-forth process, each proposal was formed in such a way that it combined the best of the detailed expert knowledge with the ability of the proposal to fit well into the overall system, in terms of technical innovation, efficient energy supply, and socioeconomic feasibility.
Conclusions and Recommendations
Based on the cases of the Los Angeles Community College district and Denmark, this chapter presented three studies on the challenges and perspectives of converting present energy systems into a 100 percent renewable energy system. The two studies of Denmark each includes two or three alternatives that are based on either biomass or wind power. The main data of all five alternatives are listed in Table 6.5. Seen in relation to the Danish case, the conclusion is that a 100 percent renewable energy supply based on domestic resources is physically possible and that the first step toward 2030 is feasible to Danish society.
Table 6.5 Main Data of the Five Alternative 100 Percent Renewable Energy Systems
| First Approach | IDA Energy Plan (IDA 2050) | ||||
|---|---|---|---|---|---|
| EV/H2FC | Biofuels | Biomass | Main | Wind | |
| Demands (TWh/year) | |||||
| Electricity | 37.0 | 37.0 | 30.2 | 30.2 | 30.2 |
| Heating (including process) | 56.8 | 56.8 | 44.5 | 44.5 | 44.5 |
| Transport (electricity) | 17.8 | — | 5.0 | 5.0 | 5.0 |
| Transport (biofuels) | — | 50.7 | 24.9 | 24.9 | 24.9 |
| Primary Energy Supply | |||||
| Biomass (PJ/year) | 180 | 325 | 333 | 270 | 200 |
| Solar thermal (PJ/year) | 8 | 8 | 19 | 19 | 19 |
| PV (GW installed) | 5 | 5 | 1.5 | 1.5 | 1.5 |
| Wave (GW installed) | — | — | 1 | 1 | 1 |
| Wind (GW installed) | 15 | 15 | 6 | 10 | 15 |
Both studies show that when reaching a high share of intermittent resources in combination with CHP and savings, the development of renewable energy strategies becomes a matter of introducing and adding flexible energy conversion and storage technologies and designing integrated energy system solutions. The first study identifies specific improvements of system flexibility as being essential to the conversion of the energy system into a 100 percent renewable energy system. First, oil for transportation must be replaced by other sources. Given the limitations of Danish biomass resources, solutions based on electricity become key technologies. Moreover, such technologies increase the potential of including wind power in the ancillary services of maintaining the voltage and frequency of the electricity supply.
The next improvement involves including small CHP stations in the regulation as well as adding heat pumps to the system. Such technologies are of particular importance because they provide the possibility of changing the ratio between electricity and heat demand while still maintaining the high fuel efficiency of CHP. And the third key point is to add electrolyzers to the system and, at the same time, create the basis for a further inclusion of wind turbines in the voltage and frequency regulation of the electricity supply.
Based on the implementation of these three key technological changes, the analyses of the first study show that the Danish energy system can be converted into a 100 percent renewable energy system when combining 180 TJ/year of biomass with 5000 MW of PV and between 15 and 27 GW of wind power. In the reference, 27 GW of wind power is necessary, while in combination with savings and efficiency improvements, the needed capacity is reduced to around 15 GW. Thus, the first study emphasizes the importance of implementing energy conservation as well as efficiency improvements in the supply sector.
In the first study, electric or hydrogen fuel cell vehicles are introduced in the entire transport sector. If such a solution is replaced with biofuel-based transport technologies, the need for biomass resources may be nearly doubled. Consequently, the first study also emphasizes the importance of further developing electric vehicle technologies. Moreover, it indicates that biofuel transport technologies should be reserved for the areas of transportation in which the electricity/hydrogen solution proves insufficient.
The second study goes a step further, especially with regard to energy conservation and the design of a coherent transport solution. The study suggests the implementation of energy conservation measures at a high level, and, as a consequence, energy demands decrease compared to the first study. On the other hand, the transportation technologies applied in the second study are much more differentiated and include the combination of electric vehicles as well as biofuel technologies, which increase the demand compared to the first study. With regard to the design of a suitable transportation solution, it must, however, be emphasized that both studies are far from coherent or optimized. Nevertheless, the studies do provide a sufficient overview of the principal possibilities.
The second study shows that Denmark can be converted into a supply of 100 percent renewable energy constituted by 280 PJ/year of biomass, 19 PJ of solar thermal, 2500 MW of wave and PV, and 10,000 MW of wind power. Moreover, the study shows how biomass resources can be replaced by more wind power, and vice versa, and points out that Denmark will have to consider to which degree the country shall rely mostly on biomass resources or on wind power. The solution based on biomass will involve the use of present farming areas, while the wind power solution will involve a large share of hydrogen or similar energy carriers leading to certain inefficiencies in the system design.
1 Excerpts reprinted from Energy, 32/6, Henrik Lund, “Renewable Energy Strategies for Sustainable Development,” pp. 912-919 (2007), with permission from Elsevier.
2 Excerpts reprinted from Energy, 34/5, Henrik Lund & Brian Vad Mathiesen, “Energy System Analysis of 100 Percent Renewable Energy Systems,” pp. 524-531 (2009), with permission from Elsevier.