Chapter 5 Analysis Large-Scale Integration of Renewable Energy
The large-scale integration of renewable energy sources into existing energy systems must meet the challenge of coordinating fluctuating and intermittent renewable energy productions with the rest of the energy system. Meeting this challenge is essential, especially with regard to electricity production, since electricity systems depend on an exact balance between demand and supply at any time. Given the nature of photovoltaic (PV), wind, wave, and tidal power, little can be gained by regulating the renewable source itself. Large hydropower producers are an exception, since such units are typically well suited for electricity balancing. However, in general, the possibilities of achieving a suitable integration are to be found in the surrounding supply system—that is, in power and CHP stations. The regulation in supply may be facilitated by flexible demands—for example, heat pumps, consumers’ demand, and electric boilers. Moreover, the integration can be helped by different energy storage technologies.
This chapter examines and deduces the essence from a series of studies in which the EnergyPLAN model has been applied to the analysis of large-scale integration of renewable energy sources (RES) into the Danish energy system. At present, the Danish energy system already has a relatively high share of renewable energy and is therefore suitable for the analysis of further large-scale integration. The studies conducted address the integration of RES into future energy systems. The analyses are based on official projections of the Danish energy system made by the Danish Energy Authority in 2001. The projections are presented in the beginning of this chapter.
In addition to the presentation of these studies, the chapter presents a method for comparing different energy systems in terms of their ability to integrate RES on a large scale. The question in focus is how to design energy systems with a high capability of utilizing intermittent RES, also considering the problem that the fluctuations and intermittence of, for example, wind power differ from one year to another. Such a challenge is met by analyzing and illustrating different energy systems in so-called excess electricity diagrams. In these diagrams, a curve represents the system in all of the years, regardless of the fact that the fluctuations of RES differ from one year to another.
A number of studies of large-scale integration of RES are presented and, finally, some reflections and conclusions sum up the chapter with regard to the methodologies and principles as well as the technical measures involved. This leads to a series of recommendations concerning the most feasible technical measures, how to combine the measures, and when to use them considering the share of RES in the system.
1 The Danish Reference Energy System
The different analyses of large-scale integration of renewable energy presented in this chapter are all based on a projection of the future Danish energy supply by the year 2020. In 2001, at the request of the Danish Parliament, the Danish Energy Authority formed an expert group for the purpose of investigating and analyzing possible means and strategies for managing the problem of excess electricity production from CHP and RES (Danish Energy Authority 2001). According to the official Danish Energy Policy of that time, as expressed in the government’s energy plan, Energy 21 (Danish Ministry of Environment and Energy 1996), the share of CHP and especially the share of wind power were expected to increase.
The expert group defined the two terms exportable excess electricity production (EEEP) and critical excess electricity production (CEEP).1 EEEP can be exported, while CEEP refers to a situation in which the electricity produced exceeds both the demand and the export capacity of transmission lines out of the system (Denmark). This situation must be avoided so the electricity system will not collapse. Based on such definitions, the expert group defined a reference scenario showing the resulting development in both CEEP and EEEP if expansions in CHP, wind power, and demands were to be implemented according to the official energy policy. Three years—2005, 2010, and 2020—were chosen for the analysis.
At present, the Danish electricity system is divided into two separate geographical areas: East Denmark and West Denmark. Excess electricity production can arise in one area without being present in the other. The Danish government has decided to connect the two systems, but this decision was not final at the time when the projection was done. Consequently, they decided to analyze each area separately. The reference system is characterized by the following development:
- • The Danish electricity demand is expected to rise from 35.3 TWh in 2001 to 41.1 TWh in 2020—equal to an annual rise of approximately 0.8 percent.
- • The installed capacity of wind power is expected to rise from 570 to 1850 MW in East Denmark and from 1870 to 3860 MW in West Denmark from 2001 to 2020. The increase is primarily due to the expected implementation of one 150 MW offshore wind farm each year.
- • Existing large coal-fired CHP steam turbines are to be replaced by new natural gas–fired combined cycle CHP units when the lifetime of each of the old CHP stations runs out. Additionally, distributed CHP stations and industrial CHPs are due for a small expansion.
Denmark has quite good transmission line capacities to its neighboring countries. Thus, East Denmark is connected to Sweden (1700 MW AC) and East Germany (600 MW DC), and West Denmark is connected to North Germany (1200 MW AC), Sweden (600 MW DC), and Norway (1000 MW DC). When defining CEEP, the capacities of all the existing transmission lines were included apart from the AC connection to North Germany, as this area has a very high wind power production and has similar excess production problems during the same hours as West Denmark.
Based on the preceding assumptions, the expert group evaluated the magnitude of the expected excess electricity production problem divided into EEEP and CEEP. The result of the analysis is shown in Table 5.1. In the reference scenario, excess electricity production is expected to increase considerably in the period toward the year 2020. The expected excess production of 1680 GWh in East Denmark equals 11 percent of the demand in 2020. In West Denmark, excess production equals 28 percent of the demand in 2020. The expectations of high excess production illustrated in Table 5.1 can be explained mainly by two assumptions. First, in the reference scenario, small- and medium-scale CHP stations were not expected to regulate according to fluctuations in wind power but solely according to heat demands. In Denmark, CHP stations have been paid through a triple tariff system with high payments in the morning and the afternoon, reflecting a high electricity demand during these periods, and low payments during night hours, weekends, and holidays.
Table 5.1 Expected Excess Electricity Production in the Danish Reference Scenario Defined in 2001
| Reference Scenario GWh | 2000 | 2005 | 2010 | 2020 |
|---|---|---|---|---|
| East Denmark | ||||
| Exportable Excess Electricity Production (EEEP) | 2 | 190 | 460 | 1680 |
| Critical Excess Electricity Production (CEEP) | 0 | 0 | 0 | 0 |
| Total | 2 | 190 | 460 | 1680 |
| West Denmark | ||||
| Exportable Excess Electricity Production (EEEP) | 520 | 3130 | 3360 | 5070 |
| Critical Excess Electricity Production (CEEP) | 0 | 170 | 290 | 1330 |
| Total | 520 | 3300 | 3650 | 6400 |
Consequently, Danish CHP has been designed with relatively high CHP capacities and heat storage, making it possible to produce mainly during high-tariff periods. When electricity sales prices are high, the CHP unit operates at full capacity and stores the heat. When prices are low, the CHP unit stops, and heat for district heating is supplied from the storage. By 2001, this regulation ability had not been used to integrate fluctuations in renewable energy. It had only been used to adjust to changes in electricity demand by applying the so-called triple tariff. This means that production is given a low, medium, or high price, depending on production conditions—in other words, whether or not production takes place during peak-load.
The second assumption behind the resulting high excess production is that the task of securing grid (voltage and frequency) stability has been managed solely by large power stations. Consequently, distributed production from small CHP units and wind turbines was considered a burden to the fulfillment of this task. As part of the study, the EnergyPLAN model was used to conduct some analyses of how to avoid excess production problems (Lund and Münster 2001; 2003b).
Most of the analyses in the coming sections of this chapter apply to West Denmark. However, because it was later decided to connect the two Danish systems, some analyses were based on a joint reference system including all of Denmark. Moreover, the work of the expert group only included analyses of the electricity system. Consequently, data for the remaining sectors, including the transport sector, have been added on the basis of the official Danish energy plan, Energy 21 (Danish Ministry of Environment and Energy 1996).The main data of the joint reference scenario are given in Table 5.2.
Table 5.2 Reference Energy System: Denmark, 2020
| Key Data | |
|---|---|
| Electricity demand | 41.1 TWh/year |
| District heating demand | 30.0 TWh/year |
| Excess electricity production (CEEP+EEEP) | 8.4 TWh/year |
| Primary Energy Supply | |
| Wind power | 17.7 TWh/year |
| Fuel for CHP and power stations | 92.3 TWh/year |
| Fuel for households | 19.7 TWh/year |
| Fuel for industry | 20.2 TWh/year |
| Fuel for transport | 50.7 TWh/year |
| Fuel for refinery and so forth | 17.4 TWh/year |
| Total | 218.0 TWh/year |
Electrification of Transport Scenario
Several of the studies presented in this chapter include the conversion of parts of the transport fleet into electric vehicles in combination with hydrogen fuel cell vehicles. All of the studies are based on a scenario described by Risø National Laboratory, Electric Vehicles and Renewable Energy in the Transport Sector—Energy System Consequences (Nielsen and Jørgensen 2000). This report concludes that the technical performance—in particular, the range—of battery cars and hydrogen fuel cell cars will gradually improve in the coming decades, making it feasible to replace a substantial part of the transportation task of passenger cars and small delivery vans below 2 tons by these types of cars. By the year 2030, 80 percent of the Danish vehicles weighing less than 2 tons are to be replaced by a combination of BEVs (battery electric vehicles) and HFCVs (hydrogen fuel cell vehicles). According to the study, such a transformation will lead to a rise in the electricity consumption by 7.3 TWh/year and fuel savings by 20.8 TWh/year. When applied to West Denmark, an alternative system has been defined in which 12.6 TWh of gasoline is replaced by 4.4 TWh of electricity, equal to the share of West Denmark.
2 Excess Electricity Diagrams2
This section is based on Lund’s (2003a) article “Excess Electricity Diagrams and the Integration of Renewable Energy,” which presents a method for demonstrating the ability of a given energy system to use specific RES in the electricity supply. In the article, the method is applied to the large-scale integration of wind, PV, and wave power into a future Danish reference energy system. The RES integration potential is expressed in terms of the ability of the system to avoid excess electricity production. The different energy sources are analyzed according to an electricity production ranging from 0 to 100 percent of the electricity demand. The analyses have taken into account the fact that certain ancillary services are needed to secure the grid stabilization (voltage and frequency) of the electricity supply system. As a conclusion, excess electricity diagrams show the different patterns of each of the RES. As we shall see, such diagrams are capable of showing the general characteristics of a given system even though the fluctuations of RES differ from one year to another.
The analyses that follow were made for West Denmark in 2020, as described in the previous section. For such reference energy systems, the ability to integrate a fluctuating RES can be illustrated in diagrams, as shown in Figure 5.1. In this diagram, the resulting annual excess production is given for the system as a function of the share of wind power, assuming that wind power has exactly the same hourly distribution as it did in West Denmark in 2001.
Figure 5.1 Excess electricity production diagram for the reference energy system, West Denmark, 2020.
Figure 5.1 is based on a series of 1-year complete energy system analyses of the system using the EnergyPLAN model. Each analysis includes hour-by-hour calculations of all electricity productions and demands given the specified production units and regulation strategies. Based on such calculations, annual electricity productions are identified including excess electricity production defined as the difference between the total electricity production and the demand. In the case of Figure 5.1, the system was first analyzed for a wind power input of 0 TWh/year. Then the input was raised in steps of 5 TWh/year up to 25 TWh/year.
The x-axis shows wind power production between 0 and 25 TWh, equal to a variation from 0 to 100 percent of the demand (24.87 TWh). In addition, the y-axis shows excess production in TWh. The lower the excess production, the better the integration of RES. In the article and in Figure 5.1, the analysis has been made with the following restrictions in ancillary services to achieve grid stability (voltage and frequency): At least 30 percent of the power (at any hour) must come from power production units that are capable of supplying ancillary services. At least a 350 MW running capacity of large power stations must be available at any moment. Distributed generation from CHP and RES is not capable of supplying ancillary services. As can be seen, the excess production in such system is substantial.
In Lund’s article, it was analyzed how the resulting excess electricity curve varies with the wind power production from one year to another. The same kind of analysis is made for PV and wave power. The hour-by-hour distributions of the different RES have been based on actual measurements whenever possible. In the case of PV, data based on actual measurements have been available. The distribution of electricity production derives from the Danish Sol300 project. The project involves 267 PV systems installed in typical one-family houses at eight locations in Denmark beginning in 2000. Distribution data have been provided for two years, as illustrated in Figure 5.2.
Figure 5.2 Hourly distributions of photovoltaic electricity production in the Danish Sol300 project.
For onshore wind power, which has existed in Denmark for many years, the distribution is based on the actual production of wind turbines located in the reference area: West Denmark. Such data have been provided by the TSO (transmission system operator) company of the region. Three years have been analyzed, and the data are shown in Figure 5.3.
Figure 5.3 Hourly distributions of electricity production from onshore wind power in West Denmark (actual measurements of electricity production).
Data based on actual measurements are not yet available for Danish wave power. So far, wave power stations in Denmark have existed only as small test facilities. The distribution of wave power is therefore made on the basis of wave measurements in the North Sea off the west coast of Denmark. Distribution data have been provided for two years, as illustrated in Figure 5.4. Lund’s article describes in more detail the sources of the data for all three types of RES.
Figure 5.4 Estimated hourly distributions of electricity production from wave power based on wave measurements in the Danish North Sea.
When you look at Figures 5.2, 5.3, and 5.4, two things are obvious. First, the electricity productions from all three types of fluctuating RES evidently differ from one year to another. When comparing a specific hour of the same specific date of each of the two years, one may find that wind power production is high in 2000 and low in 2001. The same applies to the other two types of sources. However, even though the production differs, some main characteristics can be found and an overall picture can be identified. Thus, looking at these figures, it is quite easy to distinguish between wave and wind power.
Excess electricity production diagrams have been made for the three types of sources and the years shown in Figures 5.2–5.4. Moreover, a “synthetic” PV year is analyzed on the basis of statistically typical numbers and distributions of solar power in Denmark—the so-called Test Reference Year. The results of the different RES are shown in Figure 5.5. In general, PV is the RES that generates the highest excess production, followed by wave power and onshore wind power in the analyzed system.
Figure 5.5 Excess electricity diagrams for different years, showing hourly distribution of electricity productions from wind, wave, and photovoltaic power.
The analysis revealed one important fact: It was discovered that even though significant variations can be seen from one year to another, the results in terms of excess production curves are almost exactly the same for each of the individual RES. This discovery is important because the excess electricity diagrams may then serve as an illustration of the ability of a system to integrate fluctuating RES, which does not depend on the difference in fluctuations between the different years. Consequently, the distribution of wind power of all years can be shown by the same curve. This makes it possible to compare different energy systems in terms of their ability to integrate RES on a large scale by comparing two curves in the same diagram. Depending on whether a year is good or bad in terms of wind, one may have to go a bit up or down the curve from one year to another, but it is still the same curve.
The only curve that differs in Figure 5.5 is the curve of the synthetic PV, which shows an excess production slightly higher than the two curves based on actual measurements. This is due to the fact that the actual measurements include an element of correlation between the many locations, whereas the synthetically generated distribution, in principle, assumes all installations to be located on the same spot. This emphasizes the importance of using measurements and not synthetic data. Actual data that reflect the dispatched locations of distributed RES are better than both actual measurements of one location and synthetic data. This also indicates that the result of the synthetic wave power data may provide a minor overestimation of the excess production.
In Figure 5.6, a curve representing 2001 is shown for the three different types of RES and compared to one another. As can be seen, the curves representing PV are a little higher than the two others.

Figure 5.6 Excess electricity diagram comparing wind, wave, and photovoltaic power fed into the same energy system.
The methodology of excess electricity diagrams does not only apply to the preceding reference system but to radically different systems as well. In Figure 5.7, the same diagrams are shown for two systems (which will be elaborated on in Chapter 6): a Danish Business as Usual Reference system year 2030 (BAU 2030) and a radical change in design prepared by the Danish Society of Engineers (IDA 2030). Both systems have been analyzed in the EnergyPLAN model for three different wind years: namely Wind 1996, Wind 2000, and Wind 2001. As can be seen, the differences in wind years only result in marginal changes in the excess electricity diagrams compared to the impacts of changing the system from BAU 2030 to IDA 2030. Thus, Figure 5.7 illustrates how such excess electricity diagrams can compare different energy systems in terms of their ability to use fluctuating sources such as wind. More important, such illustration does not change from one year to another even though the fluctuations in wind production do change.
3 Optimal Combinations of RES3
This section is based on Lund’s (2006b) article “Large-Scale Integration of Optimal Combinations of PV, Wind, and Wave Power into the Electricity Supply,” which presents the results of a series of analyses of large-scale integration of wind, PV, and wave power into the Danish energy system. It is based on the same data as already presented in Figures 5.2–5.4, and, again, the reference used is the projection of the future energy system in West Denmark by 2020. The idea is to use the different patterns in the fluctuations of different renewable sources, and the purpose is to identify optimal combinations of RES from a technical point of view.
The analysis is made on the basis of hourly distributions beginning in 2001, since data are available for all three types of RES in that year. By basing the analysis on the same year, any correlation between, for example, wind and waves is included in the study. The results are shown in curves of excess electricity production generated by increasing RES inputs. Results have been generated for each of the different RES and for relevant combinations to identify an optimal mixture. It should be added that an electricity production from a singular RES that equals 100 percent of the demand is hard to imagine in practice, especially for such technologies as PV and wave power. For example, an annual production of 25 TWh from PV requires approximately 25,000 MWp installed capacity, which is not financially or practically realistic. The same applies to wave power. Moreover, such an amount of RES is not likely to be added to the reference system without improving the integration ability of the system and thereby decreasing excess production. Such improved systems are discussed in more detail later in this chapter. The analysis constitutes a valid illustration of the differences among the three different RES and serves as an important basis for the identification of optimal combinations.
The optimal combinations of two types of RES technologies are shown in Figure 5.8, along with the annual excess electricity production for the combination of onshore wind and PV power. The excess production generated has been calculated with different inputs of total electricity from RES. This is illustrated by the curves starting with a total of 5 TWh and rising in steps of 5 TWh to a total of 25 TWh. Each curve shows the resulting excess production of different shares of PV and wind power.
To the left of Figure 5.8, the share of PV is zero, and to the right, the share of PV is 100 percent. All curves show an optimal combination in which excess production is minimal. An optimal combination is achieved with a PV share of 20 percent when the total RES electricity production is high and 40 percent when the total production is low. In the same way, optimal combinations of PV, onshore wind, and wave power have been identified. Figure 5.9 shows the optimal combination of the three RES—that is, the combination that generates minimum excess electricity production.
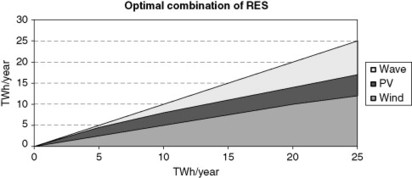
Figure 5.9 Optimal combination of the renewable sources—that is, the combination of minimum excess production.
In Figure 5.10, the excess electricity diagram of the optimal combination (Optimix) is compared to the results of each of the different RES technologies, assuming that the same production is to come from only one type of RES. In general, PV is the RES with the highest excess production, followed by wave power and onshore wind power. The optimal combination of the three types of RES results in less excess production.
Figure 5.10 illustrates how the combination of different sources reduces the integration problem. However, the excess production is still considerable. It should be emphasized that a very high percentage of RES can be integrated into the electricity supply without any excess production if other measures are implemented, such as flexible energy systems (see the next sections of this chapter). Figure 5.10 shows how a certain combination of RES units will enhance the effect of such implementation strategies.
The result illustrates how excess production increases when the RES input in terms of wind, PV, and wave power is raised. Meanwhile, combinations of different RES can slow down the increase in excess production. For example, an optimal combination of 20–40 percent PV and consequently 60–80 percent wind power has been found to generate less excess production than 100 percent of either PV or wind power alone.
As can be seen from Figure 5.9, the optimal mixture seems to be reached by an onshore wind power production of approximately 50 percent of the total renewable electricity production. Meanwhile, the optimal mixture between PV and wave power seems to depend on the total amount of electricity produced by RES. When the total RES input is below 20 percent of the demand, PV should cover 40 percent and wave power only 10 percent. When the total input is above 80 percent of the demand, PV should cover 20 percent and wave power 30 percent. The combination of different RES as the only measure is far from a solution to the RES integration problem. Other measures such as investment in flexible energy supply and demand systems and the integration of the transport sector have a much higher potential for solving the problem.
4 Flexible Energy Systems4
This section is based on Lund’s (2003b) article “Flexible Energy Systems: Integration of Electricity Production from CHP and Fluctuating Renewable Energy,” which discusses and analyzes different national strategies for large-scale integration of renewable energy. It points out key changes required in the energy system to benefit from a high percentage of wind and CHP without generating excess electricity production. Here, the altered system is referred to as a flexible energy system.
This study was made prior to the work of the Energy Authority’s expert group mentioned previously. Thus, the study is not based on exactly the same reference scenario. However, the study used the expected development of the official Danish energy policy expressed in the government’s energy plan, Energy 21, as a reference, and this reference is very similar to the previous one. According to Energy 21, the rate of wind power is expected to increase to approximately 50 percent in 2030, and excess production is expected to increase accordingly and create serious problems to the regulation of the electricity supply. The magnitude of the problem is illustrated in Figure 5.11.
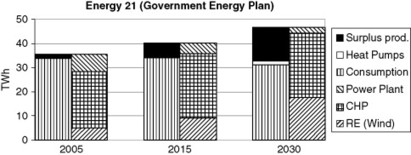
Even though electricity consumption is expected to decrease slightly, production has to increase substantially. In 2030, excess production is expected to constitute 80 percent of the electricity production from wind and other renewable resources. The implementation of the Danish energy policy according to Energy 21 is based on three initiatives: energy conservation resulting in slightly decreasing electricity consumption, the integration of more renewable energy sources, and the efficient use of fuels by CHP. The fluctuations in demand and production resulting in excess production are, in principle, the result of applying these three means at the same time. The fact that a high level of excess electricity production is expected, as illustrated in Figure 5.11, can be specifically explained by the assumptions that (1) the small and medium-sized CHP stations are not expected to regulate according to fluctuations in wind power but solely according to heat demands, and (2) the task of securing grid stability (voltage and frequency) is managed solely by large power stations.
Figure 5.11 illustrates an important condition—namely, that the excess production problem changes radically during the period. In 2005, excess production was much lower than the production from condensing power stations. This means that, in principle, the problem can be solved solely by moving and/or storing electricity—in other words, by using energy storage technologies, as defined in Chapter 1. In 2030, on the other hand, excess production is expected to be much higher than the production from condensing power stations, which means that moving and/or storing production cannot solve the problem. In that case, other sorts of changes are needed, such as energy conversion technologies, as defined in Chapter 1.
The reference was modeled in the EnergyPLAN model, and the results are shown in Figure 5.12. The diagrams show the implementation of the Energy 21 reference from Figure 5.11 in four weeks representing winter, spring, summer, and autumn. Consumption is shown to the left and production to the right. “Export” represents excess production. Figure 5.12 illustrates how excess electricity production is mainly the result of combinations of wind power and CHP. Meanwhile, the constraints of maintaining grid stability sometimes require that power stations without CHP produce in periods with excess production and thus add to the problem. Figure 5.12 shows that the excess electricity production problem is substantial all year round.
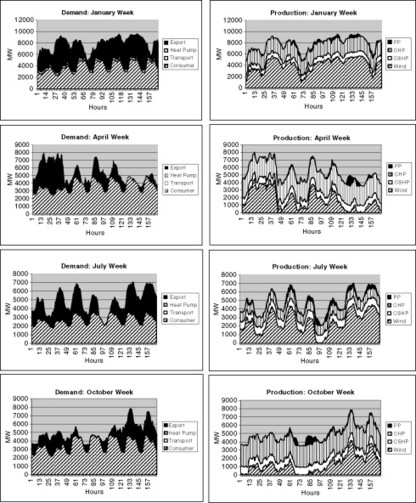
Figure 5.12 Excess production (export) in energy plan, Energy 21. (PP = power plants; CSHP = industrial combined steam and heat power.)
Flexible Energy System
The EnergyPLAN model has analyzed a number of various investment and regulation means to find suitable designs of flexible energy systems. The following initiatives seem to be the most important ones:
- Regulation of CHP: The fact that CHP stations are not expected to regulate according to fluctuations in wind power but solely according to heat demand is significant to the size of the excess electricity production problem shown in Figures 5.11 and 5.12. Consequently, an alternative regulation strategy has been analyzed in which CHP stations are partly replaced by heat production from boilers in case of excess electricity production. This change in strategy can solve the problem in the beginning of the period, when the problem is small. Meanwhile, the benefit of using CHP decreases, and the result is lower fuel efficiency (the rate of fuel per unit of heat and electricity produced increases).
- Investments in heat pumps and heat storage capacity: Adding heat pumps to the systems means that they can be used instead of boilers to restore fuel efficiency. Additionally, the energy system becomes much more flexible in more than one way. First, using heat pumps can decrease excess electricity production. Second, by replacing CHP heat production by heat pumps, the flexibility of the CHP stations is increased as long as the capacity is maintained. Third, by adding heat storage capacity to the system, the flexibility is further increased. This flexibility can solve most of the excess electricity production problems. Meanwhile, situations in which the production from big power stations is needed to maintain grid stability will arise more often and limit the decrease in excess electricity production.
- Grid-stabilizing CHP and wind power: The task of securing grid stability (voltage and frequency) has so far been managed only by large power stations. Consequently, distributed production from small and medium-sized CHP units and wind power may become a burden and may set a limit to the fulfillment of this task. This limit can be overcome by involving distributed production units in securing grid stability.
The following flexible energy system has been analyzed using the EnergyPLAN model:
- • The CHP units in the energy system are supplemented by heat pumps equal to approximately 1000 MW of electric power in 2030 and heat storage capacity equal to the heat consumption of approximately 1 day.
- • CHP units and heat pumps are operated according to a strategy of meeting the difference between demand and wind power production.
- • All CHP units and wind turbines built after 2005 are involved in securing grid stability.
The result of implementing this system is shown in Figure 5.13. Fuel efficiency is maintained, while most of the excess electricity production has been avoided.

Flexible Energy Systems Including Electricity for Transport
As the percentage of wind power increases, it becomes more and more difficult for flexible energy systems, based on CHP, heat pumps, and heat storage, to manage excess electricity production. Sooner or later, further initiatives will have to be taken. Electrification of the transport sector results in better flexibility and, at the same time, improves fuel efficiency. The analyses used an earlier version of the EnergyPLAN model in which the modeling of transport was not a specific subject. However, it was possible to do a modeling of flexible electricity demands arising from the use of electricity for transport (batteries and/or hydrogen). Such demands were assumed to be evenly distributed over the year but could be made flexible within shorter periods of time.
The EnergyPLAN model has evaluated the possibilities of integrating the transport sector into the energy system. By 2030, 80 percent of the Danish vehicles weighing less than two tons will be replaced by a combination of BEV (battery electric vehicles) and HFCV (hydrogen fuel cell vehicles), leading to a rise in the electricity consumption by 7.30 TWh/year and fuel savings by 20.83 TWh/year.
The electricity transport scenario has been analyzed along with the preceding flexible energy systems based on CHP, heat pumps, and heat storage. The results of the analysis are shown in Figures 5.14 and 5.15. In the analysis shown, electricity for transport has been made flexible within a period of 1 day. Figure 5.14 illustrates how excess electricity production is nearly removed, even in 2030. Figure 5.15 shows how consumption and production are balanced by regulating CHP and heat pumps together with the use of electricity for transport for a period of 4 weeks.
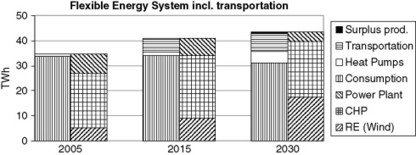
Figure 5.14 Electricity balance when implemented by flexible energy systems, including electricity for transportation.
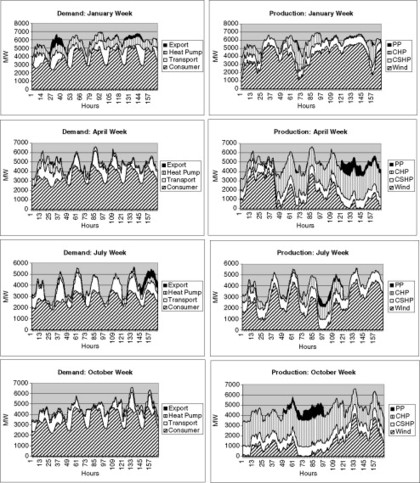
Figure 5.15 Excess electricity production (export) when implemented with flexible energy systems, including transportation. (PP = power plants; CSHP = industrial combined steam and heat power.)
When the official Danish energy plan, Energy 21, was launched in 1995, Denmark’s main policy was to export the problem simply by selling future excess productions on the European electricity market. However, Europe cannot solve the total problem if every individual country adopts the same policy. Furthermore, Denmark has to face problems of low revenues and high investments in transmission lines and meet agreements of reducing CO2 emissions. The introduction of flexible energy systems can solve the problem of integrating fluctuations from a high percentage of renewable energy and distributed CHP production. The key factors of this solution seem to be the following:
- • Making CHP stations operate according to fluctuations
- • Investing in heat pumps and heat storage capacity
- • Integrating small CHP stations and wind power when securing grid stability
• Integrating the electricity sector and the transport sector by introducing electric vehicles (battery and hydrogen)
By introducing such flexible energy systems to reduce the export of excess electricity production, fuel consumption and CO2 emissions in Denmark are reduced accordingly. In the case of integrating the transport sector by converting to battery and hydrogen vehicles, the total reduction in fuel consumption is very high because of the low efficiencies of vehicle combustion engines.
5 Different Energy Systems5
This section is based on Lund’s (2005) article “Large-Scale Integration of Wind Power into Different Energy Systems.” Earlier in this chapter, excess electricity diagrams were presented for the integration of renewable energy into a reference energy system of West Denmark, 2020. Here, the same reference system is compared to other energy systems, and excess electricity diagrams are supplemented by CO2 emission reduction diagrams, and the impacts of adding flexible technologies are presented. Thus, the article discusses the abilities of different energy systems and regulation strategies to integrate wind power.
In this article, the reference system has been defined as the present regulation adjusted by a number of measures that may be introduced to avoid critical excess production. Thus, the reference regulation can be described as follows:
- • All wind turbines produce according to fluctuations in the wind.
- • All CHP stations produce according to heat demand (or triple tariff).
- • Only large power stations participate in the task of balancing supply and demand and securing grid stability.
- • Minimum 300 MW and minimum 30 percent of the production must come from grid-stabilizing power stations.
- • Critical excess electricity production (CEEP) is avoided by applying the following priorities: (1) replacing CHP with boilers, (2) using electric heating, and (3), if necessary, stopping the wind turbines.
Such a reference system has been compared to the following three alternative energy systems:
- 50 percent more CHP: In the reference system, 21.21 TWh equaling approximately 50 percent of the total Danish heating demand is produced by CHP. An alternative system has been defined in which the share of CHP is increased by 50 percent to 31.82 TWh.
- Fuel cell technology: Improvements of electric efficiencies in CHP units and power stations (as, for example, fuel cells) increase the efficiency and consequently decrease the fuel consumption. An alternative system has been defined by raising CHP electricity efficiencies from the average of 38 to 55 percent and power station efficiencies from 50 to 60 percent.
- Electrification of cars: Based on the study of the electrification of cars (partly battery and partly hydrogen fuel cell vehicles), an alternative system has been defined in which 12.6 TWh of gasoline can be replaced by 4.4 TWh of electricity.
The results of the analyses of the alternative systems are shown in Figure 5.16. The diagram illustrates how improvements in terms of more CHP (50 percent CHP) and better efficiencies (fuel cell) accelerate the excess production problem, while the electrification of cars (transport) decreases this problem. At the starting point, without any wind power, all improvements decrease CO2 emissions compared to the reference energy system. However, along with the increase of wind input, only the electrification of cars maintains a good CO2 reduction ability.
Figure 5.16 Excess electricity production and domestic CO2 reduction in the three alternative energy systems compared to the reference.
If all three alternative improvements in Figure 5.16 are combined, the excess production becomes severe even in the case of no wind power. The ability of such a system to integrate wind power has been compared with a number of alternative regulations. These are based on the principle that small CHP units are involved in the grid stabilization task and that such CHP units operate to integrate wind power by reducing their electricity production at hours of excess production. Three variants replacing heat production by other devices have been analyzed:
- • CHPregB: Boilers replace CHP heat production.
- • CHPregEH: Electric heaters (boilers) replace CHP heat production.
- • CHPregHP: Heat pumps replace CHP heat production.
Figure 5.17 shows the results of adding alternative regulation systems to the reference system shown in Figure 5.16. Figure 5.17 shows how important it is to involve the CHP units in the regulation. This measure alone decreases excess production radically. Meanwhile, if the CHP units are replaced by boilers (CHPregB), fuel efficiency is decreased and the potential for reducing CO2 emissions is not fully exploited. Adding electric heating to the system (CHPregEH) does not solve the problem, but the introduction of heat pumps (CHPregHP) makes it possible to decrease excess production and, at the same time, maintain fuel efficiencies.
Figure 5.17 Excess electricity production and domestic CO2 reduction of the three alternative regulation systems applied to the reference energy system.
Figure 5.18 shows the results of adding the same alternative regulations to a system in which all three system changes presented in Figure 5.16 are implemented—that is, both increasing CHP and introducing fuel cells and electricity for transport. Again, the diagram shows how important it is to involve the CHP units in the regulation.
Figure 5.18 Excess electricity production and domestic CO2 reduction of the three alternative regulation systems applied to the alternative energy system including an increase in CHP as well as the introduction of fuel cells and electricity for transport.
Together, the results of Figures 5.17 and 5.18 confirm the results of the analysis of flexible energy systems and show that such a conclusion is also valid for the three other systems. Moreover, the article illustrates how different energy systems can be compared to one another in the same diagram in terms of their ability to integrate RES on a large scale.
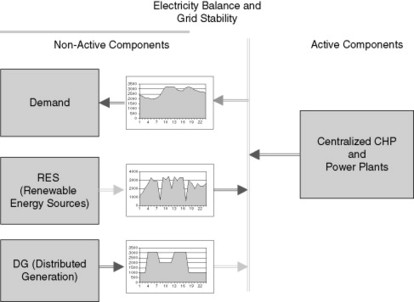
6 Grid Stability6
This section is based on Lund’s (2004) article “Electric Grid Stability and the Design of Sustainable Energy Systems,” which analyzes the significance of including future distributed CHP and renewable power production units in the task of grid stabilization—that is, securing voltage and frequency stability of the electricity supply. Today, in most countries, electricity is produced either from hydropower or large steam turbines on the basis of fossil fuels or nuclear power. Electricity from distributed generation constitutes only a small part of the production. Until now, the tasks of balancing supply and demand and securing frequency and voltage on the grid are managed only by such large production units.
However, the implementation of cleaner technologies, such as renewable energy, CHP, and energy conservation, is necessary to secure future renewable energy systems. Consequently, such distributed production units sooner or later need to contribute to the task of securing a balance between electricity production and consumer demands. The article presents technical designs of potential future flexible energy systems, which will be able both to balance production and demand and to fulfill voltage and frequency stability requirements to the grid. Again, the analysis is based on the reference scenario for West Denmark by the year 2020.
Figure 5.19 shows the starting point of the analysis. The task of securing a balance between electricity production and consumer demand has so far only been managed by large power stations. However, small-scale CHP units have the technical potential for solving some of the balancing problems. When the analysis was made, small and medium-sized CHP stations did not participate directly in balancing wind power in Denmark. These stations, however, did contribute to the balancing of fluctuations in the demand. CHP stations have been paid through a triple-tariff system, with high payment between morning and late afternoon, reflecting a high electricity demand during this period, and low payment during night hours, weekends, and holidays.
Consequently, the Danish CHP units have been designed with relatively high production and heat storage capacities, making it possible to produce mainly during the high-tariff period. When electricity sales prices are high, the CHP unit operates at full capacity and stores excess heat in the heat storage. When prices are low, the CHP unit stops, and heat for district heating is supplied from the storage. Until 2004, such regulation ability was not used to integrate fluctuations in renewable energy.
Small CHP units can be used to balance the fluctuating output of wind power. The heat storage facilities of the CHP station are important features of this technique. Provided that the excess heat production can be stored for future use, the CHP station is able to increase electricity production when and if required for balancing activities, without economic penalty.
In the current Danish system, both tasks are solved primarily by large power stations. In some countries, large hydropower stations participate in fulfilling the task as well. When the share of distributed generation is small, balance requirements will not be compromised. However, when the share increases, the balance may be at stake. Consequently, the system design has defined limits to the integration of CHP and RES. In Figure 5.19, small and medium-sized CHP stations are illustrated as distributed generation components operating in accordance with a fixed triple tariff.
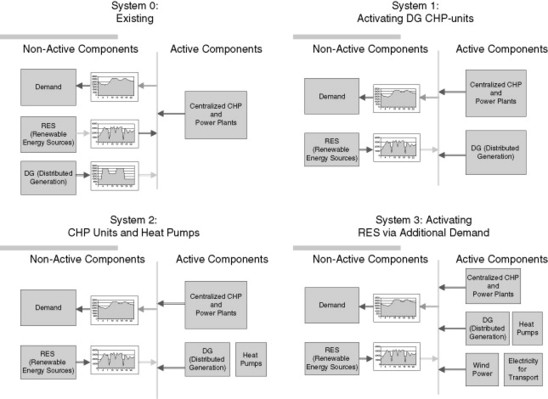
To identify limits and possible solutions to increasing the shares of RES and CHP, three potential future systems have been analyzed and compared with the existing system. Figure 5.20 compares a reference (system 0) with three potential future alternatives:
- • Distributed generation units are operating according to fluctuations in heat demand during the season in question and to a fixed triple tariff during the period of one week.
- • RES (i.e., wind turbines) are operated according to fluctuations in the wind.
- • Centralized power stations, including large CHP stations, are operated to secure a balance between electricity demands and production while still meeting seasonal fluctuations in district heating demand.
- • The task of securing frequency and voltage stability is left solely to the centralized units, under the restriction that the production of these units must always correspond to at least 30 percent of the total electricity production; the production must always be at least 350 MW (in order to have the necessary units operating).
- This system represents the present (prior to 2004) system in Denmark.
- System 1 (activating small and medium-sized CHP stations): The system is the same as the reference apart from the fact that all CHP stations are operated to balance both heat and electricity production. If the electricity production exceeds the demand, parts of the CHP units are replaced by boilers. The heat storage capacities are used to minimize such replacements. The system has been analyzed both in a situation in which small and medium-sized CHP stations do not participate in the grid-stabilizing task (System 1A) and in a situation in which they do participate (System 1B).
- System 2 (adding heat pumps): In System 1, CHP production is replaced by heat production from boilers in periods of excess electricity production, and consequently, the fuel efficiency is decreased. The idea of System 2 is to compensate for the increase in fuel consumption by adding heat pumps to the system. Furthermore, heat pumps increase the flexibility of the system because they can consume electricity at hours of excess production and, at the same time, replace the heat production of CHP units. Again, the system has been analyzed both in a situation in which the small stations do not participate in the grid-stabilizing task (System 2A) and in a situation in which they do participate (System 2B).
- System 3 (including electricity for transport): In System 3, electricity consumption for transportation is added to the regulation system according to the scenario described earlier in this chapter. Vehicles that weigh less than 2 tons are replaced by battery vehicles and hydrogen fuel cell vehicles, respectively. In 2030, 20.8 TWh of oil will be replaced by 7.3 TWh of electricity. On the basis of this national scenario, it has been chosen to analyze a scenario for West Denmark in 2020, in which 3.2 TWh of electricity substitutes 9.8 TWh of oil.
In this article, both the reference and the three alternative regulation systems have been analyzed in terms of their ability to balance supply and demand in the given scenario with different wind power inputs. The results of the three regulation systems are shown in Figures 5.21 and 5.22. In System B, small CHP stations are involved in the task of grid stabilization, while in System A, they are not. In both diagrams, the results are compared with the reference (System 0). In Figures 5.21 and 5.22, the regulation ability is illustrated in terms of excess electricity produced as a function of wind power input. Both values are given as percentages of the electricity demand.
Figure 5.21 Excess electricity production in percentage of demand if small CHP units do not participate in the task of grid stabilization.
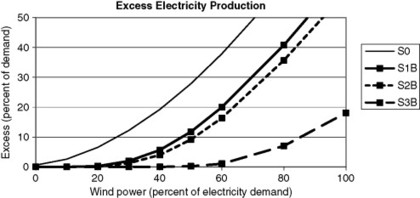
Figure 5.22 Excess electricity production in percentage of demand if small CHP units do participate in the task of grid stabilization.
The diagram should be read as follows: For a given wind power input of 40 percent, the S0-curve representing the reference shows an excess electricity production of 20 percent. Consequently, only half of the wind power input can be used directly in the system. For the same input, the S3-curve (both S3A and S3B) shows an excess production of approximately zero. Consequently, all wind power produced can be utilized directly if such a regulation system is implemented.
In the West Denmark reference scenario, the wind power input in 2000 was 20 percent. Figures 5.21 and 5.22 illustrate how such a wind power input creates a small excess production, which was actually the case in that year. Meanwhile, the excess production problem can easily be avoided by involving small and medium-sized CHP units in the balancing task. In the Danish case, this step was partly implemented starting from year 2004 and did decrease the problem significantly. In the reference scenario, wind power input was planned to increase to 25 percent in 2005 and 35 percent in 2010. Consequently, further steps, such as involving CHP units in the grid stabilization task and/or investing in heat pumps, should be considered. By 2020, wind power has increased to almost 50 percent in the reference scenario. Consequently, the inclusion of electricity for transport should be considered, if excess electricity production is to be avoided.
7 Local Energy Markets7
This section is based on Lund and Münster’s (2006a) article “Integrated Energy Systems and Local Energy Markets,” which is based on the two research reports “Local Energy Markets” (Lund et al. 2004) and “MOSAIK” (Østergaard et al. 2004). The article adds to the analyses in the previous sections by making an economic feasibility study of flexible energy technologies. Moreover, the analysis includes the modeling of the Nordic electricity market Nord Pool. With the technical analyses of the previous sections of this chapter as the starting point, this analysis focuses on how Denmark can benefit from international electricity trade while integrating RES.
The conclusion is that significant benefits can be achieved by increasing the flexibility of the Danish energy system. On the one hand, the flexible energy system makes it possible to benefit from trading electricity with neighboring countries, and on the other, Denmark will be able to make better use of wind power and other types of renewable energy in the future. The article analyzes different ways of increasing the flexibility in the Danish energy system by using the same flexible technologies as described in the previous sections of this chapter. The strategy is compared with the opposite extreme—that is, trying to solve all balancing problems via electricity trade on the international market. The analysis concludes that it is feasible for Danish society to involve CHP stations in the balancing of fluctuating wind power. Moreover, major advantages can be derived from equipping both small and large CHP stations with heat pumps. By doing so, it will be possible to increase the share of wind power from the present 20 to 40 percent without causing significant problems of imbalance between electricity consumption and production, as already shown in the previous sections. As we shall see in the following, such investment is also economically feasible to Danish society. Furthermore, it will have the positive side effect that the feasibility of large-scale wind power production is improved.
This article describes how the Nordic electricity spot market Nord Pool is modeled in the EnergyPLAN model and which data are used to make an economic feasibility study of the integration of wind power into different energy systems. The model is based on typical historical fluctuations in the Nord Pool prices, as shown in Figure 5.23.
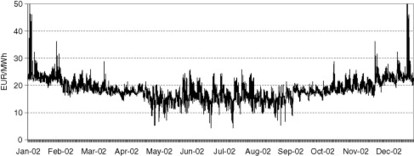
Figure 5.23 Typical spot market price fluctuations on the Nordic Nord Pool electricity market used as a basis for the analysis.
Based on such price variation, the model includes a price elasticity function that evaluates the impacts of electricity export and import on the Nord Pool spot market prices. Export comprises excess electricity produced from CHP and wind power, while import covers electricity produced from hydropower in Norway and Sweden. The model includes the influence from a CO2 emission trading market. Moreover, the model includes a combination of “wet,” “dry,” and “normal” years with regard to differences in the water content in the hydro reservoirs in Norway and Sweden. Such analysis is based on a statistical 7-year cycle and includes the average of a 7-year period. The modeling, as well as the data behind the analyses, is described in detail in the article.
The model just described has been used to analyze the ability of flexible energy systems to integrate RES, as well as the consequences of this integration. The main purpose of the analysis has been to identify the changes required in the energy system to increase the flexibility and thereby the ability to integrate and utilize more wind power in the system. The EnergyPLAN model has been used to calculate the annual costs of the energy supply of West Denmark, including the exchange of electricity on the Nord Pool market and the cost of investing in flexibility, if any. The input of wind power has been analyzed in relation to an annual wind electricity production ranging from 0 to 25 TWh, equal to 100 percent of the electricity demand in West Denmark.
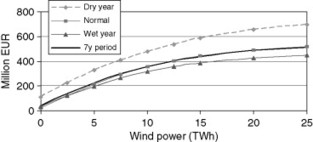
First, the value of wind power has been calculated as integrated into the reference energy system with no investments in flexibility. Then the value has been calculated together with different kinds of flexibility investment. In Figure 5.24, the annual income of wind power including CO2 payment has been calculated for each of the three different years: wet year, normal year, and dry year. Also, the average of a 7-year period is shown in the diagram. The result is the net income of Danish society of different annual wind productions assuming that the system seeks to optimize exchange on Nord Pool. The net income is shown as the extra income when compared to the situation with no wind and “no trading”—in other words, running the system with as little import/export as possible. No investment costs are included in Figure 5.24. The diagram illustrates how market exchange in combination with wind power is an advantage for Denmark in all situations but the net profit achieved by a marginal expansion of wind power decreases with the increase of annual wind power production.
In Figure 5.25 (top), the curve of the average of the 7-year period is shown including investment costs of wind power (20 years lifetime, 5 percent net interest rate). The optimal wind power investment is given for the maximum value of the curve. The location of this point is better illustrated in Figure 5.25 (bottom), in which marginal net profit (without investments) is compared with marginal production costs, including investments in wind power expansion. Figure 5.25 is based on the reference assumption of an international CO2 price of 13 EUR/ton and, as illustrated, wind power production cost of 29 EUR/MWh.
It has been analyzed whether investments in new large steam turbine power stations are feasible in such a system. The analysis concludes that the possibilities of increasing the profit of trading are very limited, and the additional income is far from sufficient to repay the investment. As illustrated, the value of wind power in the reference energy system decreases rapidly as wind power investment increases. The marginal profit gained will soon be lower than the marginal costs of installing new wind power capacities, even when a CO2 payment of 13 EUR/ton is included. The rapid decrease illustrates the problems of integrating electricity production from fluctuating renewable sources when the reference energy system is not regulated for the purpose of integration. Consequently, the following alternative systems have been analyzed in which small additional investments have been made to improve the flexibility of the system to which the wind turbines are connected:
- • regCHP: CHP production is replaced by boilers in situations of excess production and in periods when Nord Pool electricity prices are low.
- • regCHP+HP: Corresponds to “regCHP” plus 350 MWe of heat pump capacity used in combination with heat storage capacity to replace boilers, whenever feasible due to low Nord Pool electricity prices.
Figure 5.26 shows the results, including both investments in wind power and heat pumps. The investments in flexible energy systems seem to be very profitable. In particular, the alternative including heat pumps raises the net income of the Danish energy supply. Thus, the annual net profit (after investment costs are paid) is raised by approximately 5 million EUR/year for a wind power production of 5 TWh/year and increasing to more than 80 million EUR/year for a wind power production of 15 TWh/year. Such a rise in profits must be compared with the annual costs of integrating heat pumps into the system of approximately 16 million EUR/year including capital costs. Consequently, the internal rate of return of such measures is as high as several hundred percent for a wide range of wind power capacities.
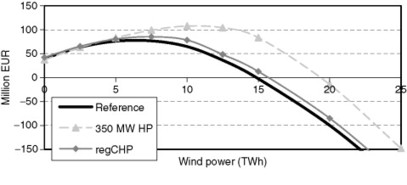
Figure 5.26 Annual net earnings of electricity trading for two flexible energy systems compared to a reference. Better regulation of small CHP stations (regCHP) and investments in 350 MWe heat pump capacity (350 MW HP) increase the annual earnings of wind power productions.
As illustrated, investments in flexibility measures, such as adding heat pumps to the energy system, are feasible when wind power productions exceed approximately 20 percent of the demand. Moreover, such investments influence the feasibility of wind power, as shown in Figure 5.27, which is comparable to Figure 5.25 (bottom) and identifies the optimal Danish wind power investment when optimizing the exchange on Nord Pool and including CO2 payment in the income. Figure 5.27 illustrates how the optimal wind power investment is higher for the two flexible energy systems than for the reference.

Figure 5.27 Feasibility of wind power in flexible versus nonflexible energy systems. The net earnings of increasing wind power are higher for flexible energy systems than in the reference. The optimum in which the marginal net earnings cannot exceed the marginal costs is changed from approximately 6 to more than 10 TWh/year.
Given a production price for new wind power capacities of 29 EUR/MWh and a CO2 payment of 13 EUR/t, the optimal investment in the reference system is 6–7 TWh, equal to 25 percent of the demand. Meanwhile, the same optimum is 30 percent if CHP units are included in the regulation (regCHP) and above 40 percent if heat pumps are included.
A comprehensive sensitivity analysis of the preceding feasibility study has been conducted including the following parameters:
- • A 50 percent increase in the investment costs of heat pumps
- • Changes in CO2 payment (between 0 and 33 EUR/t)
- • Changes in wind power production costs (between 23 and 37 EUR/MWh)
- • Changes in fuel costs
- • Changes in marginal CO2 savings on the Nord Pool market
- • Changes in the influence of CO2 reductions on Nord Pool spot prices
- • Changes in future average price on Nord Pool from 32 to 40 EUR/MWh
- • Change in import/export to Germany
- • Change in the range of Nord Pool price variations (more volatile prices)
From this sensitivity analysis, it can be seen that the feasibility of new wind power investments is very sensitive to, especially, CO2 payment and wind power production costs, as illustrated in Figure 5.28 for the reference system.
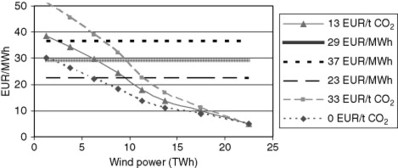
Figure 5.28 Sensitivity analysis. The feasibility of wind power in flexible versus nonflexible energy systems depends mainly on CO2 emissions costs and wind power investment costs.
The same influence has been found for the flexible energy systems; however, the feasibility of these systems is better in general. Two factors have proven to be resistant to any changes in the assumptions: the high feasibility of investing in flexible energy systems (such as heat pumps) whenever wind power exceeds 20 percent of annual electricity productions, and the fact that flexible energy systems also improve the feasibility of wind power.
8 Integration of Transport8
This section is based on Lund and Münster’s (2006b) article “Integrated Transportation and Energy Sector CO2 Emission Control Strategies,” which illustrates and quantifies the mutual benefits of integrating the transportation and energy sectors in the analysis of the Danish energy system. As shown earlier in this chapter, this issue is very relevant in relation to the large-scale integration of renewable energy. In short, the energy sector can help the transport sector replace oil by renewable energy and CHP, while the transport sector can assist the energy system in integrating a higher share of intermittent RES and CHP.
Again, the reference energy system applied is the system of West Denmark in the year 2020. To investigate the impact that a potential electrification of part of the transport system would have on the existing electrical system, two scenarios have been defined for the year 2020. One has already been analyzed in the previous sections: the study that concluded that the technical performance—in particular, the range—of battery cars and hydrogen fuel cell cars will gradually improve in the coming decades, making it feasible to replace a substantial part of the transport task of passenger cars and small delivery vans below 2 tons by these types of cars. Fuel cell cars powered by synthetic fuels like methanol are left out because they have a poorer overall efficiency.
The scenario shown in Figure 5.29 is scaled down to correspond to West Denmark only. The scenario assumes that by 2020, 27 percent of passenger cars and small vans based on an internal combustion engine (ICE) will be replaced by battery cars, while 14 percent will be substituted by hydrogen-powered fuel cell cars. The batteries of the cars are assumed to be large enough to level out consumption on a 24-hour basis (loading during the night), while the combined hydrogen storage of the electrolyzer stations and cars is assumed to level out consumption on a 4-week basis. The electrolyzers are dimensioned to operate approximately 4000 hours/year. The heat produced by the electrolyzers is not considered in the model. If the electrolyzers are placed close to CHP stations, the heat produced in periods when the system needs to increase electricity consumption will have a positive effect on the balance of the grid. If the produced heat is used by the district heating network, the CHP station will have a lower heat and thus electricity production. However, this effect was not included in the analysis.

Figure 5.29 Transport scenario #1: Battery electric vehicles (BEV) in combination with hydrogen fuel cell vehicles (HFCV).
An alternative scenario based on liquid fuels (biofuels and synthetic fuels) that ICE cars use is presented in Figure 5.30. This scenario is based on the REtrol-vision9 of the Danish power company ELSAM, now DONG Energy (ELSAM 2005). It has been scaled to provide the same gasoline substitution as scenario #1. As can be seen, this scenario has a lower overall efficiency, but it cannot be directly compared to #1 because it assumes the use of ICE-based cars, which are either standard cars (low percentage mix of ethanol or methanol with gasoline) or slightly converted cars (higher percentage mix). Hence, the total costs of the system, including conversion of the fleet, are much lower. In this case, the heat balance is negative because the heat produced by the ICE of the cars is not considered. The consumed heat is provided as waste heat from condensing power stations. An important asset of this scenario is the fact that ethanol fermenters produce the carbon needed for the production of methanol. In this way, the total system, including the cars, can be regarded as CO2 neutral. Apart from ethanol, the fermenter produces a solid biofuel. This fuel has been subtracted from the biomass input. As in #1, the electricity consumption of the electrolyzers is assumed to be flexible to the extent that it is leveled out on a 4-week basis.
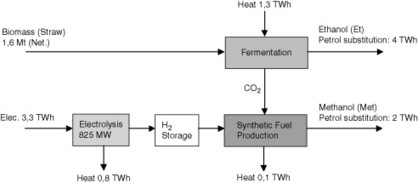
Figure 5.30 Transport scenario #2: Ethanol and methanol in vehicles using internal combustion engines.
In this article, the different alternatives are first compared in an excess electricity production diagram, as shown in Figure 5.31. The “Ref” curve shows how most of the wind power electricity in 2020 must be exported from West Denmark, if the reference regulation method described in the previous sections is used. Please note that 25 TWh of wind power corresponds to 100 percent of the electricity demand of West Denmark. If 350 MW electric heat pumps are established at the CHP stations and the alternative regulation method is used (HP 350 MW), the situation will improve considerably.
Figure 5.31 Excess electricity diagram comparing the two transport scenarios (EV/HFCV and Et/Met) with and without heat pumps (HP) to the reference system (Ref).
If transport scenario #1 (EV/HFCV) is introduced instead, it will have more or less the same effect. Transport scenario #2 (Et/Met) has a larger impact because it uses more electricity. A combination of heat pumps and scenario #2 is only marginally better, because the minimum fraction needed by the power stations for stabilizing purposes puts a limit to the regulation possibilities.
If this constraint is eased by assuming that 50 percent of the wind turbines are supplied with advanced high-voltage semiconductor regulation equipment and are thereby able to perform phase and frequency regulation, the situation will again improve considerably (Et/Met+HP+W). This type of equipment is available today and is considered economically feasible for the very big offshore turbines that are to be established in the future. It is particularly relevant to the combination of wind turbine and electrolyzer because this combination can perform both upward and downward regulations when both parts are active (Østergaard et al. 2004). The economic impacts of converting the entire fleet have not been calculated, but the positive effects on the economy of such a conversion of the energy system as a whole have been evaluated.
Figure 5.32 shows the influence of the alternatives on the feasibility of wind power and the marginal benefits of adding extra wind power to the system. In the diagram, it is seen how the optimal share of wind power production increases with the flexibility of the system. Optimal wind power production moves from about the present situation of the reference system to 40 and even to 50 percent of the demand when heat pumps and transport electrification are assumed. Scenario #2 (Et/Met+HP) has the highest optimal value because it uses more electricity than #1 (EV/HFCV+HP).
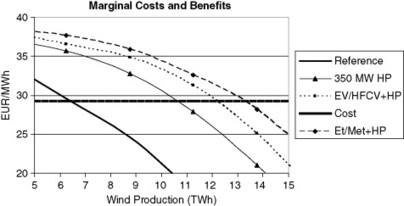
Figure 5.32 Marginal costs and benefits of wind power for West Denmark, 2020. Compared to the reference, the net earnings of increasing wind power are higher if one of the two transport scenarios is implemented. The optimum in which the marginal net earnings cannot exceed the marginal costs of wind power is changed from approximately 6 to between 10 and 14 TWh/year.
Thus, we can see how using electricity for transportation increases the optimal amount of wind turbines in West Denmark. While the establishment of 350 MWe heat pumps at the CHP stations leads to an increase of this optimum from approximately 25 percent to approximately 40 percent in 2020, the additional electrification of the transport fleet further increases the optimum to approximately 50 percent.
The article includes calculations of CO2 balances, which show that the two scenarios result in savings of approximately 1 Mt CO2 per year for West Denmark. If the indirect CO2 savings achieved in the neighboring countries by exporting electricity are considered, even larger savings (approximately 2 Mt) can be gained with the above-mentioned facilitation of an increase of the number of wind turbines.
9 Electric Vehicles and V2G10
This Section Courtesy of Guest Writer Willet Kempton
This section is based on Lund and Kempton’s (2008) article “Integration of Renewable Energy into the Transport and Electricity Sectors through V2G,” which adds to the preceding analyses of the transport sector by including V2Gs (vehicle to grid)—that is, vehicles supplying electricity to the grid. Plug-in electric vehicles (EVs) can reduce or eliminate the use of oil for the light vehicle fleet. Adding V2G technology to EVs can provide storage possibilities, matching the time of generation and loading time.
In this article, two national energy reference systems are selected: the projections of the energy system in West Denmark by the year 2020 and a joint system that includes all of Denmark. The projections used in the former sections of this chapter included only analyses of the electricity system. Here, for a more integrated energy system view, data for the rest of the energy sectors, including the transportation sector, have been added on the basis of the former Danish governmental energy plan, Energy 21.
The Danish reference case, with its high share of CHP, is not typical for most countries. Therefore, a non-CHP reference has been defined simply by replacing all CHP in the Danish system by heat production from district heating thermal boilers and electricity production from condensing power stations. The second national reference system is set at the same total size as the Danish energy system, for comparison purposes. The modeling of transportation demands is based on Danish statistics from 2001, in which the vehicle fleet consisted of 1.9 million combustion cars driving an average of 20,000 km/year and in total consuming 2700 million liters of gasoline, equal to 25.5 TWh/year. The reference combustion vehicle fleet (REF) is compared to four electric vehicle alternatives:
- • BEV: battery electric vehicles, with night charge
- • InBEV: intelligent battery electric vehicles
- • V2G: vehicle to grid cars
- • V2G+: vehicle to grid cars with a battery three times larger than normal
Except for the combustion case, all are referred to as EVs. All EVs, except V2G+ (discussed later), are assumed to have a battery capacity of 30 kWh and a grid connection of 10 kW. The EVs have an efficiency of 6 km/kWh and consume 3333 kWh/year to drive 20,000 km. Based on such statistics and assumptions, the reference fleet and three alternative vehicle fleets have been defined, as shown in Table 5.3.
Table 5.3 Input Parameters of Transport Reference Case and Three Alternatives
| REF Reference | BEV Night Charge | InBEV Intelligent Charge | V2G Vehicle to Grid | |
|---|---|---|---|---|
| Number of vehicles | 1.9 million | 1.9 million | 1.9 million | 1.9 million |
| Average use | 20,000 km/year | 20,000 km/year | 20,000 km/year | 20,000 km/year |
| Vehicle efficiency | 14 km/liter | 6 km/kWh | 6 km/kWh | 6 km/kWh |
| Gasoline consumption | 25.5 TWh/year | - | - | - |
| Electricity consumption | - | 6.33 TWh/year | 6.33 TWh/year | 6.33 TWh/year |
| Charging capacity | - | 19 GW | 19 GW | 19 GW |
| Battery storage | - | 57 GWh | 57 GWh | 57 GWh |
| Discharging capacity | - | 0 | 0 | 19 GW |
The charging of the night charge BEV is assumed to take place during the night, starting to charge after 4 P.M., when it is plugged in, and continuing slowly until the battery is fully charged. Unlike the night charge, the InBEV and V2G charging is based on signals from the electric system, as described in detail in Lund and Kempton’s article. The InBEV recharges as much as possible when excess power is available. The V2G also does this, which additionally supplies the grid with power when the production from power stations, wind turbines, or running CHP stations is low. The aggregated national demand for transportation is based on time-specific driving data from the United States.
In both the CHP and the non-CHP system, the impacts of EVs and V2G are calculated in the case of wind power ranging from 0 to 45 TWh/year in a national system of the size of Denmark. Wind power of 45 TWh/year would be approximately 100 percent of the foreseen Danish national electricity demand in 2020, including the electric vehicles. This is equivalent to an average power output of 5.2 GW. Figures 5.33–5.36 show the results of the modeling for the entire energy system.
Figure 5.33 CHP system, annual excess electricity production (top), and CO2 emissions (bottom) as electricity from wind power increases.
Figure 5.34 Non-CHP system, annual excess electricity production (top), and CO2 emissions (bottom) as electricity from wind power increases.
Figure 5.35 V2G impact on annual excess electricity production in the non-CHP system compared to a system with three times higher battery storage capacity (V2G+).
Figure 5.36 V2G impact on annual excess electricity production in the CHP system compared to a system in which V2G cars are combined with an active regulation of CHP stations, including heat pumps and heat storage (Combi).
At the top of Figure 5.33 is excess electricity production in the CHP system. As the fraction of wind power increases beyond 5 TWh, the excess production of electricity increases. Following the dark line for the REF case, at 10 percent wind power (about 5 TWh), there is a little excess, whereas at 50 percent, (22.5 TWh), a substantial fraction (approximately 50 percent) of the wind power produced is excess production. The other lines show that excess production is reduced successively by BEV with night charge, BEV with intelligent charging, and V2G. In short, the excess production decreases partly because cars are added as load, themselves increasing the electricity demand from 41 TWh/year to approximately 47 TWh/year. Additionally, each refinement of the vehicle fleet successively reduces excess production. The combined reductions are significant. For example, in the 50 percent wind scenario, the change from reference combustion fleet to V2G reduces excess electricity production by 50 percent.
The BEV with night charge significantly reduces both excess production and CO2 emissions (Figure 5.33, bottom). From the BEV night charge line, the incremental benefit to the InBEV intelligent charging and to V2G is small. These results suggest that the ability of EVs to absorb excess power from wind may be at least as important as their ability to return bulk power at times of need. However, the small additional decrement via V2G is also due to the model assumptions at this point. The “night charge” is actually more intelligent than current plug-in vehicles, as the model assumes charging only during the night. Also, the small incremental benefit achieved by using intelligent charging to V2G is partly because the study does not include the ability of V2G to provide regulating power.
The bottom of Figure 5.33 shows the CO2 emissions of the CHP system. The solid dark line representing the reference (combustion) vehicle shows that with no electrical vehicles, increasing wind generation reduces CO2 emissions. However, the slope of CO2 reduction begins to level off at about 10–15 TWh of wind power production and is almost flat at three-quarters wind power (33 TWh). Again, the addition of night charge BEV and other types of intelligent charging and V2G will substantially reduce CO2 emissions.
The leftmost edge of Figure 5.33 (bottom), with 0 TWh of wind, depicts the CO2 impact from the replacement of gasoline-fueled cars by electric cars. The zero shows the reduction of CO2 emissions achieved by displacing gasoline. The reduction in CO2 emissions achieved at a level of zero wind power is substantial—even though the power stations are fueled by fossil fuels—due to the much better vehicle efficiencies (one electric vehicle displaces 13,000 kWh of gasoline with 3333 kWh of electricity). This connection between REF and V2G becomes of growing importance as the proportion of wind power increases. As more electricity is produced from wind, an electric fleet will have an increasingly beneficial CO2 impact.
The right side of Figure 5.33 demonstrates the REF-V2G values if wind power is 45 TWh/year. These values are almost twice the size of the values shown on the left side, where wind power equals zero. This means that the size of the direct CO2 reduction achieved by completely eliminating motor fuels is smaller than the indirect effect created by reducing CO2 from electric generators by using EV and V2G.
Figure 5.34 shows the results for the non-CHP system, which represents the system of a typical industrialized country, with heat provided by independent devices (in this case district heating) rather than combined with power stations. CHP is more efficient, which means that when wind power equals zero, the CHP system has considerably lower CO2 emissions. This effect continues at all wind power levels. On the other hand, excess electricity production begins earlier in the CHP system, before reaching 5 TWh of wind (for combustion cars), and the excess production is considerably higher when wind power production is high. This is because electricity production from CHP adds to the excess wind power production.
The addition of EVs has a larger effect, proportionally, in the non-CHP system. With V2G, even at high wind fractions—for instance, three-quarters of the electricity or 34 TWh produced from wind—12 TWh of excess production in the CHP system still occurs, but only 4 TWh of excess production occurs in the non-CHP system. The introduction of all types of EVs leads to a reduction in both excess production and CO2 emissions for high shares of wind. However, the influence does not completely erase excess power or CO2. The lines phasing out toward the right mean that the beneficial effects of the EVs are reduced as the fraction of wind becomes higher.
One important factor is the limitation of the capacity in the battery storage. In Figure 5.35, the impact of a V2G fleet with base characteristics is compared to the impact of a V2G fleet with a storage capacity three times higher (here called V2G+)—in other words, 90 kWh/vehicle or 171 GWh altogether. A 90 kWh vehicle would be sensible, since it would have a range of 540 km and would thus more completely substitute a liquid-fuel or plug-in hybrid vehicle. (It would not, however, be practical today due to battery costs and weight, but the technology is improving rapidly.) As seen in Figure 5.35, such an increase in the storage capacity significantly reduces excess production (and CO2 emissions, not shown here).
In the preceding results, CHP stations are not included in the regulation of wind power, and small CHP stations do not contribute to the fulfillment of maintaining grid stability. To examine the effect of including CHP stations, the same analysis has been conducted for alternative scenarios, in which CHP stations participate in the regulation and heat pumps and heat storage capacities have been added to the system. As shown in the previous sections, heat pumps in combination with heat storage and CHP have proven to be a very efficient technology in terms of integrating wind power. Consequently, such investments decrease excess production as well as CO2 emissions in general. Figure 5.36 shows how the combination of V2G with an active regulation of CHP stations, including heat pumps and heat storage together (here called “Combi”), significantly reduces excess electricity production with even very high shares of wind power.
Altogether, these analyses show that EVs with night charging and, to a larger extent, V2G will improve the efficiency of national energy systems, reduce CO2 emissions, and improve the ability of the systems to integrate large shares of wind power. Moreover, V2G can be combined with other measures, such as heat pumps and active regulation of CHP stations, in such a way that they together form a coherent solution to the large-scale integration of wind power into renewable energy systems.
It should be noted that the assumptions in this first application of the national energy model to V2G are conservative in that they are probably an underestimation of the value of V2G. First, the most important advantage of V2G over simple EVs is its potential to completely replace regulating power stations and thereby provide grid stability (both voltage and frequency). Such a benefit has not been included in the analysis. Second, it was assumed that the V2G controllers did not relate to their drivers’ operating schedules and were thus required to fully charge the battery each morning. In this way, more power station operation was required during nights with little excess electricity, and less battery capacity was available during the day to absorb this electricity. Refinements will most likely be made to future models and analyses.
10 Electricity Storage Options11
This section is based on Lund and Salgi’s (2009) article “The Role of Compressed Air Energy Storage (CAES) in Future Sustainable Energy Systems,” which focuses on CAES technologies as one example of introducing electricity storage technologies in the energy system with the aim of improving the large-scale integration of RES. However, the article includes a comparative study of other relevant electricity storage options and thereby serves as a general study on electricity storage technologies.
The primary purpose of the study is to examine the feasibility of CAES stations when applying load level to improve the integration of wind power into regional or national energy systems. Part of such analysis is to compare CAES stations to other technologies with the same aim. In its nature, such analysis, of course, depends on the energy system in question and especially on the share of wind power and other production units with limitations or restrictions in the system, such as, for example, distributed CHP stations. Here, the starting point for the evaluation is a “business as usual” extension of the present Danish energy system into 2030, as conducted by the Danish Energy Authority. By using the EnergyPLAN model, such a system has been analyzed, applying different shares of wind power and leading to low or high amounts of excess electricity production.
First, an infinite CAES station has been added to the system. The analysis showed that when the wind power share was up to 59 percent (wind production compared to electricity demand), the infinite CAES station was able to remove all excess electricity production and use all stored energy to replace the power production of non-CHP power stations. With a wind power share above 59 percent, even the infinite CAES station was not able to use all of its excess production for the simple reason that the power stations did not produce enough power that could be replaced by the wind turbine production. Similarly, the infinite CAES station can replace all non-CHP power production in the system when the wind power share is down to 59 percent. Below 59 percent, the lack of excess electricity production will set the limit on filling the storage. In other words, in systems with low wind power shares, the lack of excess power sets the limitations, and in systems with high wind power shares, the lack of non-CHP power production sets the limitations on a full utilization of CAES stations. In the Danish system as expected for the year 2030, the optimal use of CAES is found to be a wind power share of 59 percent.
In the next analysis, the infinite CAES station was replaced by a 360 MW station described in detail in the article and analyzed in the optimal situation of 59 percent wind power. The results showed that the limited capacity of the specific station significantly reduced the influence of the CAES station. The reason for this is illustrated in Figure 5.37.
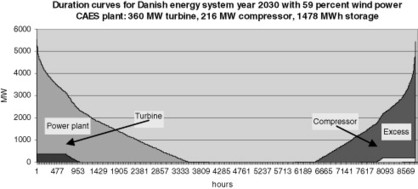
Figure 5.37 Duration curves of power station and excess electricity productions compared to CAES turbine and compressor contributions.
Figure 5.37 shows the duration curves of excess electricity (to the right) and non-CHP power production (to the left) and compares these to the resulting annual turbine and compressor consumption and production, respectively, when modeled in EnergyPLAN with the aim of reducing excess and power station electricity productions. As seen from the diagram, the influence of the CAES station is marginal. The capacity of the share of excess electricity produced is much higher than that of the compressor, and, consequently, most of the excess production cannot be absorbed by the compressor. The problem is the same with regard to power production and turbine capacity. Also, the storage capacity sets a limitation, which can be identified by conducting the same analysis of a CAES station with infinite storage. However, even in such a situation, the influence of the CAES station is marginal.
It is important to understand that the reason for such marginal influence from CAES—and for that matter from any other electricity storage technology—is based on the nature of the RES fluctuations. The nature dictates relatively high power outputs from the RES during relatively few hours, as shown by the duration curves in Figure 5.37. Thus, the situation requires high compressor and turbine capacities and, consequently, high investments that can only be utilized in a few hours. Moreover, the combination of the amounts of energy and the time span in which the energy needs to be stored requires a huge storage capacity that again will be filled and emptied relatively few times.
However, even though the influence of CAES with regard to using excess production is marginal, the CAES station itself may be economically feasible for the system. The feasibility has been assessed by identifying the value of the fuel saved in the system. The results are shown in Figure 5.38 in terms of annual net operational income of the CAES station. Such net income has been calculated as the difference between, on the one hand, the values of variable operation and excess electricity costs and, on the other, the fuel and variable operation costs saved in the system. Three different sets of fuel prices have been used, as expressed by the three different oil prices of US$40, US$68, and US$96/barrel. If the excess electricity produced is not used in CAES systems, one alternative is to sell it on the Nordic electricity market. In Figure 5.38, three different selling prices have been analyzed: 0, 13, and 27 EUR/MWh, respectively.

Figure 5.38 Net operational income of a CAES station in the Danish year 2030 energy system compared to the annual investment and fixed operation cost of 14 million EUR/year (shown by the dotted line).
In Figure 5.38, the annual net operational income is compared to the investment and fixed operational cost per year of 14 million EUR (marked by a dotted line). As shown, variations in the fuel price mean little to the results because CAES stations burn natural gas, and, consequently, fuel savings at the power stations are counterbalanced by fuel costs at the CAES station. The price of excess electricity production is important. However, even if the excess power produced is free, annual net earnings are far from the level of annual investment and fixed operation costs.
The system economic feasibility of CAES stations has been compared to other technologies that may also use excess electricity production and contribute to a better system integration of wind power. All alternative technologies have been designed in such way that they all have the same annual investment and fixed operation costs as explained previously—namely, 14 million EUR/year. The cost components are based on Mathiesen and Lund (2009) and explained in Lund and Salgi’s (2009) article, and the results are shown in Figure 5.39. The results in Figure 5.39 apply an oil price of US$68/barrel and an excess electricity price of 13 EUR/MWh. However, only minor changes are achieved by applying other price levels, apart from the electric boiler, which is especially sensitive to the price of excess electricity.
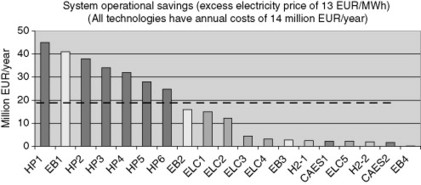
Figure 5.39 Savings of CAES compared to other alternative investments, all with the same annual investment and fixed operation costs of 14 million EUR/year (marked by the dotted line).
It can be seen from Figure 5.39 that CAES stations are not feasible, and other options are significantly more attractive. It must, however, be emphasized that such an analysis is solely concerned with the benefits of better operation, including the integration of wind power. In one important aspect, the technologies are not comparable; the CAES and the hydrogen/fuel cell technology add production capacities to the system, which the other options do not.
Consequently, CAES may reduce the need for backup capacity and thereby save investment costs in the system. A sensitivity analysis has been made in which such saved investment costs have been included, resulting in up to 1 million EUR/MW of steam turbines with a lifetime of 30 years. In such an analysis, the CAES station becomes economically feasible, even though it still cannot compete with some of the other technologies.
With regard to the CAES station, it is concluded that such stations cannot alone solve the problems of excess electricity production, and that other options are significantly more attractive. However, if CAES stations can save investments in power station capacities in the system, the CAES technology has an economically feasible potential.
With regard to electricity storage technologies in general, it is concluded that such technologies have only a minor influence on the large-scale integration of renewable energy and that the economic feasibility is in general very low. When in particular compared to conversion technologies, such as heat pumps in combination with heat storage capacities, which have a major impact, electricity storage technologies in general cannot compete. If such technologies are to be competitive, they must provide other benefits such as saving power station capacity and/or supporting grid stability.
11 Conclusions
The conclusions on the different analyses of large-scale integration of renewable energy presented in this chapter are drawn with regard to principles and methodologies as well as the practical implementation of renewable energy systems in Denmark and in other countries.
Principles and Methodologies
As mentioned at the beginning of this chapter, the discipline of analyzing large-scale integration of renewable energy into existing systems must address the challenge of re-designing the systems based on the characteristics of the fluctuating renewable sources. The systems must be designed in such a way that they are able to cope with the fluctuating and intermittent nature of renewable energy sources, especially with regard to the electricity supply.
From a methodological point of view, this raises the problem of how to deal with fluctuations of the same installed capacity of RES, such as PV, wind, wave, and tidal power, varying from one year to another. One may be able to design a suitable energy system to cope with the fluctuations of last year, but how can one be sure that such a system will also be able to meet the fluctuations of the present and coming years in the same efficient way? When comparing two alternative investments in flexible energy systems, how can one be sure that the best option considering last year’s fluctuations will also be the best way to cope with the fluctuations of coming years?
To deal with such problems, excess electricity production diagrams have proven to be a suitable and workable methodology. In such diagrams, each energy system is represented by only one curve that shows the ability of the system to integrate fluctuating RES representing several years of different hour-by-hour fluctuations. The diagrams have proven usable for both PV, wind, and wave power.
Moreover, the analyses show that in the design of systems suitable for large-scale integration of RES, one should distinguish between two different issues. The first issue is concerned with annual amounts of energy—that is, on an annual basis, the supply of each of the amounts of electricity, heating, and fuel must meet the corresponding demands. The other issue is concerned with time—that the supply of the same amounts of energy must meet the timely duration of the corresponding demands. The latter is of special importance to the electricity supply.
Such a distinction between amounts and time is important, since one cannot solve the problem of time if the amounts produced do not match the demand. One cannot use a storage capacity efficiently if the electricity production on an annual basis significantly exceeds the demand. Under this condition, one may be able to fill the storage but not empty it again. Consequently, when designing energy systems that are suitable for large-scale integration of RES, one should first design the system in such way that a balance of the annual amounts can be created and then look into the time problem—that is, design the system in such way that the hourly distribution of especially the electricity demands can be met.
As a result, it is important to distinguish between conversion technologies and storage technologies, as described in the definitions in Chapter 1. With regard to such recommendations, a general understanding can be drawn from the analyses. Conversion technologies, such as heat pumps and electric vehicles, may improve the efficiency of the system, and they also entail the possibilities of cost-effective and efficient storage options. On the other hand, “pure” electricity storage technologies, such as CAES and hydrogen/fuel cell systems, only contribute marginally to the integration of fluctuating RES and also have a low feasibility.
Recommendations
The large-scale integration of renewable energy should be considered a way to approach renewable energy systems. The integration of RES must be coordinated with energy conservation and efficiency improvements, including the use of CHP and the introduction of fuel cells. All such measures each improve the fuel efficiency of the system. However, they also add to the electricity balancing problem and contribute to the excess electricity production.
The point is that RES should not be regarded as the only measure when conducting analyses of large-scale integration. The long-term relevant systems are those in which such measures are combined with energy conservation and system efficiency improvements. In that respect, the Danish energy system with a high share of CHP can be regarded as frontrunner and a system well suited for the analysis of large-scale integration of renewable energy. In systems with a high share of CHP (in this chapter represented by the Danish energy system), excess electricity production can best be dealt with by giving priority to the following technologies:
- 1. CHP stations should be operated in such way that they produce less when the RES input is high and more when the RES input is low. When including heat storage capacity, such measures are likely to integrate fluctuating RES up to 10–20 percent of the demand without losing fuel efficiency in the overall system. After this point, the system will begin to lose efficiency as heat production from CHP units is replaced by thermal or electric boilers.
- 2. Heat pumps, and maybe additional heat storage capacity, should be added to the CHP stations and operated in such a way that further RES can be efficiently integrated. Such measures will allow for the integration of up to 40 percent of fluctuating RES into the electricity supply without losing overall system efficiency. The economic feasibility of the investments in heat pumps proves very high for Danish society. Moreover, the investment in wind power is substantially improved.
- 3. Electricity should be used in the transportation sector, preferably in electric vehicles. Such measures will serve as an efficient improvement of the integration of fluctuating RES.
- 4. In general, it is not beneficial to include electricity storage capacity in the preceding steps. Such storage capacity is both inefficient and expensive compared to the benefits that may be achieved. Moreover, the nature of fluctuating RES dictates the need for high capacities of both conversion units and storage in combination with a low number of full load hours. Thus, the electricity storage technologies call for high investments in combination with low utilization. If such technologies are to be competitive, they should provide further benefits, such as saving power station capacity and/or securing grid stability.
- 5. It is not necessary to include flexible consumer demands in the regulation. The use of such a measure raises the same problems as for electricity storage technologies. The nature of fluctuating RES calls for high energy amounts and long time spans to such an extent that a realistic flexible consumer demand cannot really do the job.
- 6. It is much more important to involve the new flexible technologies, such as CHP, heat pumps, and the electrification of transportation (batteries and electrolyzers), in the grid stabilization tasks—in other words, to secure and maintain voltage and frequency in the electricity supply. Such involvement becomes increasingly important along with the acceleration of the share of RES.
- 7. With regard to the relation between technoeconomic analyses in a closed system and economic analyses of the benefits of international electricity exchange, studies show that the flexible technologies that can efficiently integrate fluctuating RES, at the same time, prove feasible in the sense that they make an economic profit from trading on international markets.
1 Translated from Danish: Kritisk og Eksporterbart Eloverløb.
2 Excerpts reprinted from International Journal of Sustainable Energy, 23/4, Henrik Lund, “Excess electricity diagrams and the integration of renewable energy,” pp. 149–156 (2003), with permission from Taylor and Francis.
3 Excerpts reprinted from Renewable Energy, 31/4, Henrik Lund, “Large-Scale Integration of Optimal Combinations of PV, Wind, and Wave Power into the Electricity Supply,” pp. 503–515 (2006), with permission from Elsevier.
4 Excerpts reprinted from Int. J. Energy Technology and Policy, 1/3, Henrik Lund, “Flexible Energy Systems: Integration of Electricity Production from CHP and Fluctuating Renewable Energy,” pp. 250–261 (2003), with permission from Inderscience.
5 Excerpts reprinted from Energy, 30/13, Henrik Lund, “Large-Scale Integration of Wind Power into Different Energy Systems,” pp. 2402–2412 (2005), with permission from Elsevier.
6 Excerpts reprinted from International Journal of Sustainable Energy, 24/1, Henrik Lund, “Electric Grid Stability and the Design of Sustainable Energy Systems,” pp. 45–54 (2004), with permission from Taylor and Francis.
7 Excerpts reprinted from Energy Policy, 34/10, Henrik Lund & Ebbe Münster, “Integrated Energy Systems and Local Energy Markets,” pp. 1152–1160 (2006), with permission from Elsevier.
8 Excerpts reprinted from Transport Policy, 13/5, Henrik Lund & Ebbe Münster, “Integrated Transportation and Energy Sector CO2 Emission Control Strategies,” pp. 426–433 (2006), with permission from Elsevier.
9 Translated from Danish: VEnzin.
10 Excerpts reprinted from Energy Policy, 36/9, Henrik Lund & Willett Kempton, “Integration of Renewable Energy into the Transport and Electricity Sectors through V2G,” pp. 3578–3587 (2008), with permission from Elsevier.
11 Excerpts reprinted from Energy Conversion and Management, 50/5, Henrik Lund & Georges Salgi “The role of compressed air energy storage (CAES) in future sustainable energy systems,” pp. 1172–1179 (2009), with permission from Elsevier.