7
Mapping Your Value Streams
Value streams are an important part of the SAFe®. We saw evidence of this in Chapter 2, Culture of Shared Responsibility, when we looked at the SAFe Lean-Agile Principles and came to Principle #10: Organize Around Value. In that same way, value streams have a key role to play in DevOps. In The Phoenix Project: A Novel About IT, DevOps, and Helping Your Business Win, the authors Gene Kim, George Spafford, and Kevin Behr introduced the concept of the Three Ways. The First Way is to use a value stream to establish flow and this is precisely what we will look at in this chapter.
We will examine how to discover your organization’s value stream and find future optimizations. In all, we will look at the following activities:
- Aligning the organization’s mindset to value streams
- Setting the context for development value streams
- Mapping the development value stream
- Finding areas for improvement
Let’s take a look at preparing the organization to think of operations in terms of value streams.
Aligning the organization’s mindset
A focus on value streams will require major changes to an organization, which may culminate in a change of culture. These efforts at transformation are often the beginning of a never-ending journey of continuous improvement.
We’ll first evaluate one example of such a transformation: the adoption of SAFe through the implementation roadmap. In examining the roadmap, we’ll see how identifying value streams plays a key role.
Another example of a guide to transformation is the eight steps that form a Value Stream management (VSM) initiative, as identified in Driving DevOps with Value Stream Management: Improve IT Value Stream Delivery with a Proven VSM Methodology to Compete in the Digital Economy by Cecil “Gary” Rupp. The VSM initiative, as described in this book, is the reference method for the VSM Consortium, a group of individuals and organizations looking to advance methods to improve VSM.
We will see that there is a significant overlap between the two transformation guides. Because of this, it is possible to have a VSM initiative inside of a SAFe transformation, and the two methods complement each other. With that in mind, let’s begin our examination of value streams with a look at SAFe’s implementation roadmap.
Moving to SAFe
The implementation roadmap is the main pattern that an organization can use to adopt SAFe. The roadmap starts with setting up a coalition of change agents, training them on the new ways of working, and then setting this up through value streams. The roadmap can be customized so that it fits the organization.
The steps of the implementation roadmap are as follows:
- Reach the tipping point to adopt SAFe.
- Train the champions and change agents.
- Train the executives and leaders on the new ways of working.
- Create a Lean-Agile center of excellence for the change agents.
- Identify the value streams.
- Create an implementation plan.
- Prepare to launch the first Agile release train (ART).
- Train the ART and launch.
- Coach the ART on execution.
- Launch additional value streams and ARTs.
- Extend ART guidance to a portfolio.
- Accelerate and continue through inspection and adaptation.
We can see that this roadmap aligns with the Kotter Change Model, previously discussed in Chapter 2, Culture of Shared Responsibility, specifically as identified in the following table.
|
Kotter Change Model step |
Applicable implementation roadmap step(s) |
|
Create a sense of urgency |
Reach the tipping point to adopt SAFe |
|
Guide a powerful coalition |
Train the champions and change agents, train the executives and leaders on the new ways of working, create a Lean-Agile center of excellence |
|
Create a vision |
Identify the value streams, create an implementation plan |
|
Communicate that vision |
Create an implementation plan, prepare to launch the first ART |
|
Empower others to enact the vision |
Prepare to launch the first ART, train the ART and launch |
|
Celebrate the short-term wins |
Coach the ART on execution |
|
Consolidate wins to create more change |
Launch additional value streams and ARTs, extend ART guidance to a portfolio |
|
Anchor new changes in the culture |
Launch additional value streams and ARTs, extend ART guidance to a portfolio, accelerate and continue through inspection and adaptation |
Table 7.1 — Mapping of the Kotter Change Model to the SAFe implementation roadmap
We can see that identifying the value stream(s) is an important part of launching the first ART and subsequent ARTs. With this in mind, we can look at the steps of launching a VSM initiative to assist in identifying value streams.
Moving to value streams
The VSM methodology is presented in Driving DevOps with Value Stream Management: Improving IT Value Stream Delivery with a Proven VSM Methodology to Compete in the Digital Economy by Cecil “Gary” Rupp. In this book, the author adapts the Improvement Kata model from Lean thinking to create and maintain a value stream or multiple value streams.
The VSM methodology is outlined in the following steps:
- Committing to Lean
- Choosing the value stream
- Learning about Lean
- Mapping the current state of the value stream
- Mapping the ideal future state of the value stream
- Setting up an improvement (Kaizen) plan to get to the future state
- Implementing the improvement plan
- Repeating the process
Now that we understand the overall strategy to map value streams, let’s take a closer look at the process of identifying value streams in our next section.
Setting the context for development value streams
The work done by a development value stream is applied to a solution that has a role in the greater context of the journey that the customer takes with an organization to obtain value. This greater context is captured in the operational value stream that the organization may have.
We took an initial look at the differences between Operational value streams, which detail the customer’s needs and how a company’s solutions can fit those needs, and Development value streams, which show the steps needed to develop and maintain a solution, in Chapter 2, Culture of Shared Responsibility. In this section, we will demonstrate how to create an operational value stream with the help of useful tools, such as Gemba walks. The last part of this is finding the solutions that the Operational value stream uses. These solutions become the basis for Development value streams.
Preparing for value stream identification
Mapping both the operational and development value streams can be an extensive effort, one that can easily be frustrating when looking at the complexities of the organization. Before engaging in this endeavor, some preparation is necessary.
Mapping value streams is often done through workshops held with different members of the organization in attendance. Before facilitating such a workshop, you may want to make sure the following are determined by the organization:
- The scope of the value stream
- The members of the team that will meet to identify the value streams
- An understanding of the customer’s point of view through a Gemba walk
Let’s examine each of these in closer detail.
Determining the scope
Organizations may be small or immense, based on the history or number of products or solutions that an organization designs, produces, and maintains. Before discovering the organizational and development value streams, the organization should set the proper scope for discovery.
Karen Martin and Mike Osterling lay out the scope as a value stream charter in their book Value Stream Mapping: How to Visualize Work and Align Leadership for Organizational Transformation. In the book, they collect the following items for the value stream charter:
- value streams.
- Specific conditions: It may be useful to only allow a limited number of scenarios. If this is the case, you may want to set up only a small number of conditions that bring about the desired scenarios.
- Trigger: The event that starts the activity in the value stream.
- Demand rate: This is how often the trigger occurs.
- The first step and last step in a stream.
- The boundaries/limitations.
- Improvement time frame: This may help determine what possible future state improvements should be made first.
- Current state problems and needs.
- Measurable target conditions.
- The value to the customer and value to the business.
- The accountable team members.
Let’s take a look at the members and roles needed for the mapping in the next section.
Creating the team
A value stream mapping exercise may take several days. During that time, a number of people will be called to provide their expertise and fill out the items required by the value stream charter for the operational and development value streams.
The following roles are laid out in Value Stream Mapping: How to Visualize Work and Align Leadership for Organizational Transformation:
- Executive sponsor: This may be a C-level leader who is ultimately accountable for the results. They will oversee the overall process and keep track of the progress of the value stream toward the future state.
- Value Stream champion: This is someone accountable for the performance of the value stream. They will be playing a key role in value stream mapping.
- Facilitator: This is someone who ensures that value stream mapping is handled smoothly.
- Logistics coordinator: This person makes sure that all the necessary arrangements are made for the value stream mapping. This may include reserving the room for a face-to-face mapping meeting or getting the necessary web collaboration meeting configuration ready for a virtual meeting.
- Meeting attendees: The members of the mapping team will make up the rest of the team. This will be a diverse group that will have knowledge of the strategic elements of value streams, as well as direct experience of the tactical steps that development value streams will take.
These people should be shown the charter to allow them to be prepared for the mapping workshop. Questions may arise about possible situations. They should be brought to the workshop to be communicated to everyone.
Understanding the customer’s perspective with Gemba walks
Because operational value streams directly involve the customer, it is important to understand the customer’s perspective so that solutions are more valuable. One way to do that is through a Gemba, also referred to as go see, walk.
With a Gemba walk, members of the VSM team will go to a customer’s site to view how the value stream works from the point of view of the customer and whether there are any necessary improvements.
When performing a Gemba walk, it is often beneficial to look at the final step of the value stream and work backward. This helps keep the focus on the customer perspective and values the delivery to the customer.
Gemba walks should happen often to understand not only the customer’s mindset and the effects of the Value Stream from the customer’s perspective but also whether the improvements to the value stream to reach the ideal value stream future state are having the desired effect.
Driving DevOps with Value Stream Management: Improve IT Value Stream Delivery with a Proven VSM Methodology to Compete in the Digital Economy outlines the following steps as a Gemba walk strategy:
- Identify the goals and objectives.
- Notify the customer of the Gemba walk visit and the reason for it in advance.
- VSM team members should visit as a group.
- Trace the flows from the value stream.
- Discover any issues with the process and its related activities. Do not put the blame on people.
- Document what you find.
- Identify the root causes. The Five whys technique, where you repeatedly ask why? five times, is an effective way to drill to the root cause.
- Listen.
- Follow up with recommendations.
- Repeat the walk to confirm that the recommended changes are being implemented.
- Repeat the walk for other Kaizen (continuous improvement) opportunities.
The rest of the value stream identification will happen in dedicated workshops with the team members in attendance. Let’s take a close look at how an operational value stream is identified during a workshop.
Creating the operational value stream
During the initial activities of a value stream workshop, you will be called to identify the operational Value Stream and the solutions that are the end products of development value streams.
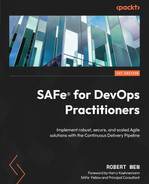
Operational value streams typically fall into one of the following four categories, based on how they deliver value to the customer:
- Digitally enabled product or service: This operating value stream processes an online customer request for a product or service. E-commerce sales are a good example.
- Manufacturing: This operating value stream is responsible for the creation of physical products purchased by the customer.
- Software products: This operating value stream is responsible for software products delivered to the customer.
- Support: This operating value stream looks at the workflow for activities that support the customer, typically an internal customer.
Examples of these four categories of operational value streams appear in the following diagram:
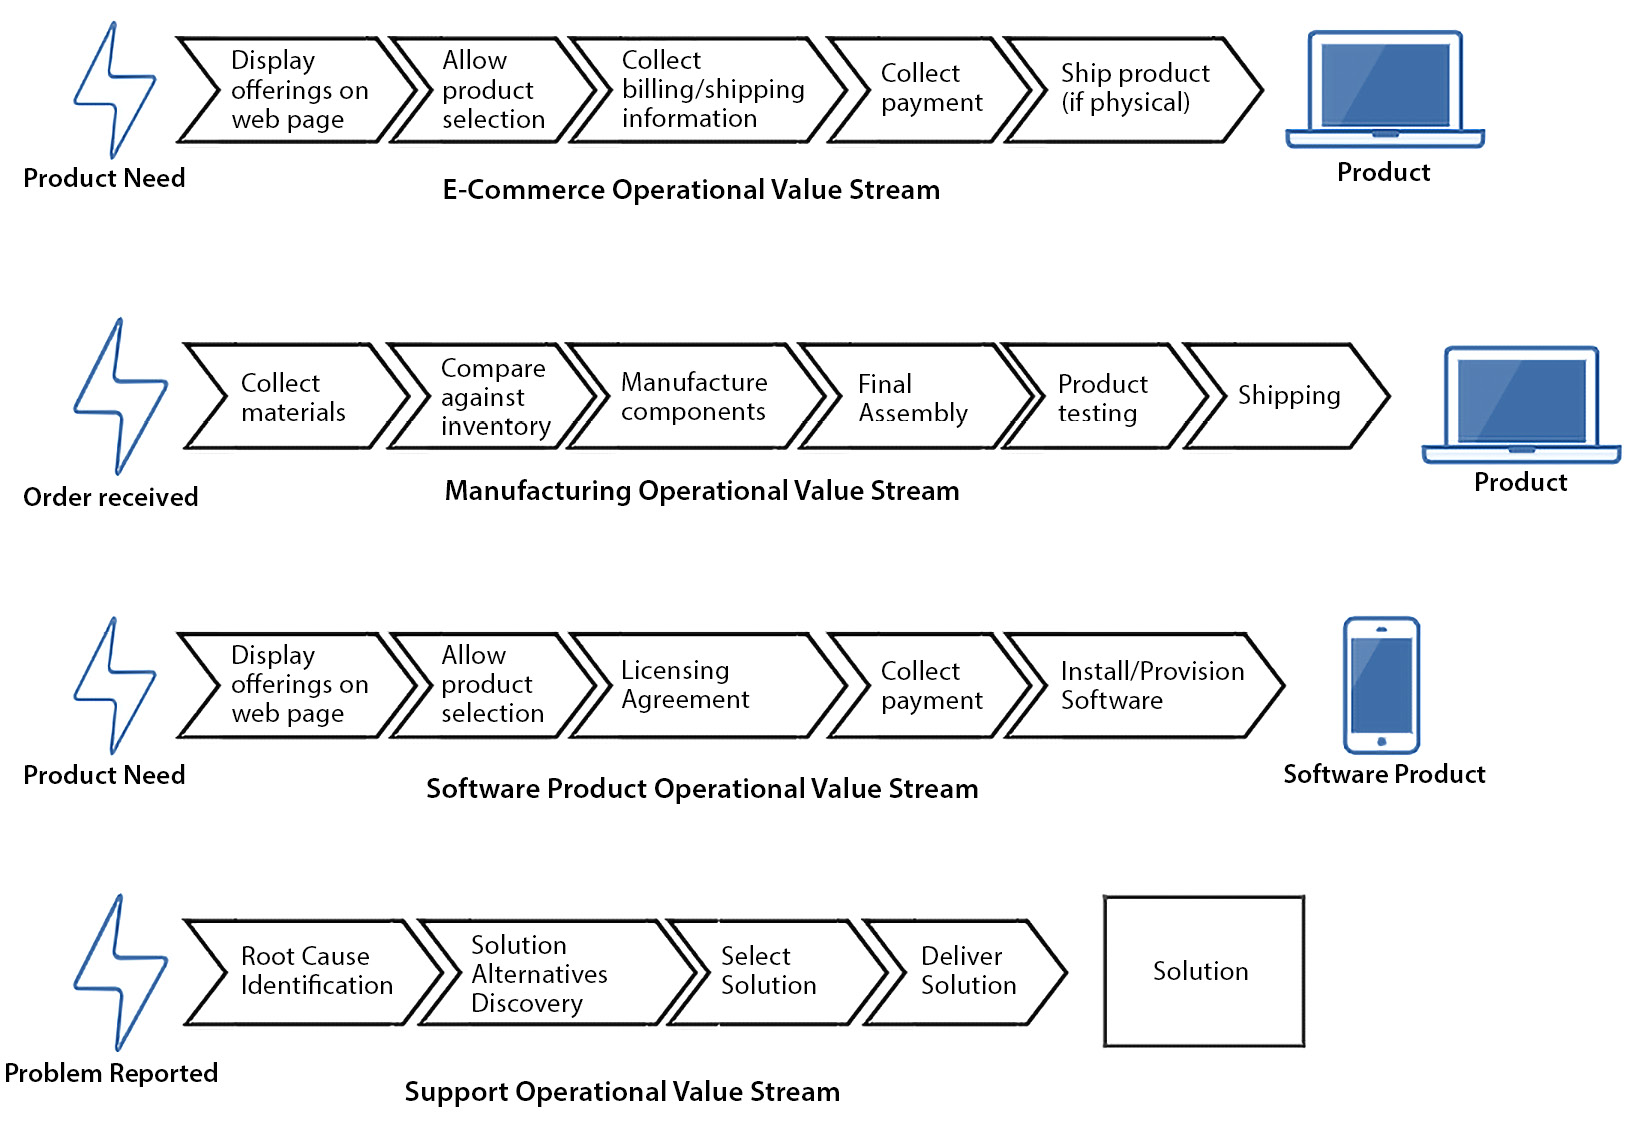
Figure 7.1 – Example operational value streams
Identifying the category of the operational value stream allows the mapping team to look at the journey the customer takes, and identify the possible solutions needed. They can then outline the steps that the customer takes to find value and create a note for each step.
The team then develops a chain of steps to form their organizational value stream, as shown in the following diagram, of the operational value stream which we first presented in Chapter 2, Culture of Shared Responsibility.
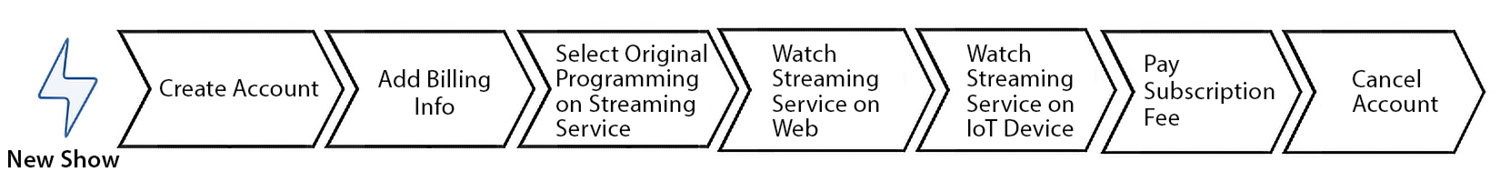
Figure 7.2 – Example of an operational value stream
The determination of the steps of the value stream may take some back and forth among the mapping team, particularly if there is a multitude of conditions. It may make sense to evaluate the most common conditions. If there is no consensus on the number of candidates for the operational value stream, it’s a good idea to bring all the candidates forward and see how it affects the development value streams.
We have a good definition of an operational value stream when we can identify the following characteristics:
- The type of operational value stream
- The name
- A description of the value stream
- The customer(s)
- The triggers
- The value the customer receives
- The value the organization receives
When the steps of the operational value stream have been determined, it’s time to find the solutions the operational value stream relies on.
Finding solutions
Once the steps of the operational value stream are identified, the next task is to look at each step and determine whether the step is enabled through a solution. SAFe defines a solution as a product, system, or service. Solutions could be something that the customer engages with or could be internal only.
The mapping of the solution to operational value stream steps is not one to one. Some steps may require the same solution, and some steps may not need a solution.
It may also be possible that a solution may support multiple operational value streams. Such a solution and the corresponding development value stream may be centralized in the organization.
We have identified the following solutions for our example operational value stream:
Figure 7.3 – Solutions and example of an operational value stream
Once we find the solutions, we are closer to finding the development value streams that create and maintain these solutions. We’ll investigate how to determine those development value streams in the next section.
Mapping the development value stream
In SAFe, discovering the development value streams gets us closer to modeling those value streams as ARTs or even Solution Trains for larger solutions.
In mapping the way solutions are developed as development value streams, we are going to concentrate on the following aspects:
- The process and workflow
- The people involved in the process, such as suppliers and customers
Let’s start our mapping journey by considering the process used to develop the solutions.
Finding the process and workflow
When looking at the development value stream, we can start by thinking of the development value stream initially as a black box with only its inputs and outputs visible. From there, we can piece together the intermediate steps.
The initial black box of the development Value Stream is formed by identifying the following characteristics:
- The trigger for the development value stream
- The first step of the development value stream
- The last step of the development value stream
- The demand rate for solutions
The mapping of the black box can continue from the determination of the solution as shown in the following diagram:

Figure 7.4 – Initial mapping of the development stream black box
When the members of the value stream mapping team are in agreement about the trigger, first step, last step, and demand rate, it’s time to fill in all the steps that happen in between the first step and last step.
Connecting the dots
The mapping team now sets about filling in the steps between the first step and the last step of the development value stream. The authors of Value Stream Mapping: How to Visualize Work and Align Leadership for Organizational Transformation recommend between 5 and 15 steps or process blocks.
It’s important to remember that when mapping the process, we want to look at the current state of these development value streams, making sure we do not omit the bottlenecks and weaknesses in the processes. It’s difficult to imagine an ideal future state for our development value stream without knowing how the current development value stream works.
The following diagram elaborates on the steps of our example development value stream:
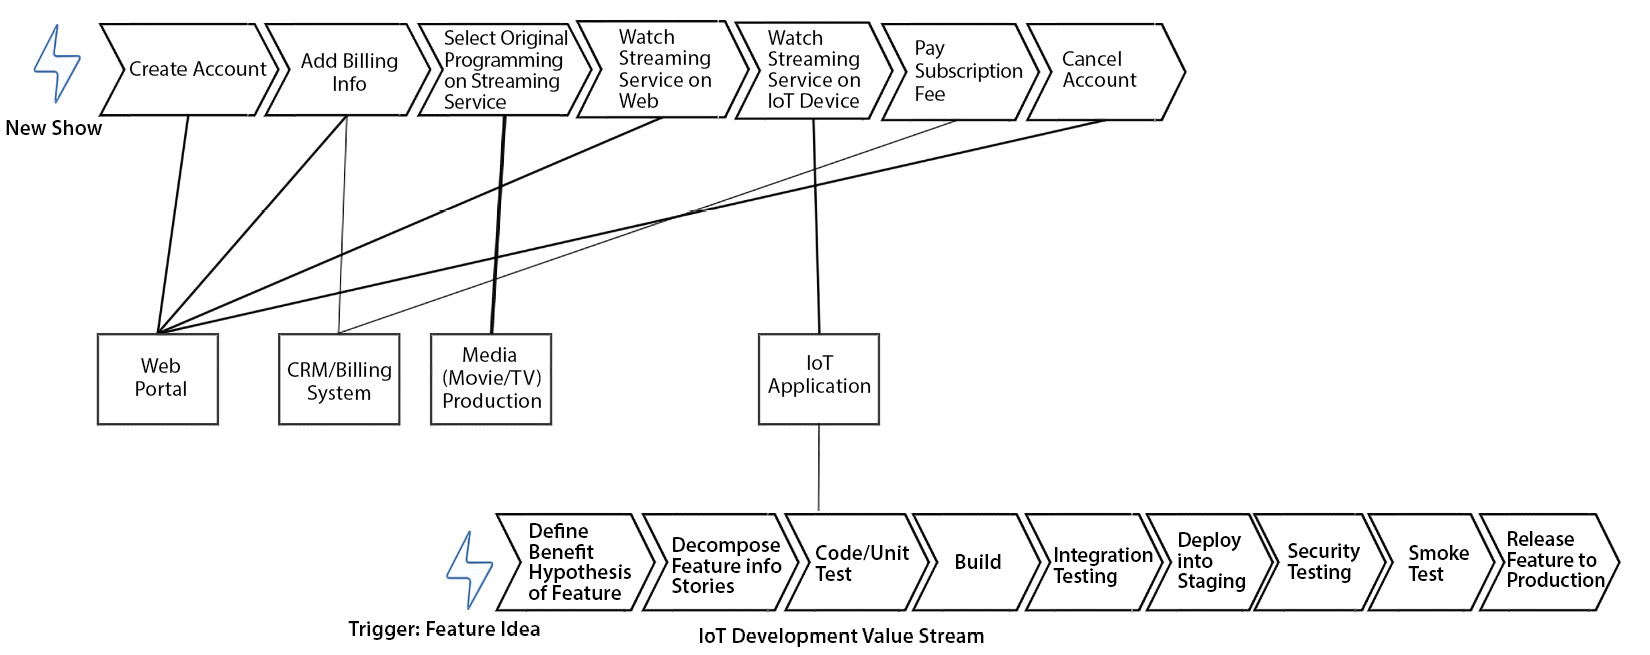
Figure 7.5 – Development value stream with steps
With the steps identified, the team now has the job of detailing each step. Let’s look at what’s involved in that part of the process.
Elaborating on each step
Now that the steps have been identified, we should see what goes on inside each step. The following characteristics are important to understand what occurs in an individual step:
- Batch sizes, if they are defined
- Defects
- WIP in the form of existing queues
- Necessary approvals
- Step metrics such as lead time, cycle time, and wait times
- Resources
Note that the preceding list represents barriers to the free flow of information and materials that should happen between steps. Recording the current state of this list is important for determining the future state. We will look at these in the Finding areas for improvement section.
After thoroughly evaluating each process step, the next step is determining who is responsible for executing each process step, and who receives the finished product. Let’s look at that now.
Finding the people behind the process
Identifying the people involved is beneficial for looking at the potential future-state development value streams to see whether the correct teams or people are involved as well as whether the workload can be met by the existing teams.
We will focus on the following two roles within each step of the value stream:
- The people who perform the work identified in the process step.
- The people who are the recipients of the work done in the process step. They may be internal customers in that they receive information and material from the end of the process step to continue work in the next process step, or they may be external customers.
From what we have collected, we have a good idea of the present state of our development value stream. We will now look at what opportunities there may be for improvement.
Finding areas for improvement
Once the current state of the development value streams has been identified, the mapping team can look for areas for improvement and create a future-state development value stream. One other thing they’ll create is an improvement plan to reach that future state.
To reach that future state, the mapping team will need to apply metrics to the current-state development value stream. These metrics will be taken at each step and then integrated into the metrics that evaluate the entire development Value Stream.
The complete picture of the current development value stream and the future-state development value stream is kept together in a DevOps transformation canvas. This canvas puts the work of the entire workshop in one place, allowing us to see where we are and where we want to go.
Let’s start looking at our future state by examining the current state metrics for our development value stream steps.
Process step metrics
During the workshop, we identify metrics at each step to determine whether that step is a bottleneck that inhibits flow. By taking these measurements, we look to find bottlenecks and get optimal results in our future-state development Value Stream.
We measure the following metrics for each step in our current-state development value stream:
- The lead time
- The process time
- The percent complete and accurate (%C&A)
Let’s take a close look at these metrics now.
The process time and lead time
When looking at an individual process step, we want to know how long it takes from when it leaves the previous process step or trigger to the point it leaves the process step. This total time is known as lead time.
Within the lead time, there may be idle times when the team executing the process step is waiting, perhaps for approval or review. Or, there may be times when value-adding work is being performed. These periods of activity within the process step are known as process time.
We previously talked about cycle time in Chapter 4, Leveraging Lean Flow to Keep the Work Flowing, where we saw that cycle time was related to the batch size and the size of the queue the team had worked on. If the team were working on a batch of items, the cycle time would be related to the process time by the following equation:

With this equation, if the team were working on one item at a time, its cycle time and process time would be equal.
Let’s look at an example from our development value stream where we focus on two steps in the value stream, build and integration testing. If building and testing are done manually with no automation, there may be delays after the build step is completed when someone takes the completed build and starts the integration testing. The integration testing takes 3 hours to complete. A typical delay for the handoff from build to integration testing is 5 hours. This makes our process time for integration testing equal to 3 hours. Hence, our lead time for integration testing is our process time (3 hours) plus our handoff delay time (5 hours), or equal to 8 hours overall.
It’s important to note that there may be different time scales involved between lead time and process time. Process time involves a calendar of business days (5 days per week), and each business day is made up of 8 hours. The lead time typically uses the standard calendar of 7 days a week, with each day composed of 24 hours. There may be exceptions in process time, particularly where geographically distributed development allows for efforts to follow the sun. Teams should also be clear on the distinction between business weeks versus calendar weeks.
The %C&A
Another process step metric is determined not by the people executing the process step, but by the recipients of the information or materials of the process step so they can execute the next process step.
These customers or recipients will be asked what percentage of the deliverables they receive are free of defects and can be used as is. This percentage is known as the %C&A.
Knowing the %C&A is important for identifying improvements. Process steps with low %C&A scores will have higher lead times, due to the need to perform rework.
Let’s look at the two steps in our development value stream, build and integration testing. If a build leaving the build step fails 20% of the time, then when it reaches the integration testing step the %C&A will be 100% - 20% = 80%.
Once the individual process step metrics are determined for all the process steps, you can calculate the composite value stream metrics for the entire development value stream.
Value stream metrics
With individual process step metrics discovered, the mapping team members can calculate metrics for the entire current-state development value stream. These metrics are composite metrics; that is, they are calculated by adding or multiplying together the individual process step metrics.
The following set of metrics is calculated to determine the overall performance of the development value stream:
- The total process time
- The total lead time
- The activity ratio
- Rolled %C&A
Let’s see how to calculate these metrics.
The total process time and total lead time
We want to evaluate for the development value stream how long it takes from the initial trigger to the release of a feature. That can be calculated by taking the sum of each process step’s lead time. This sum is known as the total lead time:

Another composite metric to look at is how much time in the development value stream is active development time. To do that, we can add together all of the process times from each process step. That sum is called the total process time:

The total process time and total lead time are used to calculate the metric we will see next.
The activity ratio
Once we have the total process time and total lead time, we may want to look at the productivity of the development value stream. To do this, we will look at the ratio of total process time to total lead time. This ratio is called the activity ratio:

We now have a measure of how productive the development value stream is. The next metric we’ll look at shows whether quality is embedded into the value stream.
Rolled %C&A
Remember that the %C&A is the measurement that people responsible for the next process step give to each process step, based on whether the deliverable is usable for continued processing. To determine the %C&A for the entire value stream, we look to the rolled %C&A.
To determine the rolled %C&A, we multiply together the %C&A of all of the process steps. We then multiply that value by 100 to get a percentage:

Metrics such as the process time, lead time, and %C&A provide important data to determine where the bottlenecks to flow are occurring. To improve our development value stream, we need to see what the ideal future development value stream looks like. Let’s explore how to do that now.
Identifying the future development value stream
While identifying the development value stream, a lot of discussions may be generated by what the steps of the Value Stream should be versus what they actually are. Such differing views are beneficial to understanding the “ideal” development Value Stream and may provide inputs as to the shape of the evolution of the development Value Stream.
Mapping the future-state Value Stream may occur after the current Value Stream has been mapped and is running to collect data. This data is valuable for highlighting bottlenecks to flow and other weaknesses.
Karen Martin and Mike Osterling, in Value Stream Mapping: How to Visualize Work and Align Leadership for Organizational Transformation, recommend looking at the following perspectives when approaching the future Value Stream:
- Determining the correct steps in the Value Stream
- Looking for flow
- Looking for continuous improvement
Let’s look at each of these perspectives in detail.
Fixing the process and steps
A key focus of Lean thinking is the elimination of waste. We can apply that focus to our future-state Value Stream mapping by looking for processes and steps that do not add value and removing them. We start by categorizing the steps as value-added, necessary non-value-added, and unnecessary non-value-added work. We attempt to focus on removing unnecessary non-value-added work first. Next, we reevaluate the necessary non-value-added work to see whether it can be reduced, or whether it can be reclassified as unnecessary non-value-added work and can be eliminated.
When removing these steps, it’s important to consider the reason for these steps in the first place and ensure that this reason can still stand even with the removal of the step. An example of this is an inspection step near the end of our Value Stream. The reason for this step may be to ensure quality. If the Value Stream contains automated testing steps at various levels, the inspection step may be removed without harming quality.
Another way of fixing our Value Stream may be to add additional processes and steps. It may seem counterintuitive to add steps if the focus is to remove waste, but the addition of steps, even on a temporary basis, allows teams to establish new ways of doing things on the Value Stream so unnecessary non-value-added work can be removed at a later time. If we look at improving quality, we may want to add testing steps to our Value Stream while keeping the inspection steps so that the inspections can be removed once we have confidence in the testing.
Looking for flow
It may not be enough that we have the correct steps in our Value Stream. We want to ensure that work moves from step to step in our Value Stream, without problems or delays. For this reason, we look to ensure that flow is occurring in our Value Stream.
The metrics that we have gathered for each step in our Value Stream (process time, lead time, and %C&A) are important for fixing flow. They help determine which steps are the bottlenecks in the Value Stream. We look for those steps where the lead times include long wait times. We also look at steps that have low %C&A percentages to fix, because those steps indicate that rework is being performed.
Once we’ve found the steps, we apply the theory of constraints that Eliyahu M. Goldratt identified in his book The Goal. The theory of constraints details the following steps for dealing with bottlenecks and achieving flow:
- Identify the constraint.
- Decide how to overcome the constraint.
- Focus on overcoming the constraint, subordinating all other concerns.
- Overcome the constraint.
- Once the constraint has been overcome, other constraints (bottlenecks) may appear. Go back to step 1 to deal with them.
Removing bottlenecks at a specific step may introduce other bottlenecks at other steps, but the overall metrics (total process time, total lead time, and rolled %C&A) will show improvement.
Looking for continuous improvement
This combination of optimizing steps and removing bottlenecks may give us a better Value Stream, but now we want to make sure we have ways of ensuring that the performance is improving. For this reason, we will establish two to five key performance indicators (KPIs) and regularly track their measurements. The KPIs may deal with measurements for cost, quality, safety, and morale.
After collecting and calculating the information about the current- and future-state development value streams, it may be beneficial to place this information in a single location for reference as we seek to improve our Value Stream. We’ll look at one such location, the DevOps transformation canvas.
The DevOps transformation canvas
The DevOps transformation canvas can serve as the backdrop to the mapping of your development Value Stream, as well as identifying the future state and implementation steps to take us there.
The DevOps transformation canvas has areas for the current-state Value Stream and the following characteristics:
- The trigger
- The first step
- The last step
- The demand rate
- Value Stream metrics (total process time, total lead time, activity ratio, and rolled %C&A)
For identifying the ideal future state, the DevOps transformation canvas includes the following areas to fill out during the workshop:
- Target Value Stream metrics (total process time, total lead time, activity ratio, and rolled %C&A)
- The boundaries/limitations
- Improvement items
An example DevOps transformation canvas is as follows.
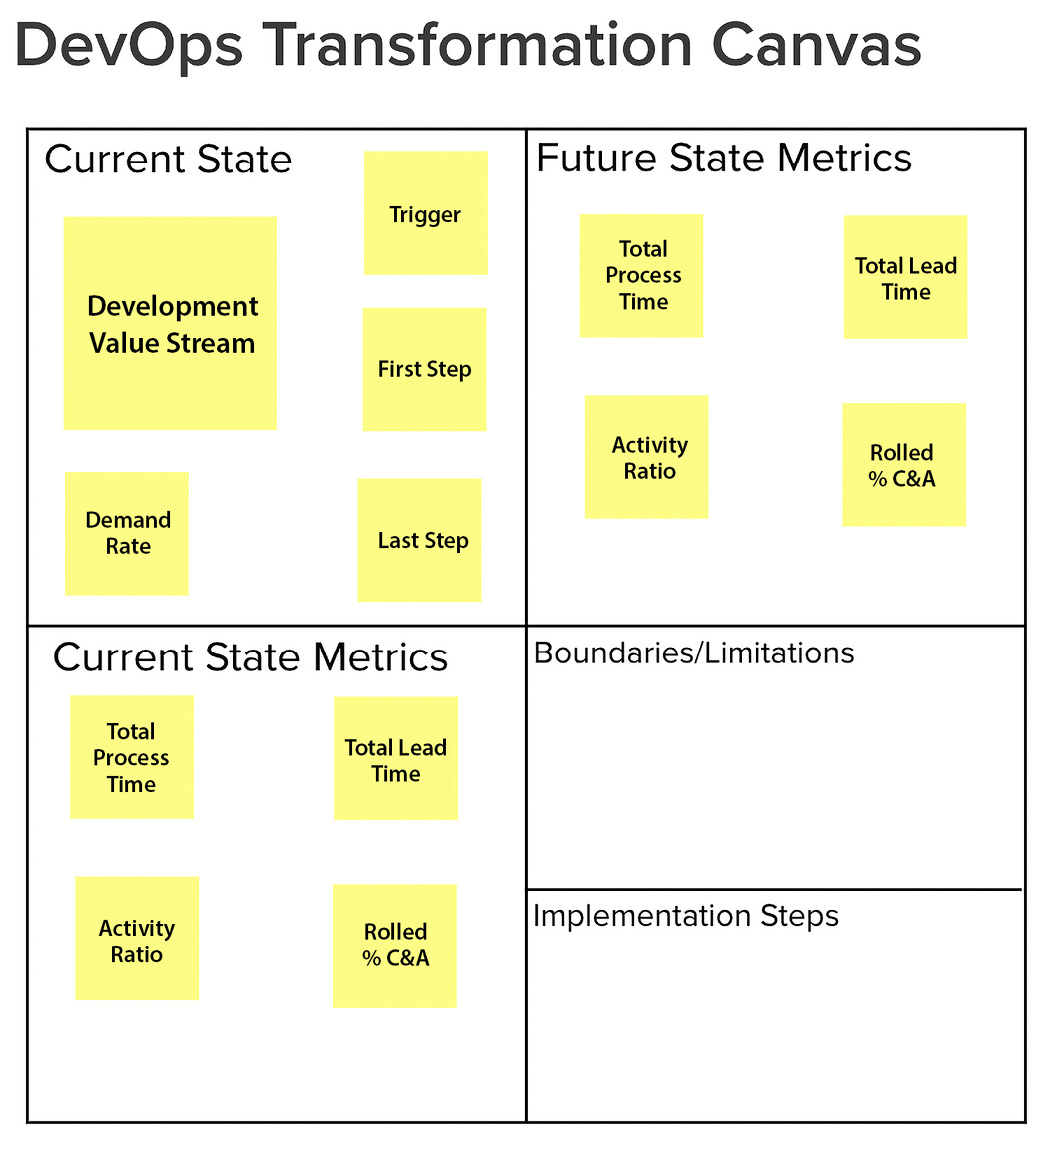
Figure 7.6 – DevOps transformation canvas
With the completion of the workshop, the work begins on improving our development value streams and measuring the effectiveness of the improvements. This is the topic we will delve into in our next chapter.
Summary
In this chapter, we took an extensive look at value streams. We saw that aligning our activities in terms of value streams is a key approach used in DevOps and is a major part of transforming SAFe through its implementation roadmap.
We started out by looking at the current state of our organization. We prepared the team to look at mapping our value streams and looked at how we receive work through Gemba walks. From this examination, we saw what our process is and any deficiencies in it.
We then looked at discovering and mapping our value streams. We started by mapping our operational value streams, which connect us to our customers. From there, we started looking at the solutions that our operational value streams use to bring value to our customers. With the solutions in hand, we looked at the development value streams that create and maintain those solutions. Finally, we looked at metrics to view the current state of the development Value Stream and measure our improvement as we strive toward the future-state development Value Stream.
Now that we have identified our development value streams, we will look for feedback to see whether our improvements are having the desired effect. The next chapter shows us how to collect that feedback.
Questions
- Which of these things is not identified when doing Value Stream mapping?
- Trigger
- Demand rate
- Location
- First step
- Which of the following identifies the time taken to complete a process step from handing off from the previous process step?
- Demand rate
- Lead time
- Process time
- Cycle time
- Who determines the %C&A of a process step?
- The customer
- The people that work on the process step
- The people that work on the next process step
- The people that work on the previous process step
For the remaining questions, use the following illustrated Value Stream:

Figure 7.7 – Illustration of a Value Stream
- What is the total process time?
- 0.5 hours
- 2 hours
- 1 hour
- 5 hours
- What is the total lead time?
- 5 hours
- 3 hours
- 1 hour
- 10 hours
- What is the activity ratio?
- 1.0
- 0.66
- 0.25
- 0.5
- What is the rolled %C&A?
- 100%
- 490%
- 90%
- 400%
Further reading
- The Phoenix Project: A Novel About IT, DevOps, and Helping Your Business Win by Gene Kim, George Spafford, and Kevin Behr – A “must-read” introduction to DevOps. This book introduces the Three Ways that we use to examine VSM.
- https://www.scaledagileframework.com/implementation-roadmap/ – The reference from SAFe that talks about the implementation roadmap.
- https://www.scaledagileframework.com/development-value-streams/ – An article from SAFe that talks about development value streams and their relationship to operational value streams.
- Driving DevOps with Value Stream Management: Improve IT Value Stream Delivery with a Proven VSM Methodology to Compete in the Digital Economy by Cecil “Gary” Rupp – The reference for VSM that includes guidance on Value Stream mapping. This is a resource used by the VSM Consortium.
- Value Stream Mapping: How to Visualize Work and Align Leadership for Organizational Transformation by Karen Martin and Mike Osterling – The reference for how to perform Value Stream mapping.
- The Goal by Eliyahu M. Goldratt – This reference introduces the theory of constraints.