HOUR 20. Debugging the Stored Procedures That You Write
A good programmer is not necessarily one who can get things right the first time. To be fully effective as a .NET programmer, you need to master the art of debugging—the process of troubleshooting your application. Debugging involves locating and identifying problem areas within your code and is a mandatory step in the application-development process. Fortunately, the Visual Studio 2005 programming environment provides excellent tools to help you with the debugging process. Using the Visual Studio 2005 debugging tools, you can step through your code, setting watches and breakpoints as needed. In this hour you’ll learn:
• How to harness the power of the Immediate window
• How to use breakpoints to troubleshoot
• How to step through a stored procedure
• How to set the next statement to execute
• How to use the Calls window to determine program flow
• How to use the Locals window
Harnessing the Power of the Immediate Window
The Immediate window serves several purposes. It provides you with a great way to test .NET stored procedures, it enables you to inquire about and change the value of variables while your code is running, and it enables you to view the results of Debug.Print statements. To open the Immediate window while viewing programming code, do one of three things:
• Click the Immediate window tool on the Debug toolbar.
• Choose Debug, Windows, Immediate.
• Press Ctrl+G.
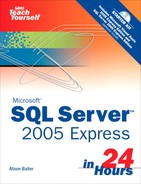
Figure 20.1 shows the Immediate window.
Figure 20.1. The Immediate window enables you to test functions and to inquire about and change the value of variables.
By the Way
The Debug tools are available on a separate toolbar. To show the Debug toolbar, right-click any toolbar or menu bar and select Debug from the list of available toolbars.
Testing Values of Variables and Properties The
Immediate window enables you to test the values of variables and properties as your code executes. This can be quite enlightening as to what is actually happening within your code.
To practice with the Immediate window, you do not even need to be executing code. To invoke the Immediate window while in the .NET programming environment, press Ctrl+G. To see how this works, follow these steps:
1. Run the frmStart form from the TestDebug project on the accompanying CD-ROM.
2. Type a value into the text box on the form.
3. Click the Start command button. You are placed in Break mode. You will learn much more about Break mode later.
4. Press Ctrl+G to open and activate the Immediate window. The debugger places you within the Immediate window.
5. Type ?Forms.frmStart.txtTest.Text and press Enter. The value of the text in the text box appears in the Immediate window.
6. Type ?Forms.frmStart.txtTest.Visible and press Enter. The word True appears on the next line, indicating that the control is visible.
7. Type ?Forms.frmStart.txtTest.Enabled and press Enter. The word True appears on the next line, indicating that the control is enabled.
Your screen should look like the one shown in Figure 20.2. You can continue to request the values of properties or variables within your .NET code.
Figure 20.2. Using the Immediate window to test the values of properties.

Setting Values of Variables and Properties
Not only can you display things in the Immediate window, but you also can use the Immediate window to modify the values of variables and controls as your code executes. This feature becomes even more valuable when you realize that you can re-execute code within a procedure after changing the value of a variable. Here’s how this process works:
1. Invoke the Immediate window, if necessary. Remember that you can do this by pressing Ctrl+G.
2. Type Forms.frmStart.txtTest.Text = "Hello World" in the immediate pane. Press Enter. The value in the text box changes to "Hello World".
3. Type Forms.frmStart.txtTest.Visible = False. Press Enter. .NET hides the txtTest control on the frmStart form.
4. Type Forms.frmStart.txtTest.Visible = True. Press Enter. .NET shows the txtTest control on the frmStart form.
5. Type Forms.frmStart.Text = "Form Caption". Press Enter. The caption of the form changes.
6. Press F5 to complete the code execution. The Immediate window and your form now look like those shown in Figures 20.3 and 20.4, respectively.
Figure 20.3. Setting the values of properties, using the Immediate window.

Figure 20.4. The results of using the Immediate window to set the values of properties.

The Immediate window is an extremely valuable testing and debugging tool. The examples here barely begin to illustrate its power and flexibility.
Watch Out!
Changes you make to data while working in the Immediate window are permanent. On the other hand, changes you make to the properties of controls or the values of variables with the form are not permanent.
Some people think that data changes made in the Immediate window are not permanent. In other words, if you modify the last name of a customer, some people believe that the change will not be permanent (but, of course, it is). Other people think that if they change the BackColor property of a control, the change will persist in the design environment (but, of course, it won’t).
Practicing with the Built-In Functions
In addition to being able to test and set the values of properties and variables with the Immediate window, you can test any Visual Basic .NET or C# function. To do so, type the function and its arguments in the Immediate window, preceded by a question mark. This code returns the month of the current date, for example:
?datepart(DateInterval.Month, Today)
This tells you the date one month after today’s date:
?dateadd(DateInterval.Month,1,Today)
This tells you how many days exist between the current date and the end of the millennium:
?datediff(DateInterval.Day,Today,#12/31/2999#)
Executing Subroutines, Functions, and Methods
In addition to enabling you to test any Visual Basic .NET or C# function, the Immediate window lets you test any user-defined subroutine, function, or method. This is a great way to debug your user-defined procedures. To see how this works, follow these steps:
1. Invoke the Immediate window if it is not already visible.
2. Type ?MiscCode.ReturnInitsFunc("Bill","Gates"). This calls the user-defined function ReturnInitsFunc in the class called MiscCode, sending "Bill" as the first parameter and "Gates" as the second parameter. The value B.G. appears in the Immediate window. This is the return value from the function.
3. Type Call MiscCode.ReturnInitsSub("Bill","Gates"). This calls the user-defined subroutine ReturnInitsSub of the MiscCode class, sending "Bill" as the first parameter and "Gates" as the second parameter. The value B.G. appears in a message box.
Notice the difference between how you call a function and how you call a subroutine. Because the function returns a value, you must call it by using a question mark. On the other hand, when calling a subroutine, you use the Call keyword.
By the Way
You also can call a subroutine from the Immediate window with this syntax:
RoutineName(Parameter1, Parameter2, ....)
Invoking the Debugger
You can invoke the .NET debugger in several ways:
• Place a breakpoint in your code.
• Place a watch in your code.
• Press Ctrl+Break while the code is running.
• Insert a Stop statement in your code.
A breakpoint is an unconditional point at which you want to suspend code execution.
A watch is a condition under which you want to suspend code execution. You might want to suspend code execution when a counter variable reaches a specific value, for example.
A Stop statement is permanent. In fact, if you forget to remove Stop statements from your code, your application stops execution while the user is running it.
Using Breakpoints to Troubleshoot
As mentioned, a breakpoint is a point at which the debugger will unconditionally halt the execution of code. You can set multiple breakpoints in your code. You can add and remove breakpoints as your code executes.
A breakpoint enables you to halt your code execution at a suspicious area of code. This enables you to examine everything that is going on at that point in your code execution. By strategically placing breakpoints in your code, you quickly can execute sections of code that you already debugged, stopping only at problem areas.
To set a breakpoint, follow these steps:
1. Place your cursor on the line of code where you want to invoke the debugger.
2. You can insert a breakpoint in one of four ways:
• Press your F9 function key.
• Click in the gray margin area to the left of the line of the code that will contain the breakpoint.
• Click the Toggle Breakpoint button on the Debug toolbar.
• Choose Debug, Toggle Breakpoint.
The line of code containing the breakpoint appears in a different color, and a dot appears, indicating the breakpoint.
3. Run the form containing the breakpoint. The debugger suspends execution just before executing the line of code where you placed the breakpoint. The statement that is about to execute appears in a contrasting color (the default is yellow).
Now that you have suspended your code, you can step through it one line at a time, change the value of variables, and view your call stack, among other things.
Keep in mind that a breakpoint is actually a toggle. If you want to remove a breakpoint, click in the gray margin area, press F9, or click Toggle Breakpoint on the Debug toolbar.
It is easiest to get to know the debugger by actually using it. The following example gives you hands-on experience in setting and stopping code execution at a breakpoint. The example is developed further later in the hour.
By the Way
The sample code includes the example on the frmStart form that we have been working with. The code is invoked from the btnDebug command button and calls the class clsFuncs.
Start by creating a form called frmDebug that contains a command button called btnDebug. Give the button the caption Start Debug Process by setting its Text property. Place the following code in the Click event of the command button:
Sub btnDebug_Click ()
Call clsFuncs.Sub1
End Sub
Create a class called clsFuncs. Enter three functions into the module:
Public Shared Sub Sub1()
Dim intTemp As Integer
intTemp = 10
Debug.Print "We Are Now In Sub1()"
Debug.Print intTemp
Call Sub2
End Sub
Public Shared Sub Sub2 ()
Dim strName As String
strName = "Bill Gates"
Debug.Print "We Are Now In Sub2()"
Debug.Print strName
Call Sub3
End Sub
Public Shared Sub Sub3 ()
Debug.Print "We Are Now In Sub3()"
MsgBox "Hi There From The Sub3() Sub Procedure"
End Sub
Now you should debug. Start by placing a breakpoint within the Click event of btnDebug on the line called Call clsFuncs.Sub1. Here are the steps:
1. Click anywhere on the line of code that says Call clsFuncs.Sub1.
2. Click in the gray margin area, press the F9 function key, click the Toggle Breakpoint button on the Debug toolbar, or choose Debug, Toggle Breakpoint. The line with the breakpoint turns a different color (red by default).
3. Run the application and click the Start Debug Process button. Execution suspends just before the line where you placed the breakpoint executes. The debugger displays the line that reads Call Sub1 in a different color (by default, yellow), indicating that it is about to execute that line. (See Figure 20.5.)
Figure 20.5. Code execution halted at a breakpoint.

Stepping Through Code
The .NET programming environment gives you three main options for stepping through your code. Each one is slightly different. The Step Into option enables you to step through each line of code within a subroutine or function, whereas the Step Over option executes a procedure without stepping through each line of code within it. The Step Out option runs all code in nested procedures and then returns you to the procedure that called the line of code where you are. Knowing the correct option to use to solve a particular problem is an acquired skill that comes with continued development experience.
Using Step Into
When you reach a breakpoint, you can continue executing your code one line at a time or continue execution until you reach another breakpoint. To step through your code one line at a time, click Step Into on the Debug toolbar, press F8, or choose Debug, Step Into.
The following example illustrates the process of stepping through your code, printing the values of variables to the Immediate window, and using the Immediate window to modify the values of variables.
You can continue the debug process from the breakpoint you set in the previous example. Step two times (press F8). You should find yourself within Sub1, about to execute the line of code intTemp = 10 (see Figure 20.6). Notice that the debugger did not stop on the line Dim intTemp As Integer. The debugger does not stop on variable declarations.
Figure 20.6. The Immediate window halted within Sub1.

The code is about to print the Debug statements to the Immediate window. Take a look by opening the Immediate window. None of your code has printed anything to the Immediate window yet. Press F8 (step) three more times until you have executed the line Debug.Print(intTemp). Your screen should look like Figure 20.7. Notice the results of the Debug.Print statements.
Figure 20.7. The Immediate window with entries generated by Debug.Print statements.

Now that you have seen how you can display variables and the results of expressions to the Immediate window, take a look at how you can use the Immediate window to modify values of variables and controls. Start by changing the value of intTemp. Click the Immediate window and type intTemp = 50. When you press Enter, you actually modify the value of intTemp. Type ?intTemp, and you’ll see that the debugger echoes back the value of 50. You also can see the value of intTemp in the Locals window. Notice in Figure 20.8 that the intTemp variable appears along with its value and type.
Figure 20.8. The Immediate and Locals windows after the value of intTemp has been modified.

By the Way
To invoke the Locals window, select Debug, Windows, Locals, or click the Locals button on the Debug toolbar.
Executing Until You Reach the Next Breakpoint
Suppose that you have reached a breakpoint, but you realize that your problem is farther down in the code execution. In fact, the problem is actually in a different function. You might not want to continue to move one step at a time down to the offending function. Use the Procedure drop-down menu to locate the questionable function, and then set a breakpoint on the line where you want to continue stepping. You now are ready to continue code execution until the debugger reaches this line. To do this, click Continue on the Debug toolbar, press F5, or choose Run, Continue. Your code continues to execute, stopping at the next breakpoint. To see how this works, continue the Debug process with the next example.
By the Way
You also can opt to resume code execution to the point at which your cursor is located. To do this, select Run to Cursor from the Debug menu, or press Ctrl+F8.
Suppose that you realize your problem might be in Sub3. You do not want to continue to move one step at a time down to Sub3. No problem. Use the Procedure drop-down menu to view Sub3, as shown in Figure 20.9. Set a breakpoint on the line that reads Debug. Print("We Are Now In Sub3()"). You are ready to continue code execution until the debugger reaches this line. Click Continue on the Debug toolbar, press F5, or choose Run, Continue. Your code continues to execute, stopping on the breakpoint you just set. Press F5 again. The code finishes executing. Return to the Form View window.
Figure 20.9. Using the Procedure drop-down menu to view another function.

Using Step Over
Sometimes you already have a subroutine fully tested and debugged. You want to continue stepping through the routine, but you don’t want to watch the execution of subroutines. In this case, you use Step Over. To step over a subroutine or function, click Step Over on the Debug toolbar, press Shift+F8, or choose Debug, Step Over. The code within the subroutine or function you are stepping over executes, but you do not step through it. To experiment with the Step Over feature, follow the next example.
Click the open form and click the Start Debug Process button one more time. Because you did not remove the existing breakpoints, the debugger places you on the line of code that reads Call clsFuncs.Sub1(). Select Delete All Breakpoints from the Debug menu, or use the Ctrl+Shift+F9 keystroke combination to remove all breakpoints. Step (press F8) five times until you are about to execute the line Call Sub2. Suppose that you have tested Sub2 and Sub3 and know that they are not the cause of the problems in your code. With Sub2 highlighted as the next line that will execute, click Step Over on the toolbar. Notice that the debugger executes Sub2 and Sub3, but that you now are ready to continue stepping in Sub1. In this case, the debugger places you on the End Sub line immediately following the call to Sub2.
Using Step Out
You use the Step Out feature to step out of the procedure where you are and to return to the procedure that called the line of code where you are. You use this feature when you have accidentally stepped into a procedure that you realize you have fully tested. You want to execute all the code called by the procedure you are in and then step out to the calling procedure so that you can continue with the debugging process. To test how this works, follow this example.
1. Place a breakpoint on the call to Sub2.
2. Click the Reset button on the toolbar to halt code execution.
3. Activate the frmDebug form and click the Start Debug Process command button.
4. Step once to place yourself in the first line of Sub2.
5. Suppose that you realize you just stepped one step too far. You really intended to step over Sub2 and all the procedures it calls. No problem! Click the Step Out button to step out of Sub2 and return to the line following the line of code that called Sub2. In this case, you should find yourself on the End Sub statement of Sub1.
Setting the Next Statement to Execute
After you have stepped through your code, watched the logical flow, and modified some variables, you might want to re-execute the code beginning at a prior statement. The easiest way to do this is to click and drag the yellow arrow in the margin to the statement on which you want to continue execution. If you prefer, you can click anywhere in the line of code where you want to commence execution and then choose Debug, Set Next Statement. Regardless of the method you chose, notice that the contrasting color (usually yellow)—indicating the next line of code that the debugger will execute—is now placed over that statement. You then can step through the code by pressing F8, or you can continue normal code execution by pressing F5. The debugger enables you to set the next line it will execute within a procedure only. You can use this feature to re-execute lines of code or to skip over a problem line of code.
The following example walks you through the process of changing the value of a variable and then re-executing code after you have changed the value.
The preceding example left you at the last line of code (the End Sub statement) within Sub1. You want to change the value of intTemp and re-execute everything.
1. Go to the Immediate window and type intTemp = 100.
2. You need to set the next statement to print on the line that reads Debug. Print("We Are Now in Sub1()"). To do this, click and drag the yellow arrow from the End Sub statement to the Debug. Print("We Are Now In Sub1()") line. Notice the contrasting color (yellow), indicating that is the next statement of code that the debugger will execute.
3. Press F8 (step) two times. The code now executes with intTemp set to 100. Observe the Immediate window again. Notice how the results have changed.
Viewing the Call Stack
You have learned how to set breakpoints, step through and over code, use the Immediate window, set the next line to be executed, and continue to run until you reach the next breakpoint. When you reach a breakpoint, it often is important to see which functions the code called to bring you to this point. This is where the Calls feature can help.
To bring up the Call Stack window, click the Call Stack button on the toolbar or choose Debug, Windows, Call Stack. The window in Figure 20.10 appears. If you want to see the line of code that called a particular function or subroutine, double-click that particular function or click the function and then click Show. Although the debugger does not move your execution point to the calling function or subroutine, you can view the code within the procedure. If you want to continue your code execution, press F8. You move back to the procedure through which you were stepping, and the next line of code executes. If you press F5, your code executes until it reaches another breakpoint or watch. If you want to return to where you were without executing additional lines of code, choose Debug, Show Next Statement.
Figure 20.10. Viewing the stack with the Call Stack window.

To test this process, perform the steps in the next example:
1. Click the Reset button to stop your code execution if you are still in Break mode.
2. Remove the breakpoint on the call to Sub2.
3. Move to the procedure called Sub3 in clsFuncs. Set a breakpoint on the line Debug.Print("We Are Now in Sub3()").
4. Run the frmDebug form and click the command button. The debugger places you in Sub3 on the line where you set the breakpoint.
5. Bring up the Call Stack window by selecting Debug, Windows, Call Stack. If you want to see the line of code that called Sub2 from Sub1, double-click Sub1. Although the debugger does not move your execution point to Sub1, you can view the code within the procedure. To return to the next line of code to execute, choose Debug, Show Next Statement.
6. Press F5, and the rest of your code executes.
Working with the Locals Window
The Locals window enables you to see all the variables on the current stack frame and to view and modify their values. To access the Locals pane, click Locals on the toolbar, or select Debug, Windows, Locals. Three columns appear: Name, Value, and Type. The Name column shows you the variables, user-defined types, arrays, and other objects visible within the current procedure. The Value column displays the current value of a variable or expression. The Type column tells you what type of data a variable contains. The Locals window displays variables that contain hierarchical information—arrays, for example—with an Expand/Collapse button.
The information contained within the Locals window is dynamic. The debugger automatically updates it as it executes your code and as you move from routine to routine. Figure 20.11 illustrates how you can use the Locals window to view the variables available with the Sub2 subroutine. To try this example yourself, remove all existing breakpoints. Place a breakpoint in Sub2 on the line of code that reads Debug.Print(strName). Click Reset if you are still executing code, and click the Start Debug Process command button to execute code until the breakpoint. Click the Locals Window button on the Debug toolbar. View the contents of the variable strName.
Figure 20.11. Viewing the Locals window.

By the Way
You can change the value of a variable in the Locals window, but you cannot change its name or type.
Working with Watch Expressions
Sometimes it is not enough to use the Immediate window to test the value of an expression or variable. You might want to keep a constant eye on the expression’s value. After you add a Watch expression, it appears in the Watch window. As you’ll see, you can create several types of watches.
Using Auto Data Tips
The quickest and easiest way to view the value contained within a variable is to use Auto Data Tips, which is an option for working with modules. This feature is available only when your code is in Break mode. While in Break mode, simply move your mouse over the variable or expression whose value you want to check. A tip appears with the current value.
Using a Quick Watch
A quick watch is the most basic type of watch. To add a quick watch, highlight the name of the variable or expression you want to watch, right-click, and select Quick Watch. The QuickWatch dialog box, shown in Figure 20.12, appears. You can click Add to add the expression as a permanent watch or choose Cancel to view the current value without adding it as a watch. If you click Add Watch and Close, a Watch window appears, like the one in Figure 20.13. The next section discusses this window in more detail.
Figure 20.12. The Quick Watch dialog box enables you to quickly view the value of a variable or add an expression as a permanent watch.
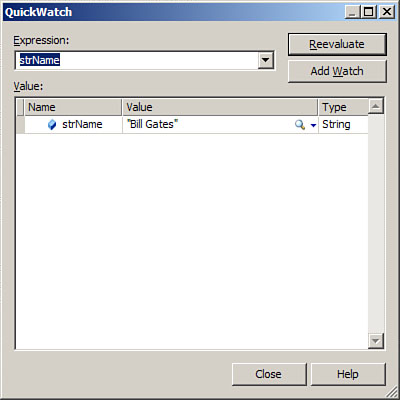
Figure 20.13. The Watches window with a Watch expression.

Adding a Watch Expression
As you saw, you can use a quick watch to add a Watch expression. You can also add a watch by right-clicking the variable and selecting Add Watch, or by clicking and dragging the variable to the Watch window.
The next example walks you through the process of adding a watch and viewing the Watch variable as you step through your code. It illustrates how a variable goes in and out of scope, and changes value, during code execution. To add a watch and then step through your code, follow these steps:
1. To begin, stop code execution if your code is running, and remove any breakpoints you have set.
2. Click within the strName variable in Sub2 and set a breakpoint on the line
strName = "Bill Gates".
3. Run the frmDebug form and click the Command button.
4. Right-click strName and choose Add Watch.
5. View the Watches window and notice that strName has the value of Nothing.
6. Step one time and notice that strName is equal to Bill Gates.
7. Step three more times. Notice that although you are in the Sub3 routine, strName still has the value Bill Gates. This is because the variable is still in memory in the context of clsFuncs.Sub2.
9. Step four more times until you are back on the End Sub statement of Func2. The strName variable is still in context.
10. Step one more time. The strName variable is finally out of context because you have completed the execution of Sub2.
Summary
If programming were a perfect science, there would be no reason to use a debugger. Given the reality of the challenges of programming, though, a thorough understanding of the use of the debugger is imperative. Fortunately, the .NET development environment provides an excellent tool to assist in the debugging process.
Q&A
Q. Explain the difference between a breakpoint and a watch.
A. A breakpoint is an unconditional point at which you want to suspend code execution, whereas a watch is a condition under which you want to suspend code execution.
Q. Explain the difference between Step Into, Step Over, and Step Out.
A. Step Into executes code one line at a time. You use Step Over to execute a subroutine or function without stepping through its code. Finally, you use Step Out to execute the remainder of a subroutine or function without stepping through its code. You return to the procedure that called the subroutine or function in which you were.
A. The call stack shows you which functions the code called to bring you to a specific point in code execution.
Workshop
Quiz
1. What keystroke combination do you use to activate the Immediate window?
2. What key do you press to set a breakpoint?
3. Changes that you make to data while debugging are only temporary (true/false).
4. Changes that you make to variables while debugging are only temporary (true/false).
Quiz Answers
3. False. Changes that you make to data are permanent!
Activities
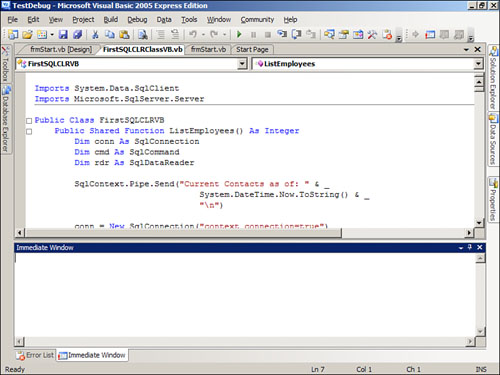
Add a command button to initiate the process of stepping through the routine DeletingData in the FirstSQLCLRVB class of the FirstSQLCLRClassVB project. Modify the connection string to go against test data. Practice stepping through the routine.