HOUR 24. Performance Monitoring
It is important that you build SQL statements that will execute efficiently. Fortunately, SQL Server Management Studio Express provides you with the tools to analyze your SQL statements and ensure that you have built them as efficiently as possible. In this hour you’ll learn about:
• How to execute queries in SQL Server Management Studio Express
• How to display and analyze the estimated execution plan for a query
• How to add indexes to allow queries to execute more efficiently
Executing Queries in SQL Server Management Studio Express
SQL Server 2000 provided a tool called the Query Analyzer. This tool is now built into SQL Server Management Studio Express. You can use this tool to execute and analyze queries that you want to place in stored procedures and views. To execute a query, follow these steps:
1. Click the New Query button on the toolbar (see Figure 24.1). A new query window appears where you can type a SQL statement (see Figure 24.2).
Figure 24.1. Click the New Query button on the toolbar to create a new query.

Figure 24.2. You use the query window to type the SQL statement you want to execute.
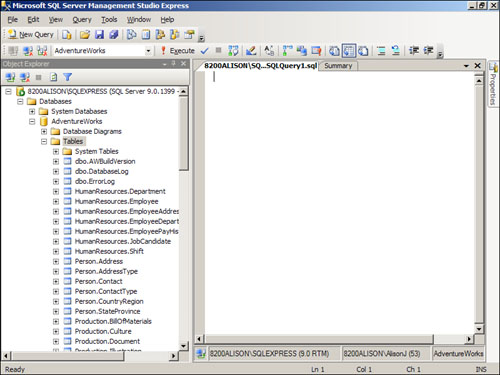
2. Type the desired SQL statement (see Figure 24.3).
Figure 24.3. Type the desired SQL statement in the Query window.
3. Click the Execute button on the toolbar to execute the query. The results appear as in Figure 24.4.
Figure 24.4. After executing the query, the results appear in the Results pane of the Query window.

4. Click the Messages tab to view any messages associated with the execution of the query (see Figure 24.5).
Figure 24.5. The Messages tab of the Results pane shows you any messages associated with the execution of the query.

Displaying and Analyzing the Estimated Execution Plan for a Query
It’s unlikely that you will just want to execute queries in SQL Server Management Studio Express. You also will want analyze those queries to see whether they are executing as efficiently as possible. To analyze a query, follow these steps:
1. Click the New Query button on the toolbar. A new query window appears where you can type a SQL statement.
2. Type the desired SQL statement.
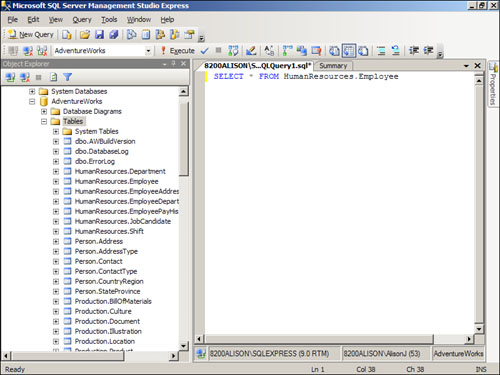
3. Click Display Estimated Execution Plan. Your screen appears as in Figure 24.6.
Figure 24.6. After clicking the Display Estimated Execution Plan toolbar button, you can see the execution plan for the query.
4. Hover your mouse pointer over the various steps in the execution plan. You get more information about each step in the execution plan (see Figures 24.7 and 24.8).
Figure 24.7. If you hover your mouse pointer over each step of the execution plan, you get information about that step in the execution plan.

Figure 24.8. Notice that in the example SQL Server Express is using a clustered index scan when executing the SQL statement.

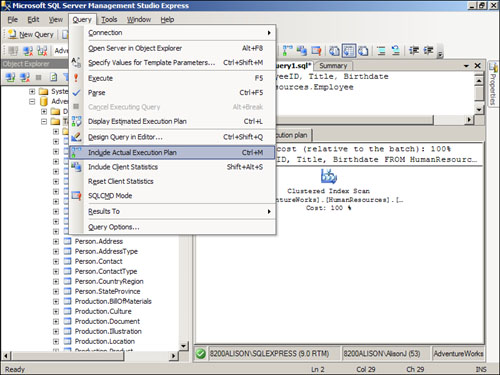
5. If you want to display the execution plan each time that you execute the query, click the Include Actual Execution Plan button on the toolbar. The Execution Plan tab appears each time you execute the query (see Figure 24.9).
Figure 24.9. If you click the Include Actual Execution Plan button on the toolbar, the Execution Plan tab appears each time you execute the query.
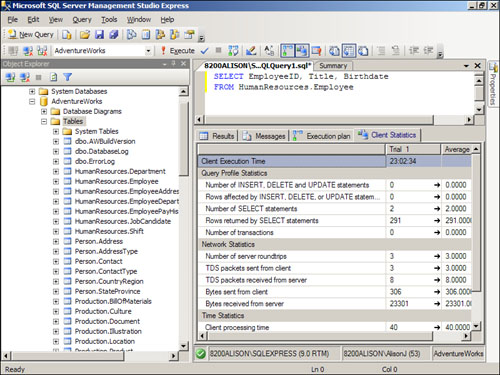
6. To include client statistics each time that you execute the query, click the Include Client Statistic button on the toolbar. After you execute the query, the Client Statistics tab appears as in Figures 24.10 Here you can receive valuable statistical information about the execution of the query. For example, you can determine the number of round trips the client made to the server in executing the query.
Figure 24.10. If you click the Include Client Statistics button on the toolbar, the Client Statistics tab appears each time that you run a query.
Adding Indexes to Enable Queries to Execute More Efficiently
The easiest way to improve the efficiency of the queries that you build is to add indexes to the underlying tables. You can view the results of your efforts easily by using the Execution Plan tab and the Client Statistics tab after the query has executed. Follow these steps:
1. Make sure that you have both the Include Actual Execution Plan and Include Client Statistics toolbar buttons selected.
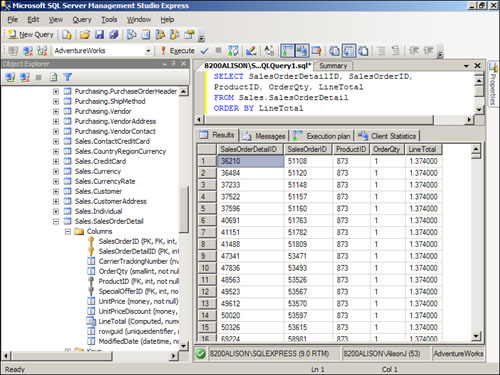
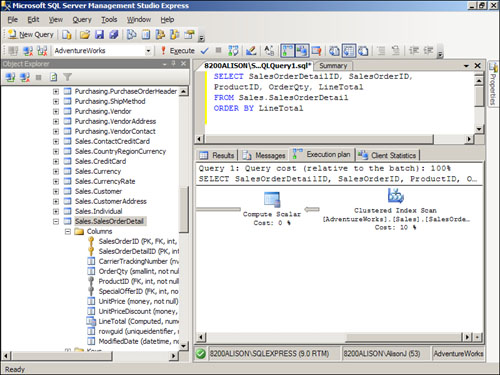
2. Execute a query and order by a field on which there is no index (see Figure 24.11).
Figure 24.11. This query is ordered by LineTotal, for which there is no index.
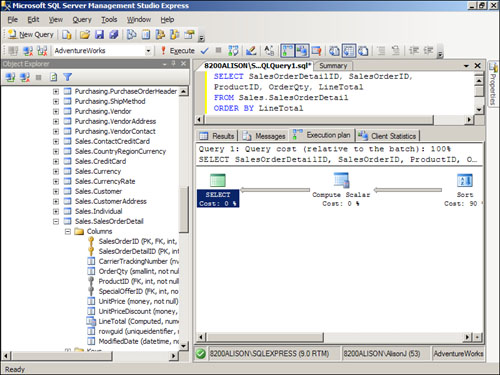
3. Click the Execution Plan tab. Notice that the execution plan includes a sort (see Figure 24.12). A sort is very inefficient when executing a query.
Figure 24.12. Notice that the execution plan for the query includes a sort.
4. Click the Client Statistics tab and note the Total execution time so that you can compare it to the optimized query.
5. Create an index on the field by which you are ordering (see Figure 24.13).
Figure 24.13. Create an index based on LineTotal.

6. Execute the query again.
7. Compare the Execution Plan tab. Notice that the execution plan no longer includes a sort and instead includes a bookmark lookup (see Figure 24.14).
Figure 24.14. After the index has been created, the Execution Plan no longer includes a sort.
8. Compare the Client Statistics tab and note the Total execution time. It should be less than the one without an index.
Setting Query Options
SQL Server Management Studio Express provides you with a plethora of options that you can use to affect how your queries process. To access and modify these options, follow these steps:
1. Select Query Options from the Query Menu. The Query Options dialog appears (see Figure 24.15).
Figure 24.15. The Query Options dialog enables you to modify options that affect how your queries process.

2. Using the General page, you can set options such as determining the maximum number of rows that SQL Server returns before stopping. This valuable setting ensures that you don’t accidentally execute a query that returns millions of rows.
3. Using the Advanced page (see Figure 24.16), you can set additional options. An example is the SET NOCOUNT setting. When turned on, SQL Server refrains from returning the number of rows processed. This improves the performance of your queries.
Figure 24.16. The Advanced page of the Query Options dialog enables you to set additional query options.

4. The ANSI page (see Figure 24.17) enables you to set some of the SQL-92 standard query execution behavior, such as how SQL Server handles nulls.
Figure 24.17. The ANSI page of the Query Options dialog allows you to set some of the SQL-92 standard query execution behavior.

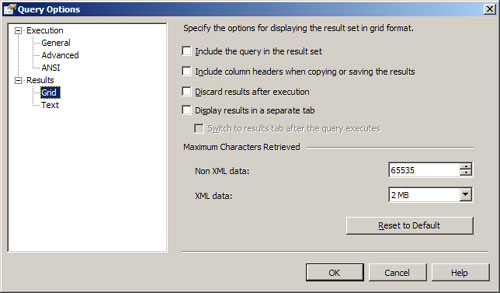
5. The Grid page (see Figure 24.18) of the Query Options dialog enables you to affect how SQL Server displays the output from the query.
Figure 24.18. The Grid page of the Query Options dialog enables you to affect how SQL Server displays the output from the query.
6. The Text page (see Figure 24.19) of the Query Options dialog enables you to set the options that apply when you opt to display the result set in text format, or to redirect it to an output file.
Figure 24.19. The Text page of the Query Options dialog enables you to set options that affect you when you display the result set as text.

Summary
Learning how to create queries can be moderately difficult. Learning to create efficient queries is even more difficult. In this hour you learned how you can use SQL Server Management Studio Express to design and test the queries that you will include in your stored procedures, triggers, functions, and other objects that use T-SQL. You saw how you can use the tools built into Management Studio to display and analyze the estimated execution plan for a query. Finally, you learned how to add indexes so that queries can execute more efficiently, and how to set query options.
Q&A
Q. Name the query analysis tool that shipped with SQL 2000, and compare it to what is available in SQL Server 2005 Express.
A. SQL Server 2000 provided a tool called the Query Analyzer. This tool is now built into SQL Server Management Studio Express.
Q. Explain why you will probably want to analyze the queries that you include in your stored procedures, functions, etc.
A. Using the analysis tools built into SQL Server Management Studio Express, you can analyze your T-SQL statements to ensure that they execute as efficiently as possible. You can modify your queries at will, and observe the effect that those changes have on performance.
Workshop
Quiz
1. Name the tool on the toolbar that enables you to run the query that you type into the query window.
2. Name the tool on the toolbar that enables you to view the execution plan each time that you run a query.
3. Name the tool on the toolbar that enables you to view client statistics when you run your queries.
4. What is the most important thing that you can do to improve query execution?
5. By setting NOCOUNT to off, you are optimizing performance by ensuring the row count is not returned (true/false).
Quiz Answers
2. Include Actual Execution Plan.
5. False. By setting NOCOUNT to on, you are ensuring that the row count is not returned.
Activities
Build a query based on the Sales.SalesOrderDetail table. Display the SalesOrderID, OrderQty, UnitPrice, and LineTotal, ordering the data by LineTotal. Execute the query. Notice the number of rows affected on the Messages page. Indicate that you want to view both the execution plan and the client statistics. Run the query again. View the results in both the Execution Plan tab and the Client Statistics tab. Add an index based on LineTotal. Re-execute the query, noting the differences in the execution plan and client statistics. Finally, go into Query Options and click to set NOCOUNT on. Run your query again and notice that the number of rows affected no longer appears in the Messages pane.