Hour 23. Working with the Debugger
What You’ll Learn in This Hour
![]() Understanding how to communicate with yourself and other developers from an app
Understanding how to communicate with yourself and other developers from an app
![]() Using the log entries for messages
Using the log entries for messages
![]() Enhancing breakpoints with actions, conditions, and iteration control
Enhancing breakpoints with actions, conditions, and iteration control
Logging Information
When you want to communicate with your users, you have a wide variety of tools available to you in the Cocoa and Cocoa Touch frameworks. In this book, the emphasis is primarily on the Objective-C language, so the Cocoa frameworks are outside the scope of this book. What this means is that you have to use the communication tools of the language itself and Foundation on both iOS and OS X, which is a good way of summarizing a few of the communication tools you need to communicate with yourself and your co-developers on a project.
Tip: Communicating with Developers
You can use log messages to explain what you are doing in code so that other people working on the project can follow what is happening. It is generally agreed that code should be commented, but by using the log, a user can run the program in one window and open the log in another. The log messages (even if they are identical to comments in the code) can provide a running commentary.
Leaving aside the user interface features in Cocoa, there are two primary ways of communicating:
![]() Console logs—You can write to the console as you can in most languages.
Console logs—You can write to the console as you can in most languages.
![]() Breakpoints—You can insert breakpoints into your code; when the code stops at a breakpoint, the current variables and their values are displayed.
Breakpoints—You can insert breakpoints into your code; when the code stops at a breakpoint, the current variables and their values are displayed.
Using Console Logs
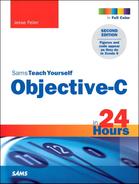
OS X contains an app in the /Applications/Utilities folder called Console. It lets you view the various log files on your Mac. Figure 23.1 shows an excerpt from Console.
Well-behaved apps use the system logging facility to generate log entries in the hard disk root at /Library/Logs/<app name> or in <home>/Library/Logs/<app name> depending on the nature of the log. Console can see all of them. The logs are listed at the left of the window. Each entry is automatically time-stamped. As you can see at the top right of the window, log entries are searchable.
Because your system software is constantly updating various logs, you can launch Console and explore log entries for yourself.
Tip: Using Logs for Troubleshooting
Console is valuable to you for routine troubleshooting. You can track down unusual slowdowns and other strange behaviors with the help of the Console log. Furthermore, note that you can save a log to a file so that you can ship it off to technical support at Apple or elsewhere.
Using NSLog
You use the Foundation function NSLog to generate your log entries. The time stamp and the process ID that you saw at the left of each entry in Figure 23.1 are automatically generated for you by NSLog. Here is the syntax for NSLog:
void NSLog (
NSString *format,
...
);
Note
Note that NSLog takes a variable list of arguments. In fact, it puts them together and calls NSLogv, which has two arguments—an NSString format argument and a variable argument list (va_list), which contains the elements of the variable argument list. You rarely worry about NSLogv.
It is important to note that the format argument (the NSString) is a standard C format string, although it can be augmented with additional information. For example, here is a typical invocation of NSLog:
NSLog (@"Finished conversion routine");
This simply writes a time-stamped log entry with the format string, which, in this case, is simply a string.
You can use the format string to format data as in this example:
NSLog (@"Finished conversion routine with result %d", myResult);
Here, the format string contains an informational string followed by a standard C format string for an integer representation of a decimal number (%d).
Tip: Using the Format String in Log Messages
In the relatively rare case that you are printing out a C string variable, you should format it (probably with %s) in the format string. Otherwise, your string variable will be used as formatting information, which might (but probably won’t) be satisfactory. (NSString variables should normally use %@.) Remember that the format string is enclosed in @" and ".
Enhancing NSLog
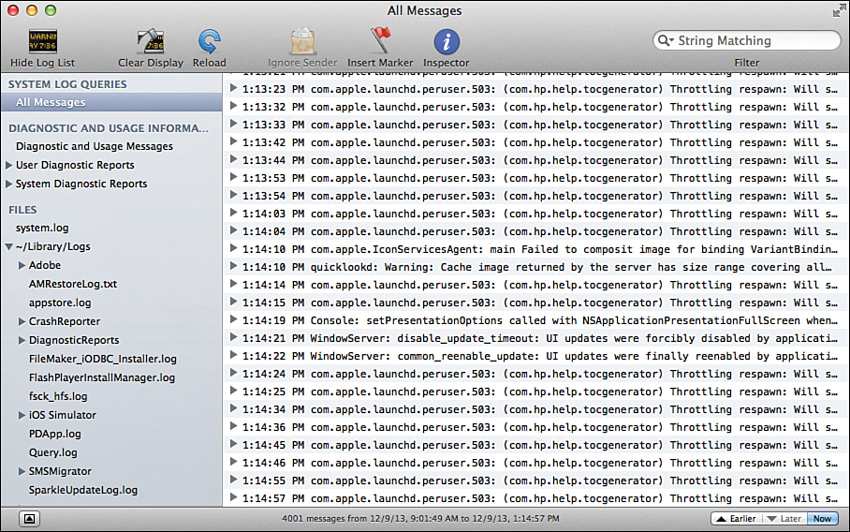
There are some built-in macros and expressions defined in the C preprocessor that are useful for logging. Table 23.1 shows the macros for the C languages (Objective-C, C, and C++).
Note in this table that the macro names begin and end with two underscore characters.
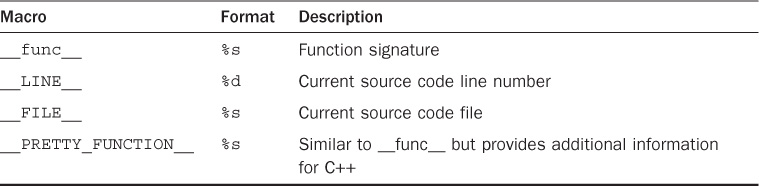
Table 23.2 shows you the Objective-C expressions.
This enables you to create defines such as the following SLOG define, which is based on the Simple Scripting example on developer.apple.com. The define wraps a call to NSLog that uses some of the macros shown in Table 23.1. The only tricky point is that the format string from the invocation of the SLOG define is passed through, and the variables in the define for the filename, line number, and function are also automatically added to the log entry. The ##__VA_ARGS__ is the define for the variable arguments. A define such as this can appear in a precompiled header if you use it throughout your project, but it can also appear in a shared interface file or even an implementation file.
#define SLOG(format,...) NSLog( @"SLOG: File=%s line=%d proc=%s "
format, strrchr("/" __FILE__,'/')+1, __LINE__, __PRETTY_FUNCTION__,
##__VA_ARGS__ )
Here is what a typical invocation of that define looks like:
SLOG (@" returning application's ready property");
And here is the corresponding output:
2014-01-17 09:15:14.608 Test[1159:70b] SLOG: File=AppDelegate.m line=23
proc=-[AppDelegate application:didFinishLaunching]
returning application's ready property
Tip: Logging
One guideline to which many developers subscribe is that you shouldn’t waste a log message. By that, they mean that if you go to the trouble of creating a log message, don’t throw it away. It only takes a few moments to bracket a log message in compiler directives so that you can choose to compile verbose log messages or not based on a single compiler option that you create. Just about as much effort can be expended so that a runtime variable can be turned on and off by users and testers. Not even compiling the log messages obviously improves runtime performance.
Using Smart Breakpoints
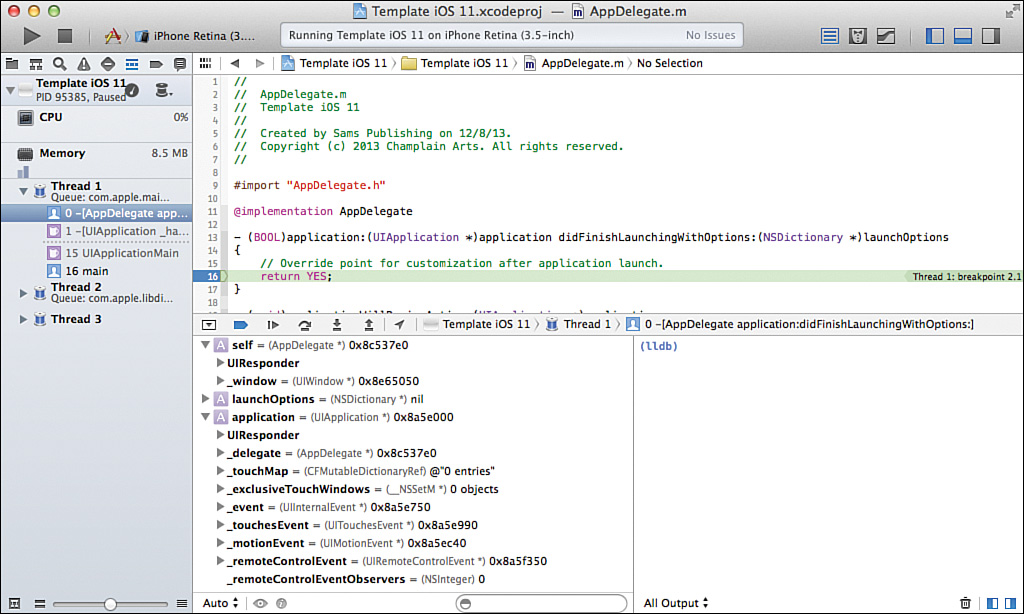
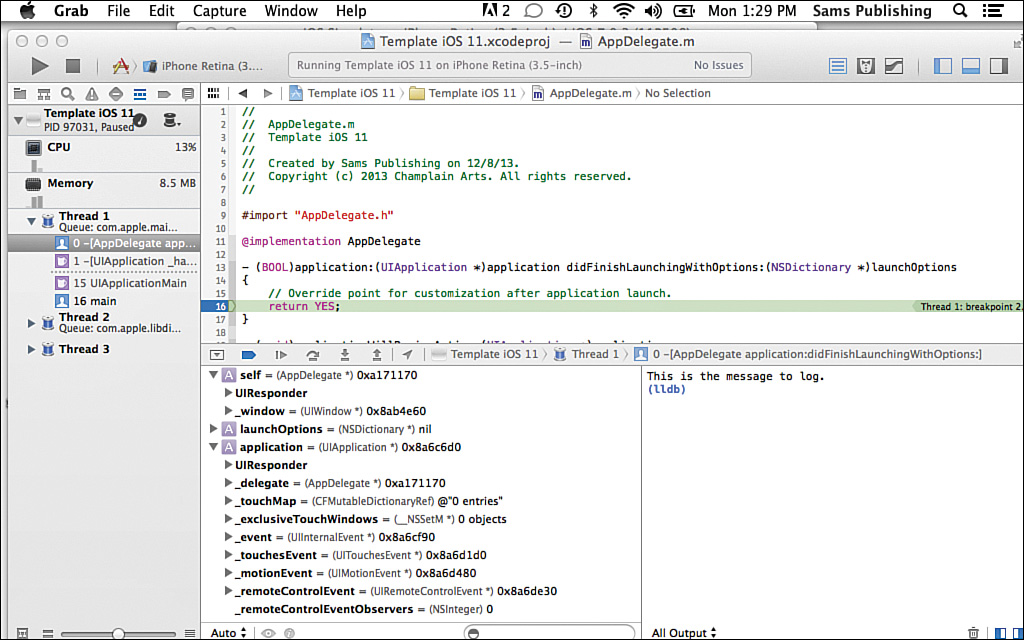
Several times in this book you have seen how to set breakpoints: You click in the gutter of the Xcode editor next to the line on which you want to break. As shown in Figure 23.2, just before that line is executed, the debugger appears and shows you the current values of variables.
Enhancing Breakpoints with Messages
You can edit a breakpoint to provide more information and to control how it behaves.
Try it Yourself: Edit a Breakpoint
1. Set a breakpoint. In this case, set it on the last executable line of the method shown in Figure 23.2 (that is, set it on RETURN YES).
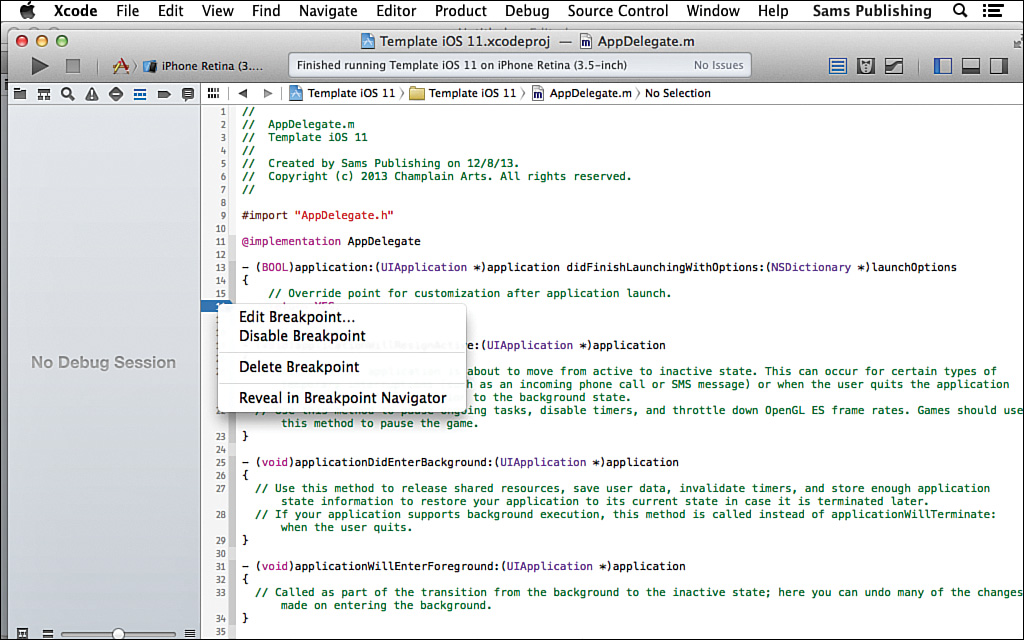
2. Control-click on the breakpoint to open the menu shown in Figure 23.3.
3. Select Edit Breakpoint to see the window shown in Figure 23.4.
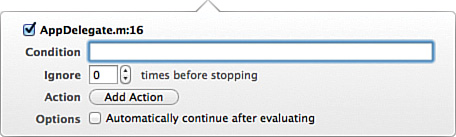
You can set a condition on which to break; if you are inside a loop, you can set a number of iterations to ignore before breaking. You can also check the value of one or more variables and only break if those values are or are not in certain ranges. Basically, if you can express the condition in terms of variables to which you have access at that point in the code, you can use the condition for a breakpoint.
Remember that this expression is evaluated at runtime, however, so make certain you have done any necessary casts for it to function properly.
The actions are a set of types of actions that can be performed automatically when the breakpoint is hit:
![]() AppleScript
AppleScript
![]() Capture OpenGL ES Frame
Capture OpenGL ES Frame
![]() Debugger Command
Debugger Command
![]() Log Message
Log Message
![]() Shell Command
Shell Command
![]() Sound
Sound
You can choose which of these you want to have happen at the breakpoint. Notice the + and – at the top right of the Actions section in Figure 23.5. You can have multiple actions on a single breakpoint.
Finally, you can choose whether or not to automatically continue after the actions are evaluated. If you do not automatically continue, you can use the debugger window to inspect variables. However, you might want to just run one or more actions and review the output at a later time.
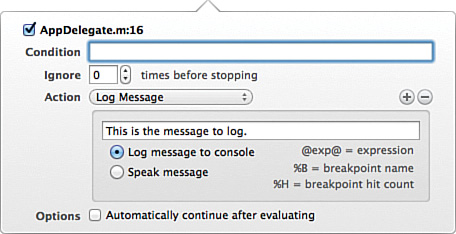
4. If you choose Log Message, you can specify the message to log, as shown in Figure 23.5.
5. Click Done.
6. Click Run at the top left of the toolbar (or choose Product, Run or ![]() +R).
+R).
7. You should see the message, as shown in Figure 23.6. (The message is shown in the console at the right of the debugger area.)
Breaking on a Condition
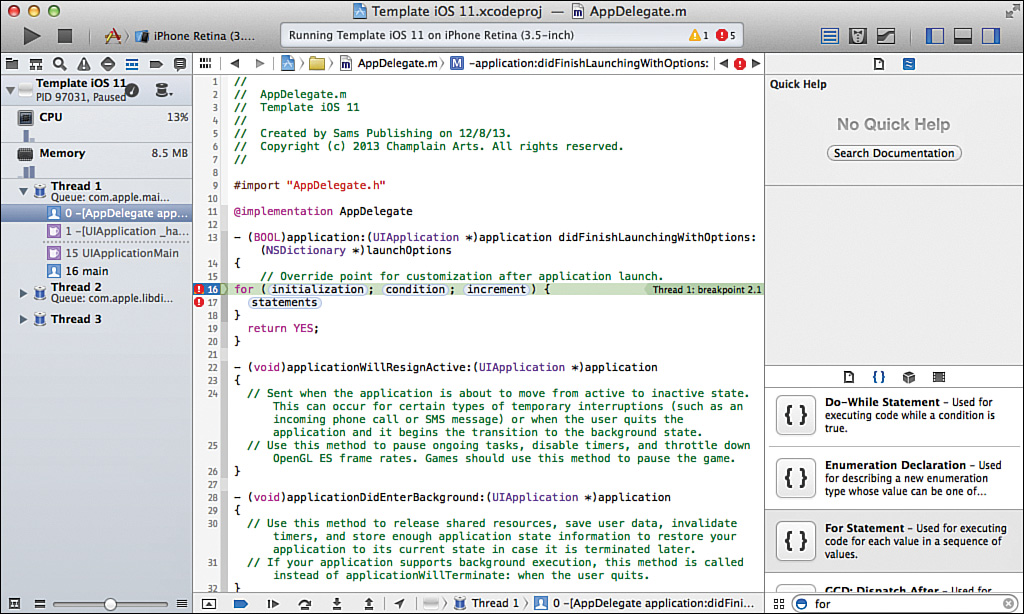
Customizing the breakpoint message is very useful, but there is much more that you can do. The easiest way to demonstrate this is to modify the code so that it is inside a loop that repeats several times. The simplest way to do this is to use the Code Snippet library: Drag the For statement into your code, as shown in Figure 23.7.
Do a bit of rearranging to put the existing code inside the loop and to add a counter variable, as shown in Listing 23.1.
LISTING 23.1 Implementing a For Loop for the Code
– (BOOL)application: (UIApplication *)
applicationDidFinishLaunchingWithOptions:(NSDictionary *)launchOptions
{
// Override point for customization after application launch
for (int counter = 1; counter < 10; counter++) {
NSNumber * myFactor = [NSNumber numberWithFloat:8];
NSNumber * myUnits = [NSNumber numberWithFloat:5];
self.converter = [[Converter alloc] initWithFactor:myFactor];
NSNumber *result = [self.converter units: myUnits];
}
}
Move the breakpoint into the loop (it does not matter where). Make certain that it logs a message as before, but now use the Options check box to have it automatically continue. Make certain to click Done when you are finished.
Run the app again from Xcode, and view the results. Because the app is continuing after the action, the debugger is not shown as messages are written to the console. However, if you show the debugger (or use the Console app in the Utilities folder) later on in the project (just set a breakpoint anywhere), you see all of the action messages.
Change the breakpoint so that the action fires for the condition counter > 5 and run it again. Continue with the various options (and add more with the + and –) to see how you can control the breakpoint’s behavior.
Tip: OS X Debugging Magic
Don’t let the title of Tech Note 2124 mislead you: These are tips for both OS X and iOS debugging commands and options. You can find it at https://developer.apple.com/library/mac/technotes/tn2124/_index.html.
This tech note, as well as the Xcode debugger documentation, show you how to inspect and change variable values while the app is paused in the debugger as well as other very useful techniques.
Summary
In this hour, you have explored some of the debugging tools available in Xcode and Objective-C. You have seen how to use NSLog as well as how to enhance it with defines that provide additional debugging information. You have also seen how to enhance breakpoints so that they perform actions based on conditions as well as on iterations through a loop.
Q&A
Q. What is the purpose of continuing with execution after a breakpoint fires?
A. If the breakpoint contains an action such as a log message or an AppleScript script, it continues running and generates output for you to review later. You do not have to sit there and click your way through each iteration of a debugged loop.
Q. How is a breakpoint condition useful?
A. For pesky bugs that only seem to happen sometimes, you can set a breakpoint on a value so that you find out exactly when that value is set to a peculiar number (such as zero, causing a divide by zero). You do not have to watch to find out when this happens; the breakpoint does the watching for you.
Workshop
Quiz
1. How do you choose what action to use for a breakpoint?
2. How do you specify values to be logged at a breakpoint?
Quiz Answers
1. You do not need to choose because you can use + and – at the top right of the breakpoint-editing window to add as many actions as you want.
2. To explore values at a breakpoint, do not use the check box to continue execution at the breakpoint. You drop into the debugger and can explore on your own.
Activities
Use one of the more complex examples on developer.com or in an Xcode template to explore breakpoints. A good test case is the Master-Detail Application in Xcode templates for iOS. Set a breakpoint at the end of insertNewObject: in MasterViewController.m and explore what happens each time you add another object with the + in the master view controller.