Hour 24. Using Xcode Debug Gauges for Analysis
What You’ll Learn in This Hour
![]() Exploring debug gauges
Exploring debug gauges
![]() Using instruments
Using instruments
Putting Debug Gauges in Perspective
Broadly speaking, there are four steps to developing and implementing an app whether it is for an iOS device, a Mac, or any other computer, including a Windows computer, an old-fashioned mainframe, or even more obscure devices:
![]() Define and design—Decide what your app is supposed to do.
Define and design—Decide what your app is supposed to do.
![]() Compile—If you cannot pass this hurdle, no one can run your app.
Compile—If you cannot pass this hurdle, no one can run your app.
![]() Work as expected—This means that calculations are correct and that the app delivers on the design promise.
Work as expected—This means that calculations are correct and that the app delivers on the design promise.
![]() Work properly in the computing environment—This section explores this point.
Work properly in the computing environment—This section explores this point.
In any development process, some people stop after any of these steps. Being unable to agree on the definition and design of a project is common, and, in many ways, it is positive. It is much less expensive to cancel a project if you decide at the start that it will not work than it is to cancel the project after it has flopped.
Some developers think their work is done when they get a clean compile and build, but most know that the app still needs extensive testing to make certain that it works as expected. Many think that is the end of the road.
The last step—working properly in the computing environment—is critical. Almost every app today runs in a shared environment, and it has to work well with the other components in that environment. Perhaps nowhere is this so critical as when your app runs in a shared environment that includes telephony and battery power.
In fact, except for some very specialized apps that work in single-purpose environments (guiding a spacecraft far from earth or managing a complex industrial machine, for example), almost every app today runs with at least one other app—the operating system. In modern computing environments such as iOS or OS X, it is easy to have more than a hundred separate processes running simultaneously. The operating system itself might account for many of these, while end-user apps such as Numbers, Xcode, or Safari can account for others.
When an app runs in a shared environment like this, its behavior has to mesh with the behavior of the other processes. That means releasing exclusive holds or locks on resources such as memory quickly as well as allowing the operating system’s management tools to function efficiently by not hogging the processor(s) in ways that prevent them from being shared from time to time.
When an app fails at the third level (working as expected), you might be lucky to discover that a specific user action (choosing a menu command, for example) causes it to crash. You might not like this, but it is a deterministic problem that can eventually be tracked down and corrected.
If an app does not work properly in the shared computing environment, the problem is often hard to track down because if it does cause a crash (and, from a debugging point of view, that is a great help), that crash might come almost randomly at some point depending on what is happening elsewhere on the computer at that time.
A good example of this is memory leaks. In pre-Automatic Reference Counting (ARC) days, forgetting to call release or dealloc allowed you to litter the heap with now-unused and even unusable objects. Gradually, the amount of free memory dwindled. Modern operating systems do not function properly under extremely limited memory or disk conditions. Some users of modern Macs believe that having less than 1GB of free space on their startup disks renders the system practically unusable. Others peg that number at 10GB. Regardless of the number, if the free space on disk is too small, a ripple of bad consequences starts to play out.
As discussed in Hour 23, “Working with the Debugger,” you have tools available to let you inspect what is happening at critical points in the app. Although that helps you make certain that the app is functioning correctly, the debugger is of limited help in helping you monitor how it is behaving in its computing environment.
This is where debug gauges come in.
Monitoring CPU Utilization
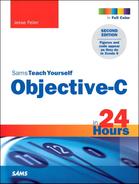
Xcode now presents graphic gauges that monitor resources as your app runs. They are located in the Xcode debug navigator, as shown in Figure 24.1. Gauges show resource utilizations, while at the lower section of the window a timeline moves along showing the trends. In some gauges such as iCloud, more specialized information such as iCloud interactions is shown.
In Figure 24.1, you see the CPU gauge. In general, what you’re looking for here are the values shown in the utilization graphics at the top of the screen, but you’re also looking at how those values change over time on the running timeline.
As you run your app (either in the simulator or on your Mac or device), you should see utilization spike when you perform some action, such as open a new document or select a new item in a Master-Detail Application app. You’re watching to see that the spike comes down when the operation is finished. Remember that you’re looking only at your app, so it’s not unreasonable to expect its usage to come down to 0% even if you’re running plenty of other apps on your device.
Monitoring Memory Utilization
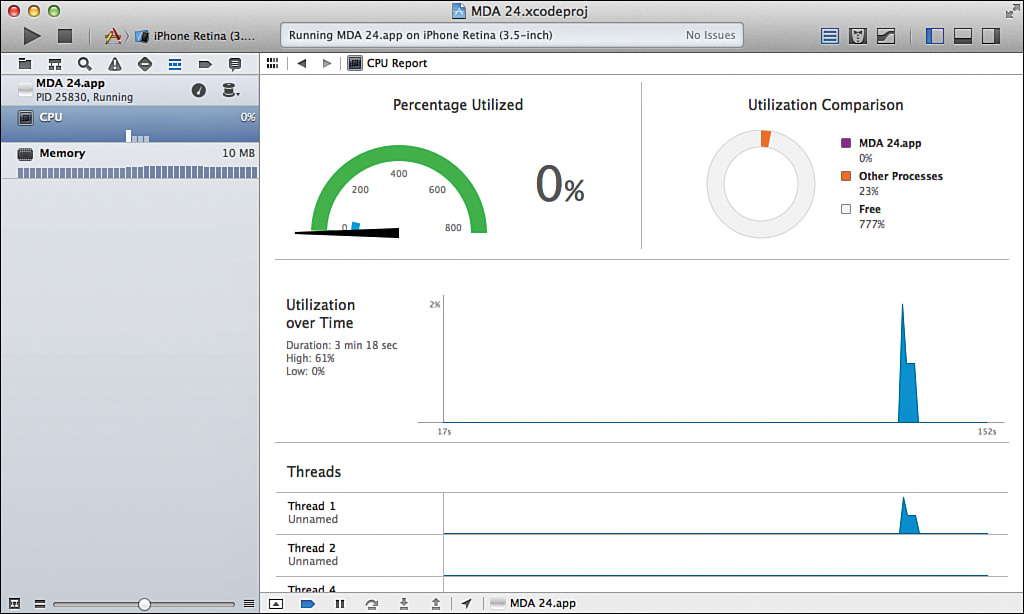
Compare the spikes in Figure 24.1 to the graphic in Figure 24.2 that shows memory utilization. Note at the beginning of the timeline (all the way at the left) that the memory usage jumps up quickly. It remains at a high level in Figure 24.2.
Thus, you expect a spike in CPU utilization when you open or close a document with a quick up-and-down motion. When it comes to memory, you expect a longer-term increase because while the document is open, the memory remains in use.
On top of this, if you close a document, you expect a CPU spike for the close operation and a fairly rapid drop in memory use as the document objects are released. Every app is different, but in general as you close or dismiss items, you should see a decrease in memory.
Note
This is not an absolute rule because sometimes you deliberately leave objects around so that they can be brought back onscreen quickly. To properly debug your app, you have to understand what it does so that you have a good feeling for when memory and CPU usage should go up, stay up, and go down.
Monitoring Energy
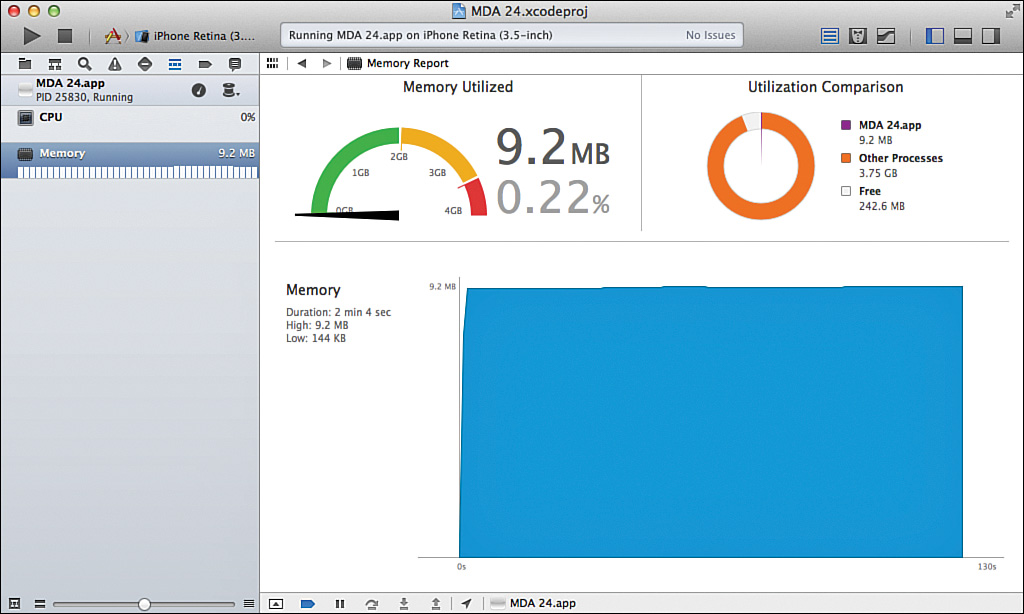
On a Mac, you see the Energy Impact gauge, as shown in parts (a) and (b) of Figure 24.3.
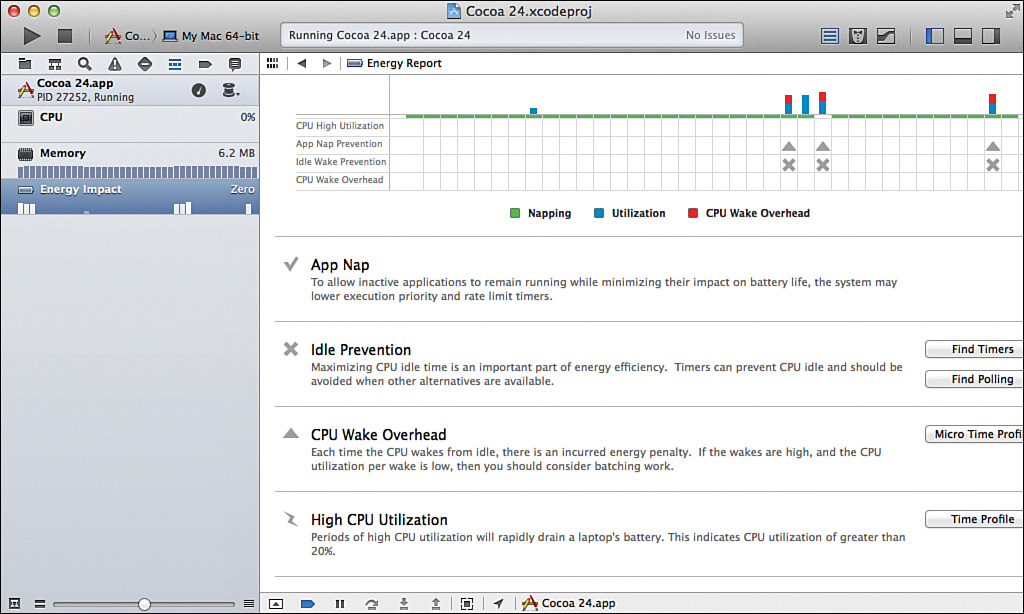
The Energy Impact timeline is particularly useful because it not only shows you the Utilization, Napping, and CPU Wake Overhead, but it also indicates periods when energy is impacted by App Nap Prevention, Idle Wake Prevention, and other events (those are the Xs below the timeline). The Energy Impact timeline is useful if you are exercising your app and noticing how it behaves in response to your actions. It’s also useful when you think nothing is happening and notice that you’re running down the battery (timers are often a culprit here). Unlike CPU and memory where you should have a basic idea of what will go up and down, it’s these occasional incidents where utilization and overhead occur that can impact your app’s energy use.
Using Instruments
Instruments is an app that runs alongside everything else on your computer. It is a collection of tools in which each monitors a particular type of activity, from memory leaks to network access and garbage collection. Instruments feeds the debug gauges, so if you want to drill down deeper, you can switch to Instruments for more information. (You can also write your own instruments.)
With Instruments, you can observe what is happening inside your app in graphical and numerical displays. By looking for aberrations, you can start to track down these problems that can cause your app not to work well in the shared computing environment. What you are looking for varies from app to app. For example, there might be no concern with network access in a computation-intensive app that works solely from user-entered data.
This hour gives you an overview of the basic Instruments functionality. The Instruments User Guide, downloadable from developer.apple.com, provides more than a hundred pages of details.
There are certainly some apps where you need to use all of the Instruments capabilities, but fortunately, for many apps, you can focus your attention on specific areas that you know in advance are likely to be troublesome. These include specific areas that are relevant to your app’s processing as well as some general concerns (such as memory leaks) that apply to most apps.
Note: Memory Leaks and Battery Usage
Some people believe that memory leaks and battery usage concerns are specific to iOS devices, and that they do not apply to plugged-in computers sitting on a desktop. Others (including the author) think that this assumption is wrong. They matter everywhere. The fact that they are often hidden by plugged-in power sources and vast amounts of built-in memory is, in the long term, generally misleading. At some point, they will matter.
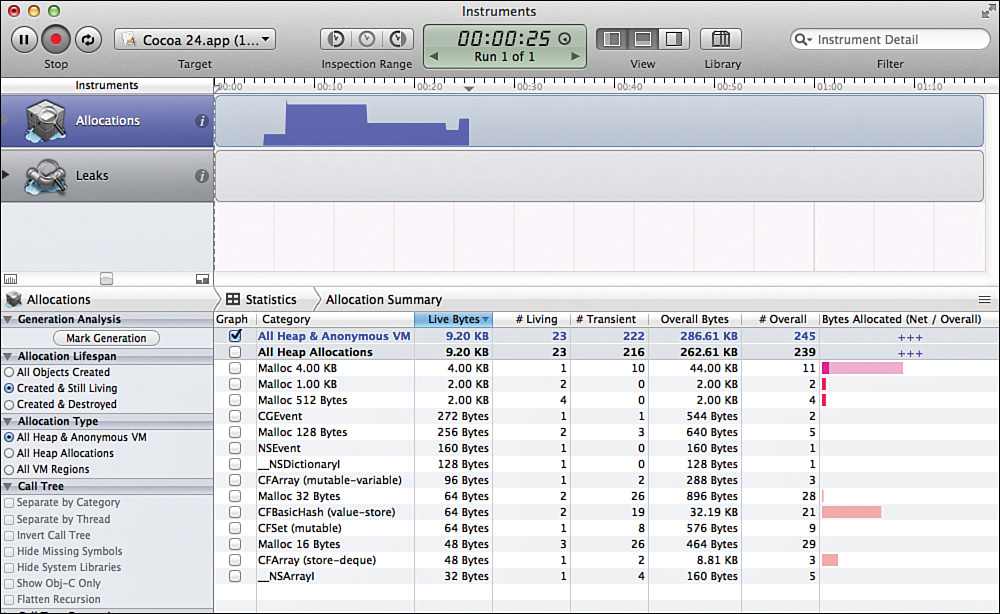
Instruments is shown in Figure 24.4. You can switch to Instruments using the button at the top right of debug gauge displays. Instruments provides you with a great deal of data, but for many people, debug gauges provide a solid and easy-to-understand picture of your app.
Summary
This hour showed you an overview of how to work with debug gauges and Instruments to monitor your app’s performance in the computer environment as it runs. This type of analysis is typically done after you have designed, compiled, and tested your app. However, there are cases early in the development process where you might hit a bump in the road and use Instruments to try to track down what is happening. Most of the time, though, in the development process you rely on the debugger; Instruments and debug gauges come into play later on.
Q&A
Q. Why should you always assume your app is running in a shared environment?
A. With very few exceptions, it is. It must coexist (appropriately) with the operating system and other apps.
Q. What apps can you connect to with Instruments?
A. You can target any apps running on your Mac, on the iOS simulator on your Mac, or on an iOS device set up in Xcode. You can watch the behavior of complex apps such as Xcode and Safari to begin to understand the data that Instruments presents to you.
Workshop
Quiz
1. Do you have to worry about memory leaks if you use ARC?
2. What is the best set of instruments to use when you start using the Instruments app?
Quiz Answers
1. Although it is much more difficult than in the past, you can still create memory leaks if you use ARC.
2. When you are starting out, you might like Activity Monitor template but you should also focus on particular areas of concern to your app.
Activities
Go back to the code that you have written in the earlier hours of this book and explore it with Instruments. Do you find memory leaks or other problems? Cleaning up your practice code can get you positioned well for moving on to more complex projects. (It also can help you form good habits for writing new code.)