
MISSION 18
Temperature Monitor
A lot of energy is created, spent, and wasted on heating our homes. Don’t get me wrong, we need heat, and I love a nice cosy house. Sometimes, though, my house is too hot, and I’m wasting energy. Let’s set up a temperature sensor to get an idea of what temperature your house actually is.
Instead of displaying the current temperature, let’s record the temperature every hour and store it in an array. Then we can do some science with it!
ARRAY
An array is like a list. You can store numbers in an array and pull them out later. So instead of having variables temperature1, temperature2, and temperature3, we have an array called temperatures that stores all those numbers inside it. The great thing about an array in MakeCode, as opposed to other programming languages, is that you don’t have to set the size when you start, and if you do, the array can grow in size later on in your code.
Algorithm
The number of hours you want to record for is X.

micro:bit
Build
Place the micro:bit somewhere inside your house, away from a radiator or open windows. Try not to hold the micro:bit in your hand either.
Code

Figure 18.1 The micro:bit says it’s too hot!
1. Let’s have a look at Arrays in MakeCode. They’re under Advanced at the very bottom of the menu.
2. Drag out the block set list to array of 1 2, and place it under on start.

Figure 18.2 From the Array menu.
3. Press the minus sign (–) twice to get an empty array.
4. Let’s give our array a better name. Click on list, and select Rename variable.
5. Type in “Temperatures,” and click OK.
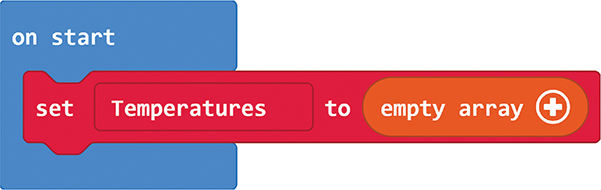
Figure 18.3 Set up an empty temperature array.
6. Now we have an empty array that we can fill up with numbers.
7. From Array, drag out the block list add value to end, and place it under on start.
8. Change list to Temperatures.
9. From the Input menu, drag out temperature (C), and place it in the blank spot after value.
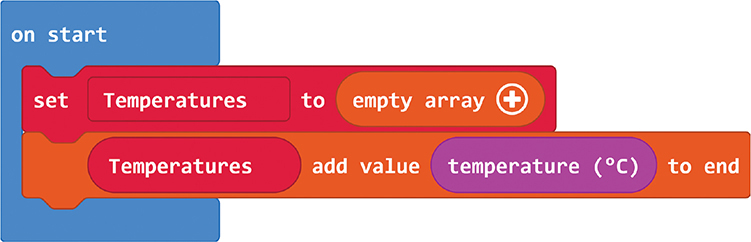
Figure 18.4 Add temperature to the array.
10. We’re going to repeat this five times with an hour pause in between each recording. Put a repeat block around these blocks.
1,000 ms = 1 second
60,000 ms = 1 minute
3,600,000 ms = 1 hour
11. After the array is finished, we’ll insert a tick so that I know when it’s done. That’s recording the temperature for 5 hours in the array. When it’s done, we want to get the data out.

Figure 18.5 Record every hour.
12. Under Loops, there is a loop to go through an array for element value of list.
a. Value is the number we’ve stored inside the array.
b. List is the name of the array.
13. Put this block under on button A pressed.
14. Change list to Temperatures.
15. Add show number with the variable value inside this loop.

Figure 18.6 Looping through the array.
Once the micro:bit starts, it will record temperatures and store them. When you press A, you’ll be able to read the temperatures recorded so far.
Debug
There are a couple of issues here. The temperature is in degrees Celsius. If you want degrees Fahrenheit, you’re going to have to use some blocks from the Math menu. The math is (Temperature in Celsius × 9/5) + 32.
To test your code, instead of standing outside in the cold for an hour, you can:
![]() Change your pause to just 5 seconds.
Change your pause to just 5 seconds.
![]() Hold the micro:bit tightly in your hand to increase the temperature.
Hold the micro:bit tightly in your hand to increase the temperature.
Even when you have the temperature in the right scale, do you find that your temperature readings are far too high? You don’t have a fever; the micro:bit’s temperature readings are a bit higher than the actual room temperature. This is because it’s recording the temperature of the micro:bit, and the micro:bit is an electrical device that produces heat.
You need to find the offset—the difference between the micro:bit temperature and the actual room temperature. You will need a real thermometer for this task.
1. Place the micro:bit and a real thermometer in the same location.
2. Get the micro:bit temperature.
3. Get the temperature that the thermometer shows.
4. Do the same every hour for a few hours.
5. Create a grid, and enter your numbers. Here’s mine:
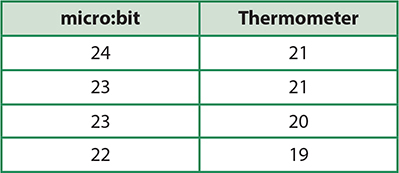
6. Add a third column, and work out the difference between the micro:bit’s temperature readings and those of the thermometer.

On average, my difference was 3 degrees. Your code now needs to take this offset into account. Let’s record the temperatures correctly. I added a math block when I added the temperature to the array.

Figure 18.7 Record the right temperatures.
Expert Level
In Mission 19, you can create an alert if your temperature is too hot. And Mission 20 uses both a sensor on a window and this sensor.
I really like the grid of temperatures that we recorded earlier. Why not record your temperatures over 24 hours, fill out a grid, reset the micro:bit, and do it again? What does a week’s worth of temperature data in your house look like? Can you create a line graph? Is your grandparents’ house hotter than that of your parents? What about your school? Which room in your house is the warmest? There are lots of experiments you can run with this sensor. Try them out!
Circuit Playground Express
Build
Place the Circuit Playground Express in your house away from any heat sources such as a radiator or the dog.
Code
Let’s have a look at arrays in MakeCode. They’re under Advanced at the very bottom of the menu.
1. Drag out the block set list to array of 1 2, and place it under on start.
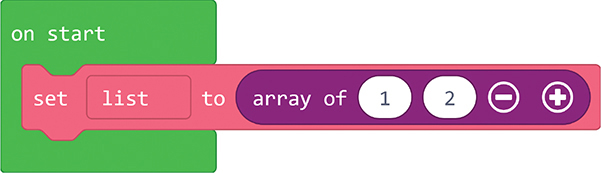
Figure 18.8 From the Array menu.
2. Press the minus sign (–) twice to get an empty array.
3. Let’s give our array a better name. Click on list, and select Rename variable.
4. Type in “Temperatures,” and click OK.

Figure 18.9 Set up an empty temperature array.
5. Now we have an empty array that we can fill up with numbers.
6. From Array, drag out the block list add value to end, and place it under on start.
7. Change list to Temperatures.
8. From the Input menu, drag out temperature in C, and place it in the blank spot after value.

Figure 18.10 Add temperature to the array.
9. I’m going to repeat this four times with an hour pause in between each recording.
10. After the array is finished, I’ll set all the lights to green so that I know when it’s done. That’s recording the temperature for four hours into the array. When it’s done, we want to get the data out.
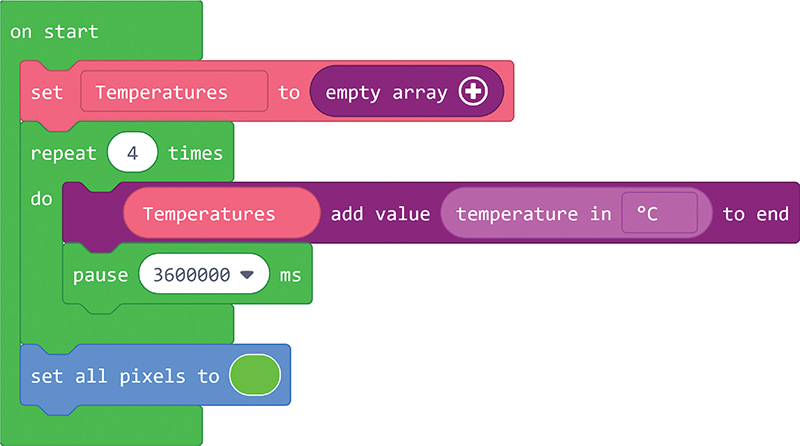
Figure 18.11 Record every hour.
11. Under Loops, there is a loop to go through an array: for element value of list.
a. Value is the number we’ve stored inside the array.
b. List is the name of the array.
12. Put this block under on button A pressed.
13. Change list to Temperatures.
We’re going to display the temperatures on the ring of lights around the Circuit Playground Express using the graph 0 block found under Light menu.
The temperature in my house is between 15 and 25 degrees Celsius. To graph this on the Circuit Playground Express, I need to graph temperature - 15 out of 10. This would give a light to every temperature between 16 and 25. Thus 16 degrees would be one light, 17 degrees would be two lights, and so on. I’ve put a pause in here so that we see the graph before it’s overwritten with a different color.

Figure 18.12 Looping through the array.
In the north of England, where I live, 25 degrees Celsius is about as hot as it gets! If your house is hotter or even cooler, change these numbers.
Debug
To test this code, I changed the pause between temperatures to be just 10 seconds. Then to heat up the Circuit Playground Express, I held it tightly in my hand. I saw the temperature change quickly using this technique.
Without holding the Circuit Playground Express in your hand, do you find that your temperature readings are far too high? You don’t have a fever. The Circuit Playground Express temperature readings are a bit higher than the actual room temperature. This is because it’s recording the temperature of the board, and the board is an electrical device that produces heat.
You need to find the offset—the difference between the Circuit Playground Express temperature and the real room temperature. You will need a real thermometer for this experiment.
1. Place the Circuit Playground Express and a real thermometer in the same location.
2. Get the Circuit Playground Express temperature.
3. Get the temperature that the thermometer shows.
4. Do the same in an hour’s time for a few hours.
5. Create a grid, and enter your numbers. Here’s mine:

6. Add a third column, and work out the difference between the Circuit Playground Express temperature readings and those of the thermometer.
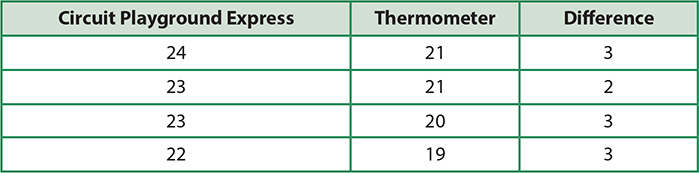
On average, my difference was 3 degrees. Your code now needs to take this offset into account. Let’s record the temperatures correctly. I added a minus block from the Math menu when I added the temperature to the array.

Figure 18.13 Record the right temperature.
Expert Level
Go to Mission 19 to create an alert if your temperature is too hot. Mission 20 uses a window sensor and this sensor together.
The grid of temperatures we created earlier is really interesting. I found out that my house starts getting warmer at 5 a.m., and yet I don’t wake up until 7 a.m. Record your house temperatures over 24 hours, and fill in your own grid. Then do it again for the week. Find out the patterns of your house. Try recording different houses, such as the house of one of your friends or your grandparents, and compare the temperatures. Or just compare different rooms in your house. Is the kitchen the warmest room in the house? There are lots of experiments you can run with this sensor. Try them out!

Figure 18.14 So cold!
Raspberry Pi
Build
Your Raspberry Pi doesn’t have a temperature sensor, but it does have access to the internet. We’re going to find out the outside temperature to help us get our inside temperature right.
Code
We’re still going to follow most of our original algorithm. Get the temperature every hour, and store it in an array.
Get Your Longitude and Latitude
To find the temperature outside your house, you need to know the longitude and latitude of your area. I find the best way to do this is to use Google Maps.
1. Go to http://maps.google.com.
2. Search for your home address, and then zoom in on your house.
3. Right-click on your house on the map.
4. Select “What’s here?”
5. A little box pops up at the bottom of the screen with the longitude and latitude numbers.
6. Write these down.
Here’s where I don’t live! Buckingham Palace’s longitude and latitude: 51.501401, –0.141895.

Figure 18.15 Buckingham Palace.
Set Up Your API
We’ve got our coordinates. Now we need to get the temperature. We’re going to use an API.
API
API stands for “application programming interface.” APIs are used when two pieces of code want to “talk” to each other. In this case, your temperature code wants to talk to a piece of code on the Dark Sky computers.
You will need an adult to sign up for an account with Dark Sky. You can get data from this API 1,000 times a day for free. You cannot go over 1,000 with a free account. Your adult will not be billed for it, so he or she does not have to enter any billing information. Here are the instructions:
1. Go to https://darksky.net/dev.
2. Select Sign up, and enter your email address and a password.
3. You will need to check your email for a link to confirm your account.
4. Once your account is confirmed, log in with your email address and password.
5. When you are logged in, it will show you your secret key.
6. Copy your secret key from the website.
7. On the same page, there’s a link like this: https://api.darksky.net/forecast/YOURSECRETKEY/37.8267,-122.4233.
8. When you click it, it gives you all the weather data for Los Angeles.
9. Change the last part of the address to your longitude and latitude. For example, Buckingham Palace would be https://api.darksky.net/forecast/YOURSECRETKEY/51.501401,-0.141895.
There’s a lot of information on this web page! Can you find the emperature? It’s on the second line.

Figure 18.16 Found it!
There are other temperature readings on this page, but this is the current temperature in degrees Fahrenheit. If you want Celsius, you need to add an extra bit to the end of the URL: ?units=si.
Code the Raspberry Pi
We’re going to code some Python to grab this number from the web for our mission.
Here’s the code; for now, it’s just printing out the current temperature. A lot of the code is getting all that text from the web page and pulling out that one number into a variable currentTemp.

Figure 18.17 Code.
1. To get the code working, change the following variables to your data:
a. apikey
b. lati
c. longi
2. Run the code to see if it returns the temperature that we saw on the website.
TRY AND EXCEPT
Did you notice the try and except code? This helps our code run even when there is an error. The error could be that we have no internet connection. This code tries to run the internet code, but if it can’t, it prints out the error and continues in the code. It doesn’t crash. It’s a neat way of catching errors without crashing your whole program.
3. Now that we have the number, let’s store it in a list. At first, let’s do this every 5 seconds, and let’s print the list to make sure that it’s all working. Here’s what I did:
a. Added the time library at the top of the code
b. Created an empty list called temperatures
c. Created a for loop and appended the currentTemp variable to the temperatures list (I added 0 if the internet connection was down that hour.)
d. Paused for 5 seconds
e. Printed the list
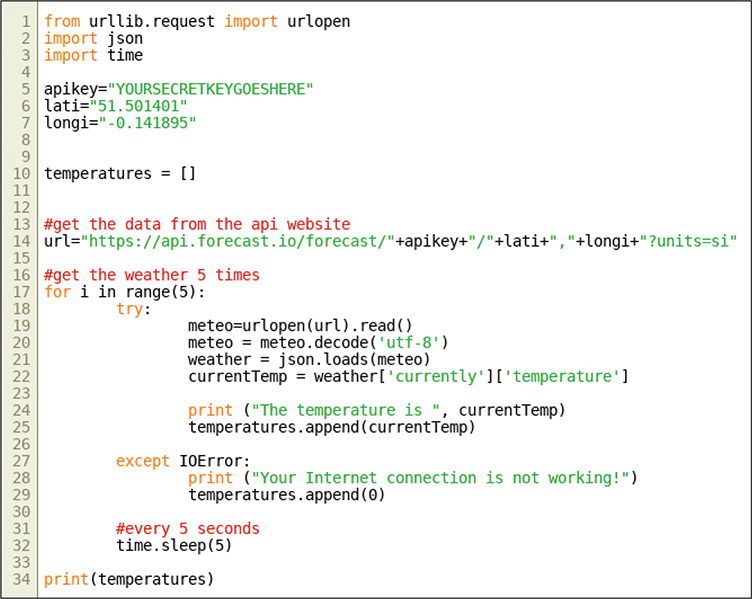
Figure 18.18 Code.
4. Run the code to see what happens. After 25 seconds, you should have a list full of temperatures.
5. Here’s a nicer way of printing lists.
6. The temperature is printed as we record it, and then, when all the temperatures are recorded, the entire list is printed again.

Figure 18.19 Code.

Figure 18.20 Temperature readouts.
7. If you’re happy with the code, change:
a. The range to however long you want to record the temperature for
b. The amount of time between each recording
8. For example, to record every hour for 24 hours, change:
a. 5 to 24 in for in range(5)
b. 5 to 3,600 in time.sleep(5)
Debug
I made lots of mistakes with the URL:
https://api.darksky.net/forecast/YOURSECRETKEY/51.501401,-0.141895
I left out the full stop (the period) and the comma. Without them, it just doesn’t look like a URL that will work!
Expert Level
Have a look at the other data on the API page. What else could you pull out? For example, precipProbability is how likely it is going to rain. If this is over a certain number, you could set off an alarm that it’s about to rain. In the code, instead of currentTemp = weather[‘currently’][‘temperature’], you could get other data such as weather[‘currently’][‘precipProbability’] or weather[‘currently’][‘windGust’] and even a summary: weather[‘currently’][‘summary’]. The website https://darksky.net/dev/docs#forecast-request gives you more information on the data.