
When scaling your platform or adapting it to allow scaling, you will usually run into problems or challenges you didn’t have with your older version. This should not stop you from trying, as these challenges are inherent from the added complexity of your new design.
They’re sometimes related to secondary subsystems, the ones that aren’t strictly working toward getting the business rules to work, but instead address issues such as where you store your log files. And sometimes the challenges actually affect more important aspects of your application, such as the data you keep in-memory and how to translate that into a multi-node scenario.
In this chapter, I’ll cover the major hurdles you might find during your scaling endeavors and how you can overcome them.
Dealing with Your Log Files
Paying attention to your logging strategy from the beginning of your project is often a good idea; otherwise, you may run into problems. This might sound like an empty warning, but take a step back from your code, and think about how you’re logging right now and what you’re doing with that information.
If you don’t really have a use for it, then you might as well stop logging, but if you’re actually getting insights from the data, either when troubleshooting, or through some sort of analytics tools, then make sure you can keep doing so after you’ve scaled up (or down) your architecture. Can you trust that you will be able to process your logging data if you’re under an elastic scaling architecture?
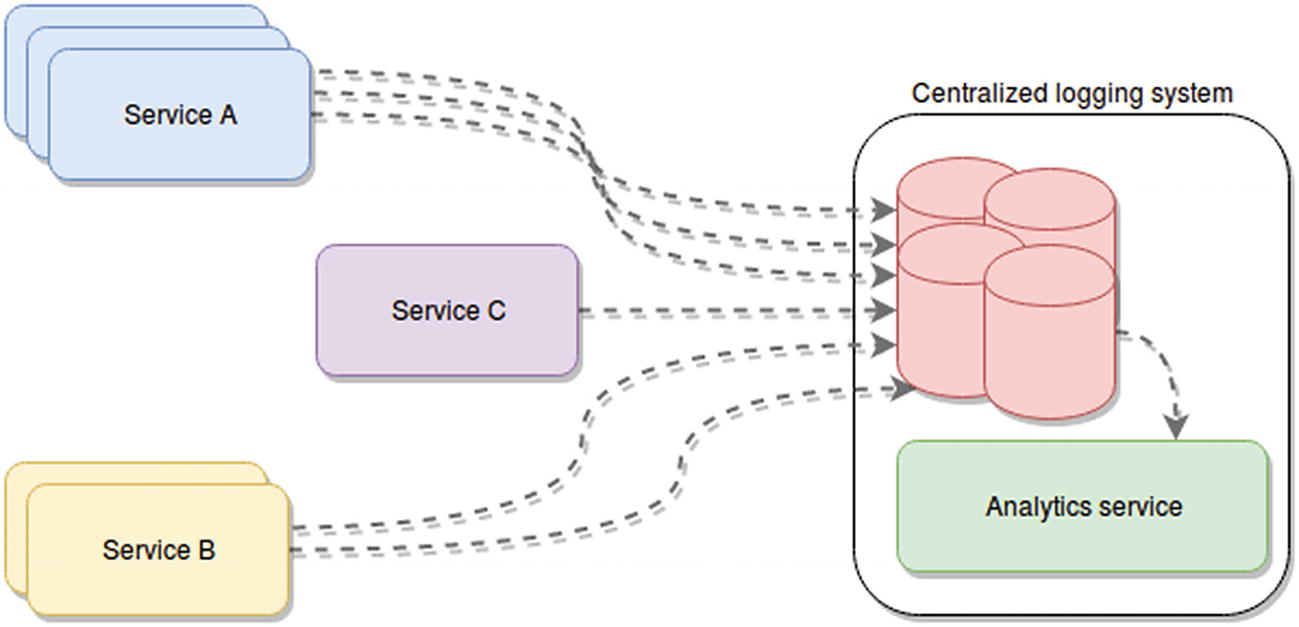
Example of a centralized logging architecture, where multiple instances of different services are sending their logging information into a single system
The way these services send their data to their destination will vary depending on the nature of that system, but usually standard ways will be provided (the most common ones are either RESTful APIs or agents you can install on your servers and configure to send the data to a remote location by themselves).
There are two very common mistakes developers make when logging in new systems that aren’t necessarily hard to fix, but require attention when scaling. The first mistake is logging only into stdout and stderr; the second is logging into a single file. These issues will need to be addressed if we want to get anywhere near the ideal scenario of Figure 4-1.
You’re Just Logging into stdout and stderr
And what makes it even worse is that you’re not wrapping the output function/method of your language of choice into a construct under your control. In other words, and in the Node.js universe, you’re logging using console.log and console.error.
This is great for small projects and quick PoC (Proof of Concept) , but if you’re interested in getting anything out of your logs, then you need to do something about it. In particular, because both the stdout and stderr are local to each server instance, if you start scaling your application into multiple servers, you’ll have to deal with distributed logs that aren’t being saved anywhere (or maybe they are, depending on your setup).
This will work, even if you’re not saving the data anywhere, since PM2 will catch all your output and save it automatically, just in case. But that will only get you halfway, since we also need to send those log files into a centralized location.
Because there are so many options, and so many variations of similar solutions, I’m just going to cover a simple one, assuming you have an ELK4 (Elastic, Logstash, and Kibana) cluster configured and ready to receive logs somewhere on your architecture. This will act as the centralized logging and analytics system from Figure 4-1.
What you want to do in this situation is configure something that will ship the log files stored by PM2, into Logstash, which in turn will apply any transformation you might need to the data and then send it and index it into Elastic for your consumption using Kibana.
This might sound like a lot at first glance, especially if this is your first time dealing with something like this, but it is a scalable way of going about it. If you do it right, you gain the ability to support failures and downtimes on your Elastic cluster, you get back-pressure, on your ogging pipeline, making sure you’re not overwhelming your analytics platform, and so on.
To achieve this, you’ll install and configure Filebeat in all your servers (all those that need to send data out). Filebeat is essentially a log shipper that follows a standard protocol called Beat. This shipper (and its associated protocol) is the result of several years of iteration by the team of Elastic to get the best and most lightweight log shipper possible.
Configuration content to make filebeat send the logged data into logstash
That configuration will pull the contents of the log files for your app (stored in a default location by PM2) and into a Logstash server. You need to replace the constants YOURHOMEFOLDER and LOGSTASH-HOST by the actual values to make it work.
Execution of filebeat
Tip
I recommend making sure that line runs every time your server starts; otherwise, you’ll stop sending data after the first server reboot.
With that, you’re ready to retrieve your log files (if you’re crazy enough to log using only console.log). But you still need to configure Logstash to make sure you can parse these logs, transform them (if needed) and then index them into Elastic. So stop smiling, and keep reading.
Configuration file (any file with a .conf extension) for Logstash
Note that the configuration from Listing 4-3 will only receive and index data; it will not transform (which is one of the key benefits of Logstash) anything. So if you wanted to do some extra tweaking of your logs before indexing them, I recommend looking at the full documentation for Logstash.6 Also, make sure to match the port under the configuration for the Beat plugin with the port specified on the Filebeat config file (Listing 4-1).
You’re now set. Congratulations, you’ve managed to avoid a major problem by using the right set of tools.
Note
Even if you have some form of workaround in place to centralize your logs, using console.log and console.error for logging purposes is far from ideal. Creating a simple wrapper around these methods (at the very least) will grant you more control over the log formats, extra information you might want to add, and so on.
If, on the other hand, you weren’t using anything like PM2 that would catch the output of your process and save it into a file, you’re out of luck. You’ve lost your logs to the black hole that lives inside every server and there is no way for you to retrieve them. So don’t do it like this.
You’re Logging into a Single File
File size: How much space can you allocate to your logs? Are you sure you’re not depleting your hard disk, causing your application to possibly fail due to lack of space?
History: How much history do you want to keep in your file? This will depend on your application logging needs. If you need to keep a lot of debugging information in your files, then a lot of history is not recommended, since you’d end-up with huge files. On the other hand, if you’re not logging a lot of events, you might as well keep as much as you can (always taking into account the previous point).
You could potentially take care of both from inside your own code, by adding extra logic to your logger and make sure you properly keep the size and history of your logs in check. You can also use an external tool, such as the classic logrotate7 command line utility, which is already part of most (if not all) Linux distributions.
Configuration file required to rotate sample log file
Executing logrotate
This is definitely the preferred way of handling this logic instead of writing it directly into your own logger’s code. But you’re not there yet. You now have your own log file, and you’re properly making sure it doesn’t grow out of hand, but you still need to send its content into a centralized location. You can look at the previous point in order to understand how to configure Filebeat and Logstash.
With that last bit of configuration, you’re ready to move on with your development, because you again have a stable logging system within your platform.
Throw Away Your Logger and Use a Real One
There is yet another way of solving this problem. Instead of using an external tool to solve it, use the right logging module in your system. This solution applies to any type of system, and in most cases I recommend it over building your own custom tool.
The one logging module I always recommend and tend to use, thanks to the flexibility it provides, is Winston.8 Currently on version 3.0.0, it provides the developer with all the tools needed to create a scalable and professional logger that will allow you to reach your end-goal with a minimum of effort.
It is not unique in many of its features, but it’s definitely one of the most common ones, which makes it the usual target for others to contribute to. This in turn, helps because thanks to that fact, it has over 20 different “transports” already developed. They will help you integrate your logger with external systems out of the box.
Basic winston-based custom logger
In this example, you can see that we have two different transports (although they’re both files, they’re different ones), one for error events and the other for everything (including errors). Then, for production-only environments, it will also log into stdout (the console).
Modified logger ready to index data into Elastic
With a few added lines and a new transport, you’re now ready to index your logs into Elastic, which in turn, will be consumed by Kibana for your log analytics.
Tip
Note how this approach actually avoids using Logstash altogether and indexes data directly into Elastic. But there are also several benefits of going through Logstash, and for that, you can use the winston-logstash9 module.
Sharing Memory between Processes
Let’s forget about log files for now and think about something a bit more complicated. Sharing memory between two or more processes might be problematic when scaling because if you’re already trying to share data while clustering (between master and workers) or you’re thinking about starting to communicate two or more processes through memory, then you have to start thinking in a distributed fashion.
When scaling, you will start running into multi-server scenarios, and by default your servers don’t share memory. You have to stop thinking about sharing variables and memory space and start thinking about exteriorizing that shared data and moving it into outside storage.
If you’re using shared memory, I’m assuming that performance and read speed are a concern, so moving this data into any type of storage is not an option; we need something that will provide the same type of performance gain (or as close as possible) with minimal integration effort. You will have to restructure your code if you’re already doing that; there is no way around this, but at least we can try to minimize the damage.
There is no better way to move away from sharing memory and into a shared memory between your processes than choosing one of the many options, such as Redis10 (a complex key-value, in-memory storage system, with support for complex data structures, pub/sub and other useful features), Memcached11 (a simplified version of Redis, with a multithreaded architecture), AWS ElastiCache12 (which essentially is a managed version of the first two), and so on.
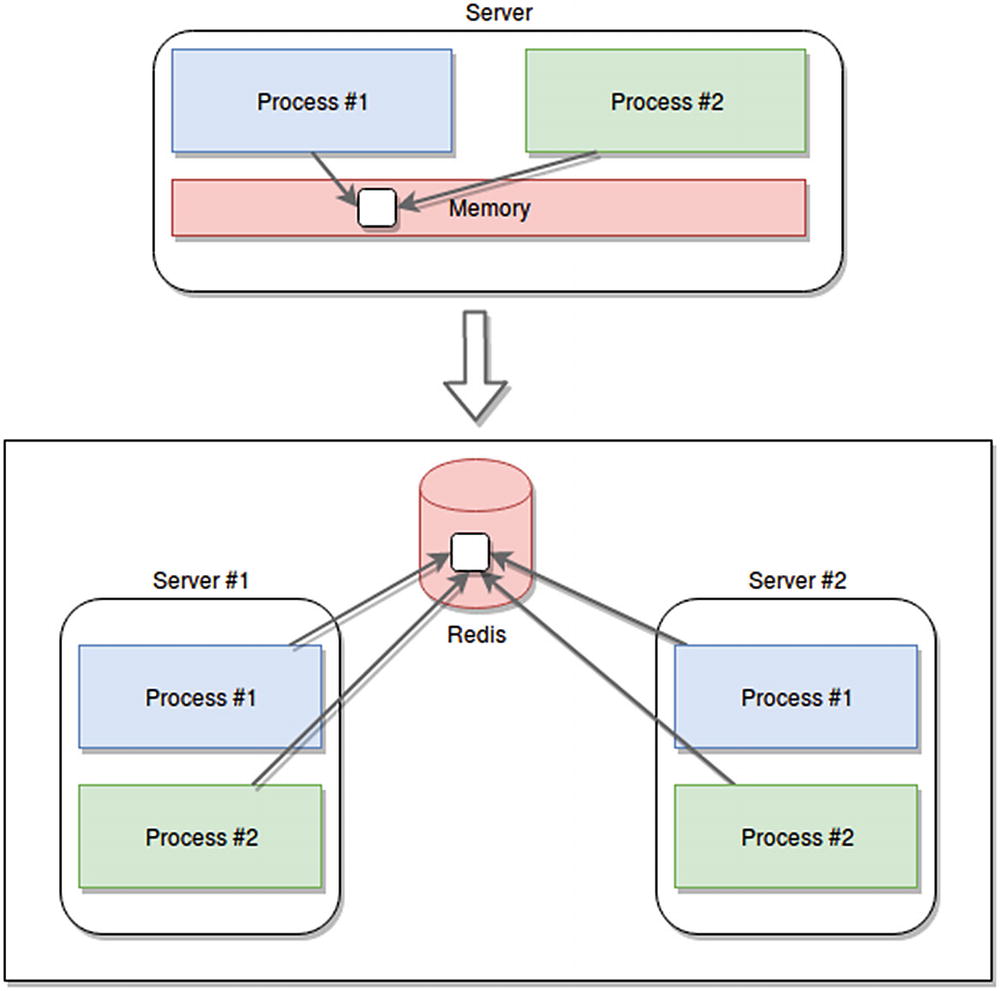
Migration from sharing memory between processes into an external shared memory system
Support for multi-server scenarios, where they can all access the same information, no matter where it came from.
Stable and reliable in-memory storage, which you can use to centralize the shared information. These systems are developed to be resilient and in most cases, they allow for high availability or fault tolerance support.
Unlimited memory to share data. You can setup AWS EastiCache to auto-scale whenever needed and increase the available memory. This is something you definitely can’t do in a single-server scenario.
Depending on your use case and your choice, you might even get extra benefits, such as the Redis pub/sub or keyspace notifications, which allow you to work reactively with in-memory mutations (such as changes in a value, or additions to a list).
Whatever your use case might be, if you’re planning to share or already sharing memory between processes and you now need to start thinking about how your system will scale up, then a good rule of thumb is to go higher-level and forget about it. Just extract that shared memory into an in-memory database that you can manage (or have managed for you). They are less complicated to maintain and provide far more benefits at a very high access speed. And yes, I understand that they can’t match the read speed of shared memory, but once again, you should double-check your needs based on your use case and think long and hard about whether the added performance of that setup is actually worth the limitations and complications it also brings with it.
Single Points of Failure? No Thank You!
It may seem obvious, but you should avoid having single points of failure (SPOFs) whenever possible. They are basically your weakest link and if they break, your entire application/platform/system will be rendered useless.

Redis as a single point of failure
In this scenario, all services depend on Redis, but Redis is not set up to be able to handle any type of problems; in fact, there is only one instance of Redis running. If it fails, your entire system will be rendered useless. The fix for this one is easy enough; just change the way you have your Redis running. You’d probably set it up as a cluster, or with Sentinel,13 so your master nodes will have a slave assigned just in case.
Getting rid of single points of failure can be as easy as setting up a cluster or as hard as adding redundancy to your entire platform. It mostly depends on how far you can take the process until it no longer provides enough bang for your buck.
Let me give you another example, going back to Figure 4-3. After you set up your minimum Redis cluster (which by definition will already contain three master nodes and three slave nodes) you realize that all nodes could fail, because they’re servers you actually have inside your own datacenter. So you decide to move to the cloud and deploy your own Redis cluster in AWS. You then realize that all those servers could still be unreachable if there is a region-level outage, so you again redeploy on a multi-region setup. Great, but what if Amazon goes out of business (unlikely, I know, but bear with me for a second)? You now redeploy your multi-zone Redis cluster in Azure as well, and you have both multi-zone load balancers and extra logic in your code to determine when to pick each one.
You’re now paying a whole lot more money for a level of stability that you might never need.
Knowing When to Stop
Understanding that you have SPOFs is half the battle; knowing when to stop going down the rabbit hole is the other half. I’ve had discussions with teammates who argued that my managed Redis cluster was a SPOF because most of my services actually needed it for some task (Figure 4-3 is based on personal experience). It can definitely be a chokepoint if it’s not properly optimized, but given our use case and business needs, it made no sense to even start thinking about contingencies if that cluster were to fail, because if it did, a lot of other things would also fail and honestly, our SLAs did not cover that much availability.
So when do you stop and say: “this is good enough”? In my opinion a good tool for that is the SLA (Service Level Agreement) you sign with your users or clients regarding the performance, availability, and overall quality of your service. It usually boils down to a number, a percentage that is between 90% and 100% (such as 99%, also known as “two nines,” or 99.99%, known as “four nines”) and is in the context of a period of time (the most common ones are a week, a month, or even a year).
You basically take that percentage from the number of minutes in the time period defined, and you have how much uptime your system is expected to have in that timeframe. But reaching that number is not an act of magic or pure guesstimation; it’s a process that if done correctly, requires a lot of analysis and discussion.
To give you a quick overview (you should dig deeper into this subject if you’re not familiar with the concepts that are coming), the tools you’ll need to properly find that number are called system-level indicators (SLIs) and system-level objectives (SLOs).
System-Level Indicators (SLIs)
These are metrics you will develop and measure constantly to understand how your system is performing. They are not strictly hardware- or performance-related; they are business-related. In some cases they might be obvious, such as counting how many web pages load within an acceptable timeframe (100ms, for example) on web apps. But in others they might not be, such as comparing the number of billing requests in your web-server log files against your database records at the end of the day and making sure the percentage of correlation is close to 100%. These indicators should be set based on conversations between developers, devops/sysadmins or whatever flavor of them you have on your team, and the business.
All three parts of the equation must be present and must give their opinion as to what makes an indicator relevant and measurable. Each SLI should have a basic description of what it’s meant to measure from a business perspective and then a detailed description of how it needs to be measured from a technical perspective . Basically, the more documentation you can write about an SLI, the easier it will be to both maintain it and review it in future iterations.
To define your SLIs properly, remember to keep them user-centric (it might be a good idea to define them based on the user journeys for your application) and to think about metrics that can be measured in the form of “good events” divided by the “total number of events” times 100. This will provide metrics like “proportion of home page requests loading in under 100 ms.”
If you have a user-facing section of your application, you might want to think of using SLIs of the availability, latency and throughput types. Or put another way, you want SLIs that ask, “can my system provide a response to a request?,” “how long does it take to do it?,” and “how many requests can it handle?”
on The other hand, if you have a storage system you want to keep track of, you might want to consider going with latency, availability, and durability SLIs. These ask, “How long does it take to read and write?,” “can we actually request data from it?,” and “is the data there if we need it?”
Finally, Big Data projects have specific types as well, such as throughput and end-to-end latency. For instance, you can ask things like “how much data are we processing?” and “how much time does data need to go from ingestion to final storage?”
System Level Objectives (SLOs)
These are the objectives you want to aim for on each of your indicators. They’re percentage numbers in a timeframe, just like the SLAs, but internal. They’re not shared with your users or customers, since they usually act as the upper limit of what you expect your system to do, not exactly what you want to state that your system can do to the outside world. (In other words, try not to shoot yourself in the foot by sharing these values.)
You should arrive at them based on your understanding of your user’s needs, which is why having the business represented in these meetings is important. Sometimes techies like the developers or the sysadmins will only think from their technical expert positions and forget about what the user actually feels like and wants from the application they’re building. This is not to say they shouldn’t help define the objectives, which must be a group effort to avoid leaving anything out.
These defined objectives are crucial because in the context of rooting out SPOFs, you need them to understand when to stop pursuing that goal and start shipping.
When it comes to the number of SLIs and SLOs to write, as a rule you can probably assume one SLO per SLI and up to three SLIs per user journey. If you start seeing a lot of relevant SLIs being defined as a result of these meetings, you should consider grouping them into more generic topics. For example, if you happen to have three or four different SLIs that talk about loading time of web pages, you can probably collapse them all into a generic one that’s not related to a single user journey but to several (or maybe all of them).
What Happens When We Don’t Meet Our SLOs?
Finally, and although it’s not entirely related to SPOFs, if we’re talking about SLIs and SLOs, we need to understand what to do when those numbers aren’t met. Because you can identify your key user journeys and create all the SLIs you want for them, and you can sit down for weeks with the business, your devops, and your developers and come up with realistic and reachable SLOs for those indictors. But you also have to expect the system to fail at some point and not meet those numbers.
When that happens, you should already have a plan for it in your deployment and development policies. You should be keeping track of the failures and count the time your system is not conforming as expected. If this time exceeds a given preset amount (some people call it an error budget), then you need to have already defined what to do. For example, you may decide to hold back work on new features until major bugs are fixed, or cancel new deployments until bugs causing the issues are found and fixed. These are all strategies you need to think about while working on your indicators and objectives.
Agreeing on Your SLAs
The final step in this process will be agreeing on your SLAs, which obviously will depend on your business case and use cases, but should be kept under the objectives, with the intent of preventing your user from expecting excellence in a scenario where not everything is 100% up to you and your team. Service providers might fail to deliver, and even if you don’t, your users will fault you and see your services as the one not fulfilling the predefined agreement.
Stateful Apps and Multi-Server Scenarios
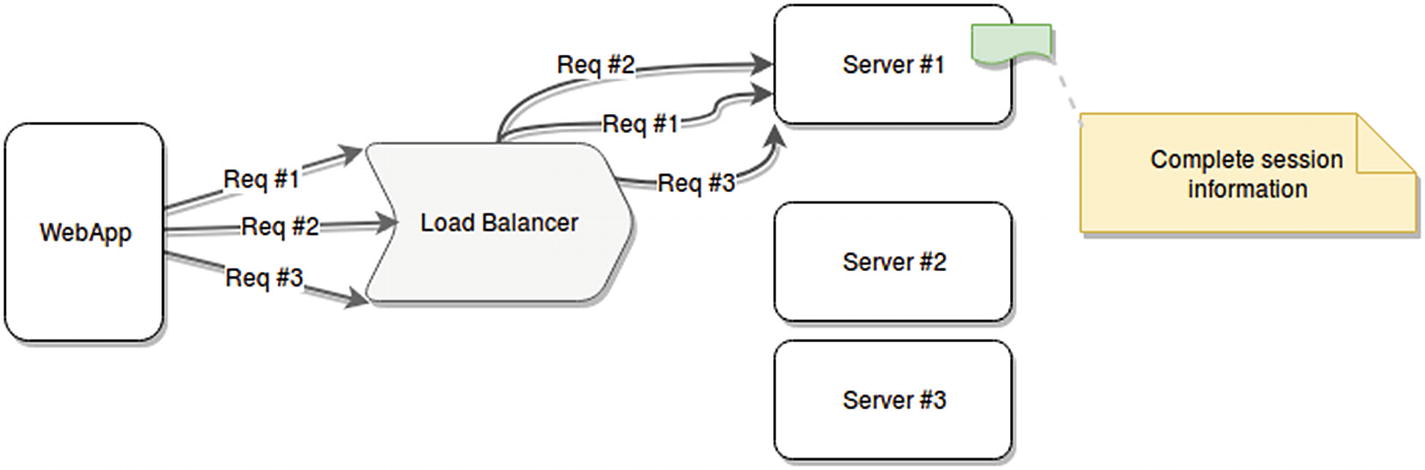
Last but certainly not least is the problem that we might run into in systems that store in-memory information about active user sessions. When this happens and we start duplicating these services into multi-server scenarios, the usual setup includes a load balancer in front of all these new servers. This load balancer will in turn distribute the load as equally among all servers as possible, and there is no guarantee that your user will land two subsequent requests on the same server.
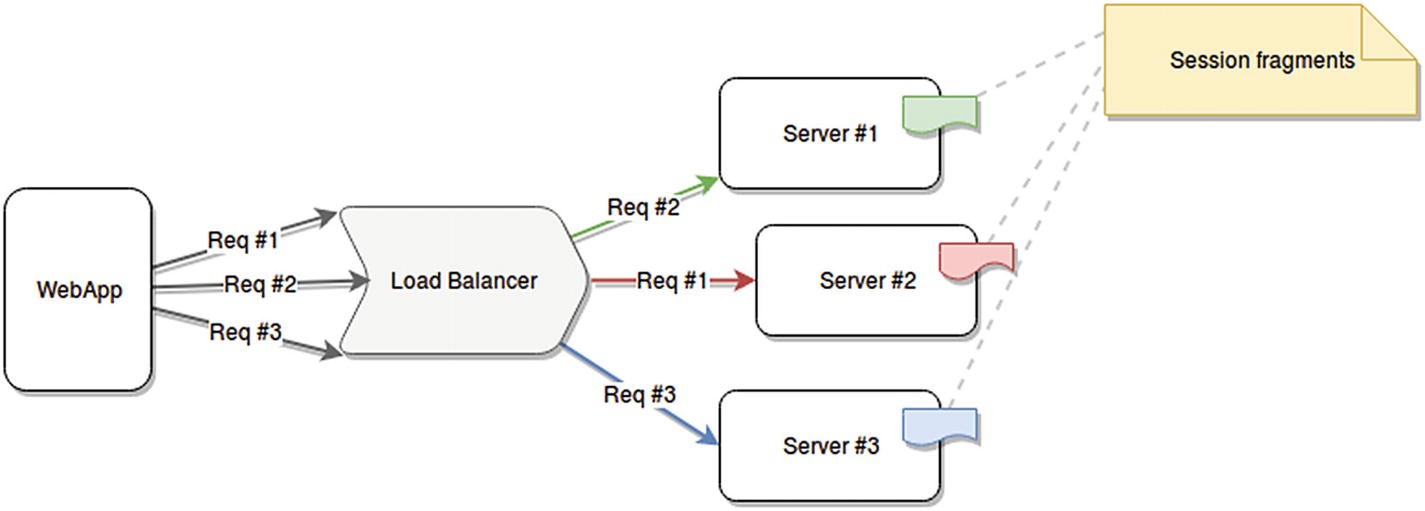
Example of a web application making three requests for the same user and landing on three different servers
This is far from ideal, and it can cause some serious issues if your servers’ logic depends on that information. The good news, though, is that this is relatively easy to fix, and in some cases, it will not even require any code changes.
The first and obvious fix for this scenario, is, as I’ve already covered in this chapter, to remove the in-memory information from the server and move it into an external storage, such as Redis. This would, of course, involve code changes and the added complexity of setting up and maintaining the Redis cluster. The upside is that it doesn’t affect the balancing strategy used by your load balancer and helps keep your load evenly distributed.
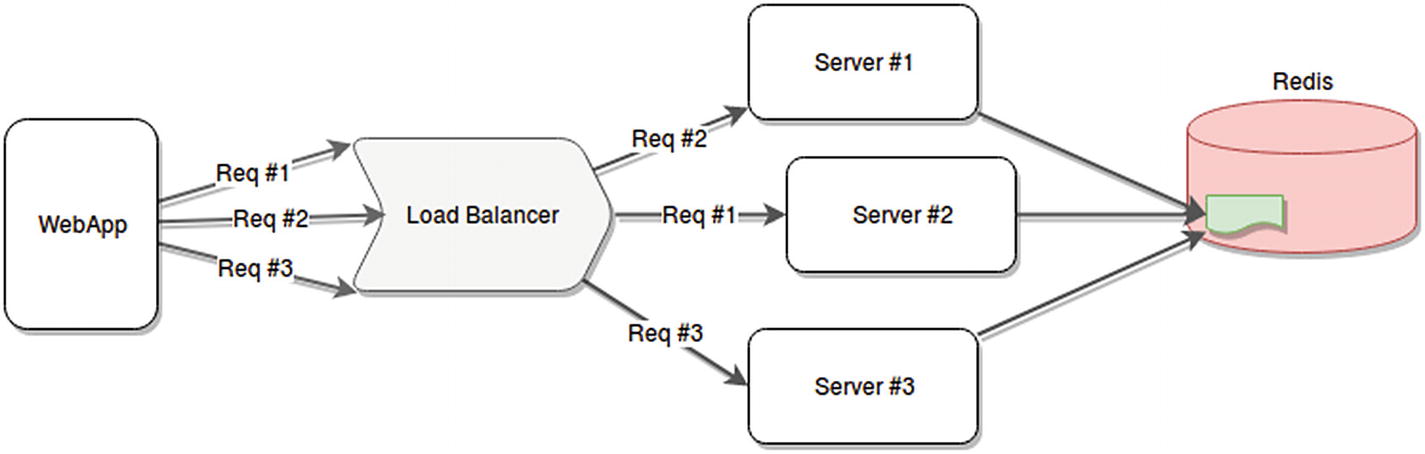
Solving the fragmented session problem using external memory access
Solving the fragmented session problem with sticky sessions
Example of Apache configuration to handle sticky sessions
Most of the common load balancers already have support for this feature, but you have to make sure it makes sense on your side to have it as well, since it could cause some difficulties if you start using HTTPS; because request information can’t be analyzed, other methods need to be used to identify requests. You might also run into unbalanced servers receiving too much traffic, just to name a couple of possible issues.
In the end, this technique is just as valid as turning your stateful services into stateless ones; you just need to make sure that by going this way, you’re not hiding design flaws on your code.
Summary
That is it for problems that can arise when scaling your system. My intention wasn’t to scare you away from attempting to scale; it was to give you the tools that you might need to solve those problems should they happen to you.
In the next chapter I’m going to cover how to monitor your platform in order to understand when to scale up or down. This is something that can be done both reactively and proactively, but you have to understand how your platform behaves before deciding on a strategy.