
Having the tools to scale your architecture but lacking the data to understand when to use them is like having the keys to your dream car but not knowing how to drive it. You need the information to back up your scaling decisions. You need to understand when your inbound traffic is too big for a single server, or when your database processor is screaming in pain asking for a sibling to help take the load off.
In this chapter I’m going to cover some of the most common tools that will enable you to both monitor different key aspects of your platform and react to those results by triggering an elastic behavior in your platform.
Monitoring

Different types of monitoring
If you go one level up, you can start monitoring your networking devices, such as load balancers, routers, and others. From them, you can get information related to the traffic your app is getting, and you can also get some level of details about response codes to understand what kind of problems you might be dealing with. The information you’ll get at this level will be domain-specific, and you’ll need to have some basic level of understanding about the app you’re trying to monitor to understand how to respond to this information (unlike monitoring CPU load or disk space utilization, where no matter what you’re doing, no disk space is always bad).
Finally, the top layer is reserved for app-specific indicators. These are the ones you can’t just “pull” from places; you have to first put them there by writing the required code. These are hyper-specific indicators that are only relevant to your use case and make sense only within the business rules of your application. Depending on the type of monitoring system you might be using, you could simply need to add this ad-hoc information into your log messages and then by parsing that data, you’ll get the indicators. Or you could also be using some third-party module to send those new indicators into your monitoring system directly.
Whatever your application might be, if you’re worried about your scaling needs, it might be a good idea to start from the bottom and move up as your architecture grows. Many systems are great with basic infrastructure monitoring, but the more complex the app (meaning, the logic rules behind it), the higher up you’ll have to go on the pyramid.
Alerting
A final concept for monitoring in general, before we start delving deeper into each of the levels I just mentioned, is alerting . This can mean anything; it can be sending an email to the user or it can be notifying some system that can it perform predefined actions. Whatever it might mean to you, it’s the whole point of this practice: you monitor and then you react to the values received.
Deciding when to send those alerts is also very important; both the triggering condition and the periodicity of the messages need to be taken into account to provide a good user experience and add value. Alerting for the sake of alerting is the worst thing you can do; the only thing you’ll achieve by doing that is overwhelming your users to the point where received alerts will be ignored.
Use different alerting channels: Depending on the severity and importance of what you’re alerting about, you might want to send that alert via email if it’s something your user should look at in the next few hours. You might want to simply send an in-app notification or leave some sort of alerting record if it’s something that needs to be reviewed eventually; or you can send a page, an SMS, or even a WhatsApp message to your user’s phone if the alert is really critical and she should take a look immediately.
Try to alert on symptoms instead of specific problems: For example, alerting when your homepage is taking too long to load is a symptom, which might be caused by various specific problems such as your database server being overloaded, your Redis cluster failing, or your web server’s disk running out of space, to name a few. When you alert on symptoms, you’re providing context to your users, letting them know how the current problem is affecting your customers. As an added bonus, your alerts aren’t bound to your infrastructure. Going back to the previous example, suppose you were to remove your Redis cluster because you no longer needed it, and instead added an Elastic instance into the mix. If you were alerting on symptoms, your users will still be getting the same alerts when problems with Elastic start causing delays on the homepage loading times; but if you weren’t, then you now have to introduce visible changes by removing old alerts (the ones related to Redis) and new ones (for Elastic). In other words, your alerts are more durable if they’re based on symptoms.
Try to alert only when the problems are real: This might be an understatement, but your alerting strategy should be smart enough to understand when the symptoms being reported are due to an actual problem and when they’re caused by a known maintenance window (for example). A planned server update might overload your processors for a few hours, causing some slow response times on your platform, but you definitely don’t want to wake up your sysadmin at 3 a.m. because of that.
Make sure your alerting strategy allows you to be proactive and not reactive to your problems: There is a very big difference between being notified when your system is taking 300ms longer to load than normal and being notified when your pages aren’t loading at all. You obviously want the second kind of alert (you should always prepare for the worst), but it shouldn’t be the only one.
Monitoring Your Apps
Specifically when it comes to monitoring Node.js applications, there are too many possibilities to cover them all in this book, and eventually we would start seeing repeated features. And we’re not just looking for a monitoring tool, remember that we’re trying to set up an environment that can scale up and down, according to our needs. So we need a solution that can monitor and react to the values receive by triggering a set of scaling rules.
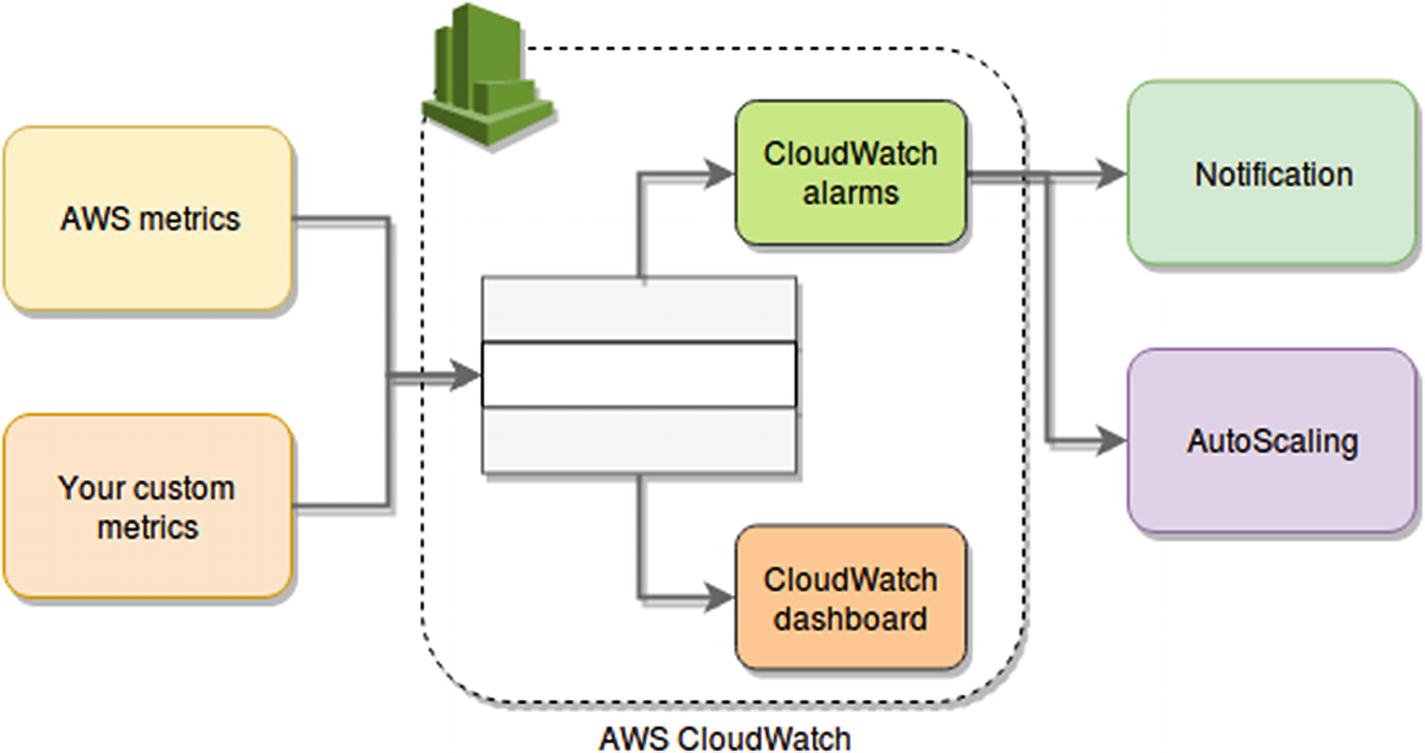
Monitoring/Alerting/Scaling diagram using AWS
The idea behind this example is that CloudWatch will be gathering metrics both from our own application (ad-hoc metrics) and from AWS services that already provide them automatically (such as EC2). These metrics will be monitored by AWS CloudWatch Alerts and displayed and charted by AWS CloudWatch Dashboard. The alerts will trigger actions, which can be anything ranging from a notification (via email, SMS, or even an SQS queue) to a call to the AWS AutoScaling service.
In order to look at this, we’ll use a sample application, so you can see how the ad-hoc metrics can be provided to AWS using their own libraries. This sample app is going to be mind-numbingly simple, but the point is to avoid distracting you by looking at unimportant code, so bear with me.
Code for “What’s the time?” API
To start the refactoring process, we’ll begin by installing the SDK module from AWS, and with it, we’ll create a basic metric reporter, which will let us send custom metrics back to CloudWatch.
Installation of AWS’s SDK module
Structure and data type of the metrics parameter
List of attributes available as part of the metric’s data
Attribute | Description | Required? |
|---|---|---|
MetricData | Contains the data for the metric. This is an array of objects that will hold the information for each metric being reported. | Yes |
MetricData/MetricName | The name of your metric can be anything you’d like. Just make sure it’s something that you can understand easily by reading it, so later you can look it up on CloudWatch’s console. | Yes |
MetricData/Dimensions | An array of objects, which are simply Name, Value pairs. Your metrics can have between 1 and 10 dimensions each. | Yes, at least one |
MetricData/Timestamp | The time when the piece of metric data was received. It is expressed as the number of milliseconds since Jan 1, 1970 00:00:00 UTC | Not required |
MetricData/Value | The actual value of the metric. Note that although the parameter is meant to be a Float, CloudWatch does not support values too big or too small, or special values such as NaN, +Infinity, and so on. | Not required |
MetricData/StatisticValues | An object which contains a set of attributes pertaining to statistics about your metric. | Optional, but if used all of its children are mandatory |
MetricData/StatisticValues/SampleCount | The number of sample values used for the statistics reported. | Only if parent element is present |
MetricData/StatisticValues/Sum | The sum of values for the sample set reported | Only if parent element is present |
MetricData/StatisticValues/Minimum | The minimum value of the sample set. | Only if parent element is present |
MetricData/StatisticValues/Maximum | The maximum value of the sample set. | Only if parent element is present |
MetricData/Unit | The unit for your metric. It is an enum, so only a set of predefined values can be used here, such as “Seconds” or “Bytes” or “Bits/Seconds”. Refer to the documentation for the full list.4 | No |
Metrics module using AWS’ SDK
Format of the credentials file
That file should be stored in ~/.aws/credentials (or your usual Windows equivalent), and you can get that information from AWS Console, while creating your users or by regenerating these keys (for security reasons the AWS system does not allow you to download existing keys).
Modified code of the main API’s code
Let’s break down the code from Listing 5-6, because there is a lot in there, even though it might not seem like it.
I’ve added all the code inside the request handler; this is for simplicity, but you can refactor it as you see fit. In it you can see I’m just calculating the time difference between the previous line actually getting the current date and the line after it. In other words, I’m just going to be reporting the performance of this endpoint and the number of requests it received (simply by sending the first of the two report calls).
Because this is clearly a very simple endpoint, I’m adding a few random numbers to the time difference calculation, just to add some variability to our results (you’ll want to omit that random bit in your own code, obviously).
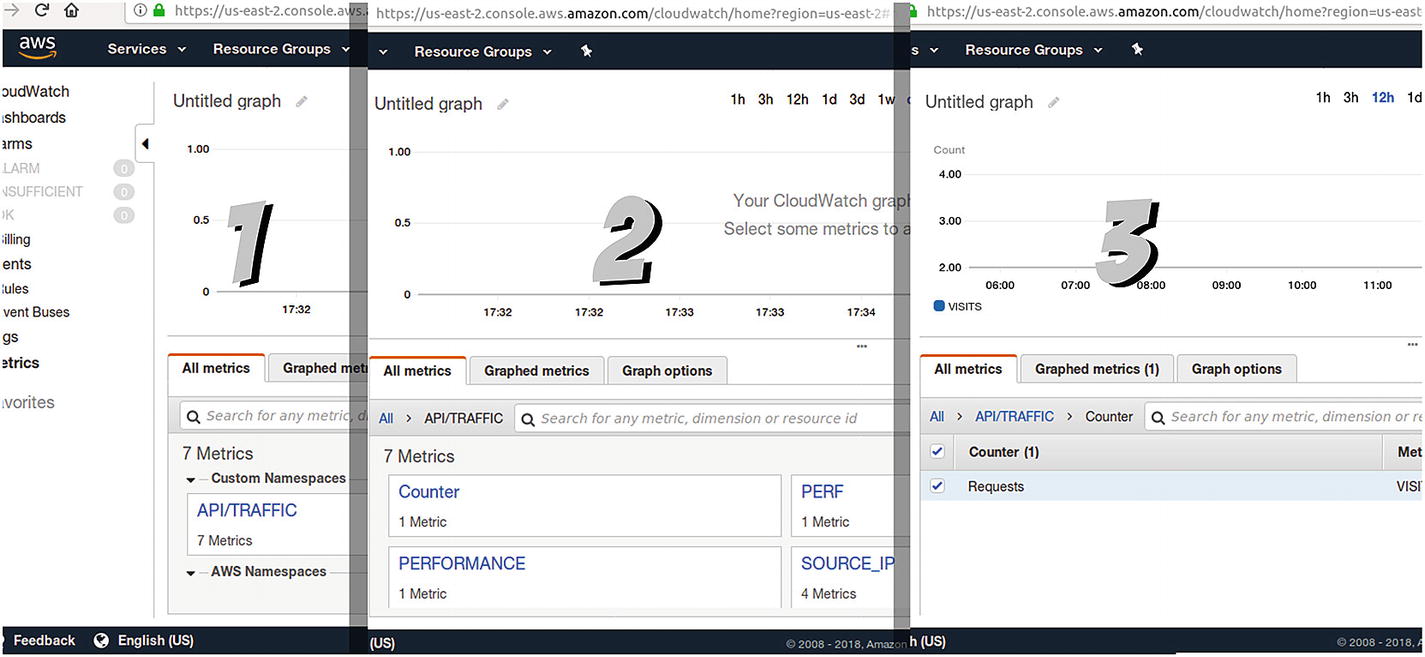
Steps navigating through your custom metrics
Note
You can’t use namespaces starting with AWS/; those are reserved for AWS services.
- 1.
In the first step, you can see the namespace we defined on our code API/TRAFFIC, and below it, you can see the space for the AWS namespaces (which we’re not using right now).
- 2.
The second step will show the domains defined inside our namespace. In this example you can see four, which are tests I made, but two of them are the ones defined in the example of Listing 5-6 (Counter and PERF).
- 3.
Finally, in the third step, you can see the counter we defined for the number of requests. By selecting it, you can add it to the plot on top of this list.

Plot of the requests metric
The Statistic column needs to be changed from the default value (which is Average) into Sum; since we’re submitting a 1 with every request, that will allow us to get the exact number of requests in the period of time we pick.
The Period column was also changed; by default it was aggregating data every 5 minutes, and for the purposes of this demo, I wanted a more detailed view, so I changed it to 1 minute.
Finally, I added a name in the top-left corner of the chart, to make sure that once I add it into a dashboard, I can properly identify the widget.

Plot for the average delay
Caution
Remember that you can do these tests using the free tier of AWS, but if you go overboard with your metrics and alerts, you might start running into costs.5
Adding AWS Metrics into Your Dashboard
Compared to adding your own custom metrics, this should be a walk in the park; but nevertheless it’s also something you should be aware of, since it will allow you to monitor your infrastructure.
The great thing about using CloudWatch is that it is very straightforward. Remember the earlier section on the AWS/ namespace? Well, for every one of its services you use, several namespaces will pop-up under this section, letting you pick the metrics you care most about. Maybe you want to look at CPU utilization, or memory consumption, disk read operations, network traffic or a lot of other indicators.
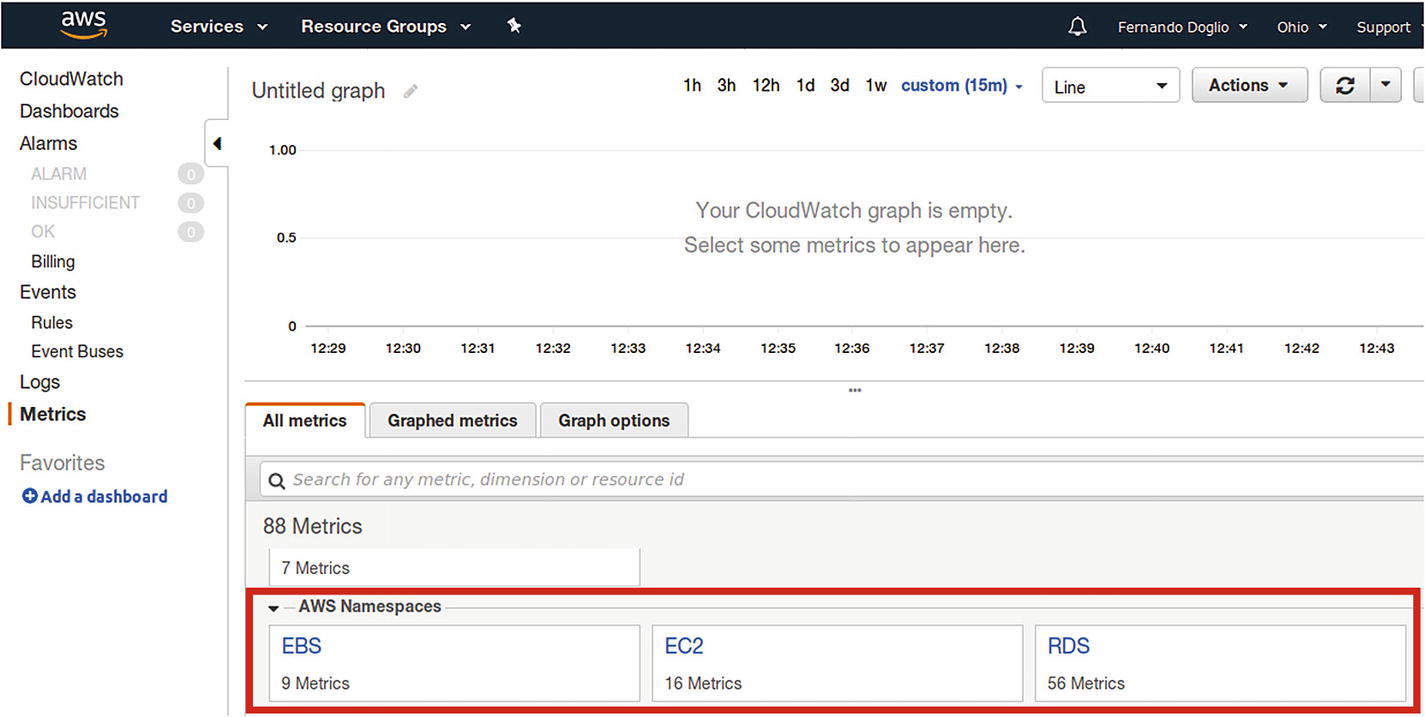
New AWS-specific metrics appear automatically
As you can see, AWS provides a lot of metrics for each service, so you can make sure you are aware of everything you need for your infrastructure-related metrics. And based on that, you can create whatever scaling rules you need (more on that in a bit).
Reacting to Your Metrics
This is the last step in the process. So far, you’ve being setting up your monitoring system to look for both custom and default metrics received by your infrastructure and your own Node.js application. You’ve created at least one dashboard (maybe more), and you can log in into AWS Console any time you want and look at those numbers.
But we want that process to also be automated; it makes no sense to have you, or anyone else, systematically logging in and checking numbers, does it? So instead, let’s look at how you can use AWS Console and its services to understand how to automate that process.
Note
For simplicity purposes I’m not going to go into all details regarding this process, especially because AWS tends to update it and make minor changes from time to time. Instead , I’ll go over it quickly and let you look at the detailed documentation they provide (and maintain) if you need to know more.
- 1.
You’ll first want to create at least one Alert based on your custom metric (or your default ones, it’s up to you). This alert only needs to notify a list of users when your metrics breach a given threshold. These alerts will be the triggers for the autoscaling actions you’ll define next.
- 2.
You then need to create a Launch Configurator. This component will know what kind of instance to use when scaling.
- 3.
After that, you’ll want to create at least one AutoScaling group, which will have the Launch Configurator associated with it. This group will determine how many instances to create, and will contain the AutoScaling policies.
- 4.
These policies, in turn, will be associated with the alarms you created in step 1, and they will be configured to either add or remove instances when the alarm is triggered.
That is the basic process you need to go through to automate the reaction to your metrics. Let’s now go into a bit more detail on each step.
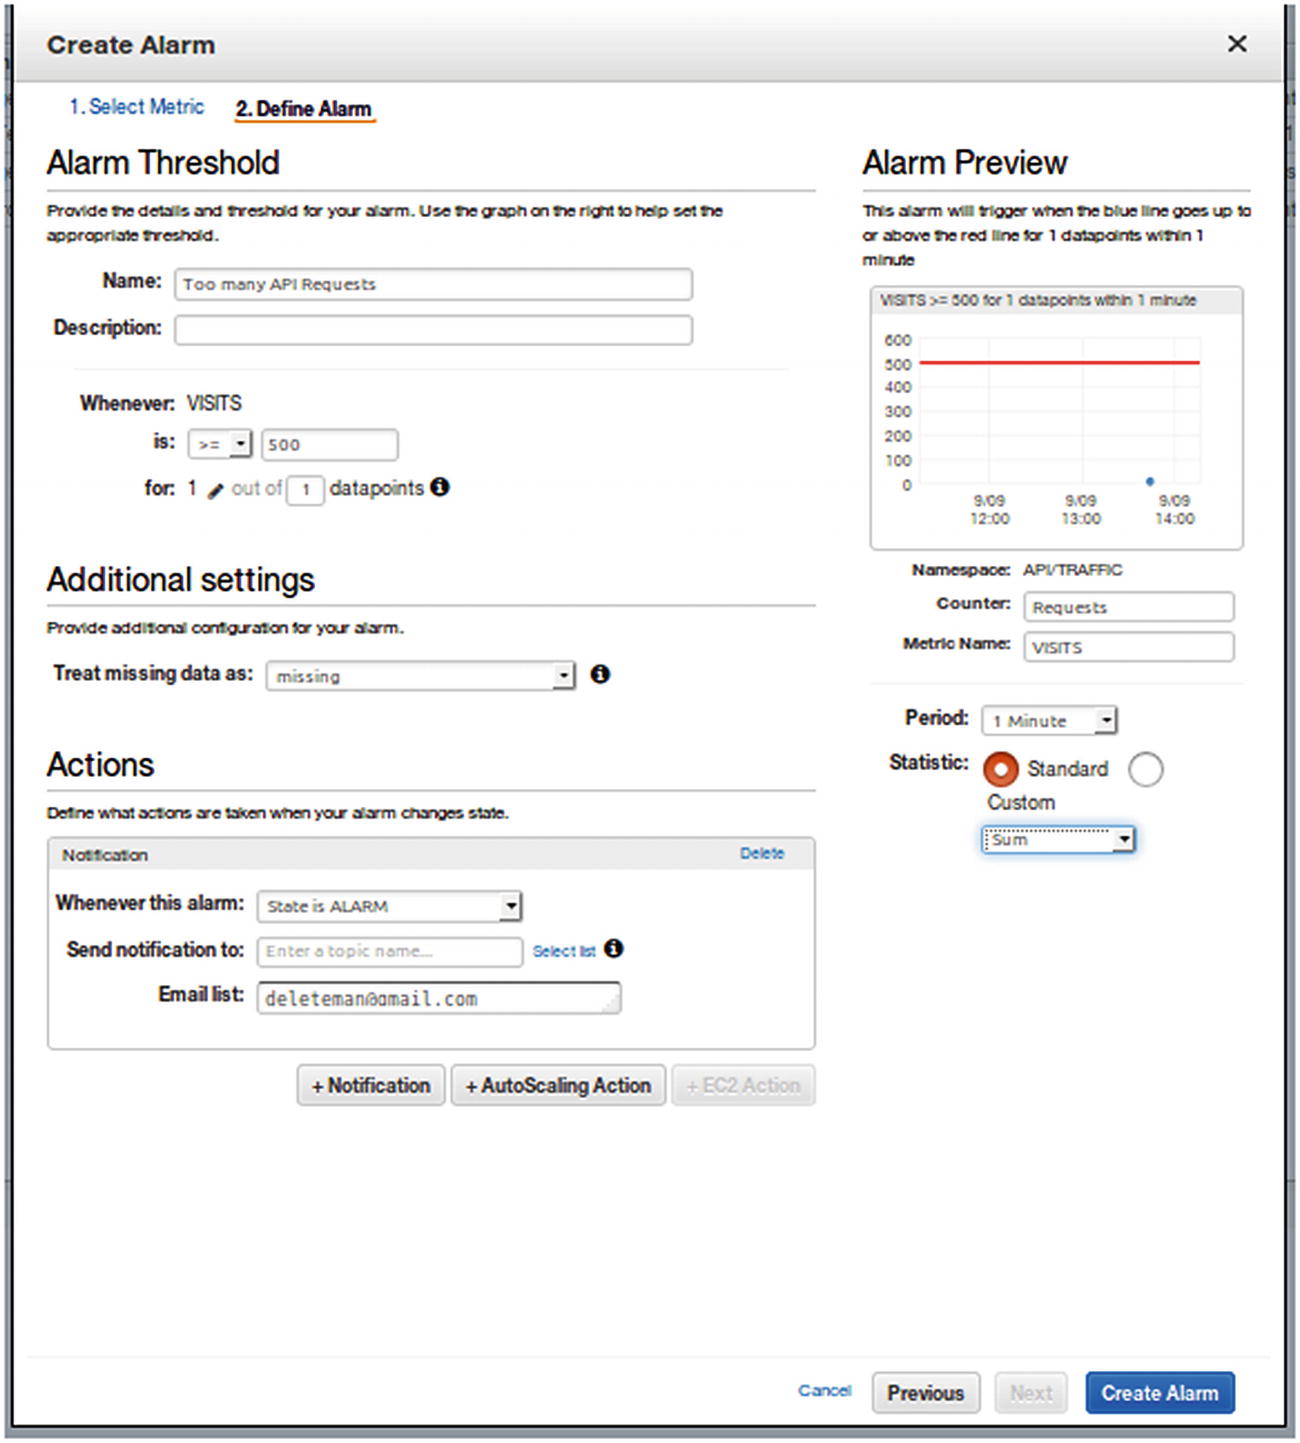
Step 1: Creating Your Alerts

Step 1 of alert creation
You can play around with the chart in Figure 5-7 as much as you like, even changing the operation to perform on the data (as we did for the Statistic column a while ago) and the time period for the sampling of these numbers. After you’re happy with the results, you can move on to the final step, which will take care of setting up the actions for this alert.
Step 2 of alert creation process
Note
After you’re done with the alert, it will appear on your alert list (under the CloudWatch console). Initially this alarm will appear on the INSUFFICIENT list, simply because this alert will take a few minutes to start reporting the data needed. Just wait 5 minutes and the alert should go into another section (either OK or ALARM if it’s being triggered).
Steps 2 through 4: Setting Everything Else
Once you have your alerts ready, let’s jump on to the AWS EC2 section, since we’ll be setting up our autoscaling actions to create new EC2 instances.
On the left menu, under the Auto Scaling section, go to the Auto Scaling Groups section, and create a new group. You’ll be prompted to create a group based on a configurator, either an existing one or by creating a new one. If you don’t already have a Launch Configurator, then select that option, and you’ll be prompted to configure it.
You’ll basically be asked to select the AMI to launch when required as well as the type of instance to use for those AMIs. In the end, it will just be a matter of giving this configurator a name, so you can identify it later.
Once you’re done with that process, you’ll be taken back to the group creation process. Just give the group a name and select at least one Subnet (the rest of the parameters can be left to their default values for the time being).
After that, the next step is to set up your policies. You can leave the group as it is right now and come back to it later, a good option if you don’t already have the policies thought out. But if you already know how you want your group to behave, simply add the policies right now.
- 1.
The minimum and maximum group size, so you’ll make sure you don’t create too many instances by mistake
- 2.
A name (such as Scale Up and Scale Down for when adding and removing instances)
- 3.
The associated alert that will act as a trigger for this policy
- 4.
The number of new instances to add or existing instances to remove
- 5.
How long to wait between actions (simply to make sure you wait for the new instances to finish booting up before launching new ones)
The next steps are very straightforward; you’ll be able to set up notifications when autoscaling takes place, so you can be aware of everything happening at any given time. And that is it; after this step, the rest of the process is optional and not relevant right now. Once your autoscaling group is configured, you’re done, and you can start testing it. If you’ve been following the examples in this chapter, you can boot up your API and send several requests in a row; and if you configured a low enough number on your alert, you’ll see how a new instance is triggered for you.
Summary
This chapter addressed the question of when to scale. We also went over a practical example of how to set up one of the main cloud provider platforms to monitor and auto-scale your platform based on whatever metrics you might think of.
In the next chapter, I will cover a topic that even though it is not strictly related to scaling platforms, is very much required for creating applications that are stable enough to scale properly: testing your applications.