
In Star Trek, the characters used tricorders to capture data. The technology we have today is not as advanced as that in Star Trek , but still very amazing. The next step in this book is to start using this technology to obtain scientific information. This chapter covers information that is very important for someone just starting with either the Arduino or Raspberry Pi and provides a few easy methods to save data using them. This is called data logging and is useful to save the information to be utilized at a later date. The STEM principles in this chapter include
Measuring temperature of the environment.
Using the Arduino, Raspberry Pi, and two types of temperature sensors. Gain an understanding on the difference between analog and digital sensors.
Programming temperature conversions and graphing the data.
While the reader may want to skip this chapter and go on to other more advanced projects, it is recommended to look over these projects and try them if the reader is unfamiliar with the Arduino or Raspberry Pi.
Data Logging with the Arduino
The easiest method shown in this book to log and capture data is to set up an Arduino to send data to the computer. Then use the IDE serial monitor to observe and save the data. Once the correct data is obtained, it is easy to copy using “Ctrl+C” after it is highlighted and then paste it into a spreadsheet or another document.
The parts needed are relatively straightforward to use the Arduino Uno and the serial monitor to gather data from a simple temperature sensor. The sensor used in this project is the MCP9700. It is a relatively inexpensive device and in this case is configured just like a standard transistor. This device is an analog sensor, which means the output is directly related to temperature and it can vary infinitely over the range. There is a flat side, and the leads must be connected as shown in Figures 2-1 and 2-2.
Arduino Uno
MCP9700 temp sensor (output is 10 mV per oC with a 500 mV offset)
- Miscellaneous wires to connect to the sensor
 Figure 2-1
Arduino and Basic Temperature Sensor
 Figure 2-2
Arduino and Temperature Sensor Schematic
Arduino SN102 MCP9700 Temperature Sensor Code
The preceding code has three main parts. They are labeled as Parts 1, 2, and 3. The first part sets up parameter which is MCPoffest for this type of temperature sensor. The second part starts up the serial port. The third part of this code starts the loop that gets the data from the sensor, converts the data from the sensor to Celsius temperature, and then posts it to the serial monitor.
The best way for the reader to learn the symbols and the code language is to try several simple pieces of code, Blink being one which is located in the Arduino examples folder in basics. This simple code does not require any wiring; it blinks an LED that is located on the Arduino. Gaining experience and looking at these simple pieces of code gets the reader on the path of acquiring the ability to read code.
Also note in the preceding code the symbol // is used to comment out a line so it does not run. This is helpful to explain the code and document aspects.

Serial Monitor in the Arduino IDE
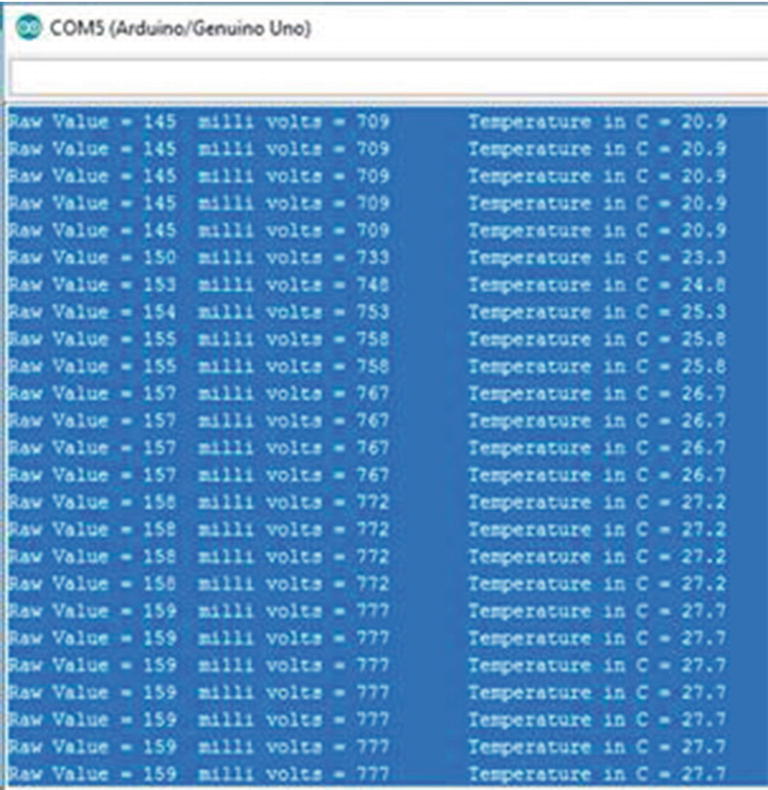
Highlighted Data in the Serial Monitor
A new feature in the Arduino IDE serial monitor is the ability to have it apply a time stamp each time data is taken. This does not require any code and makes it very easy to capture this information.
After copying the data and inserting it into a spreadsheet, the user needs to select how to limit (increment) the data. This means how the data is separated so the spreadsheet determines how to place it in individual cells.
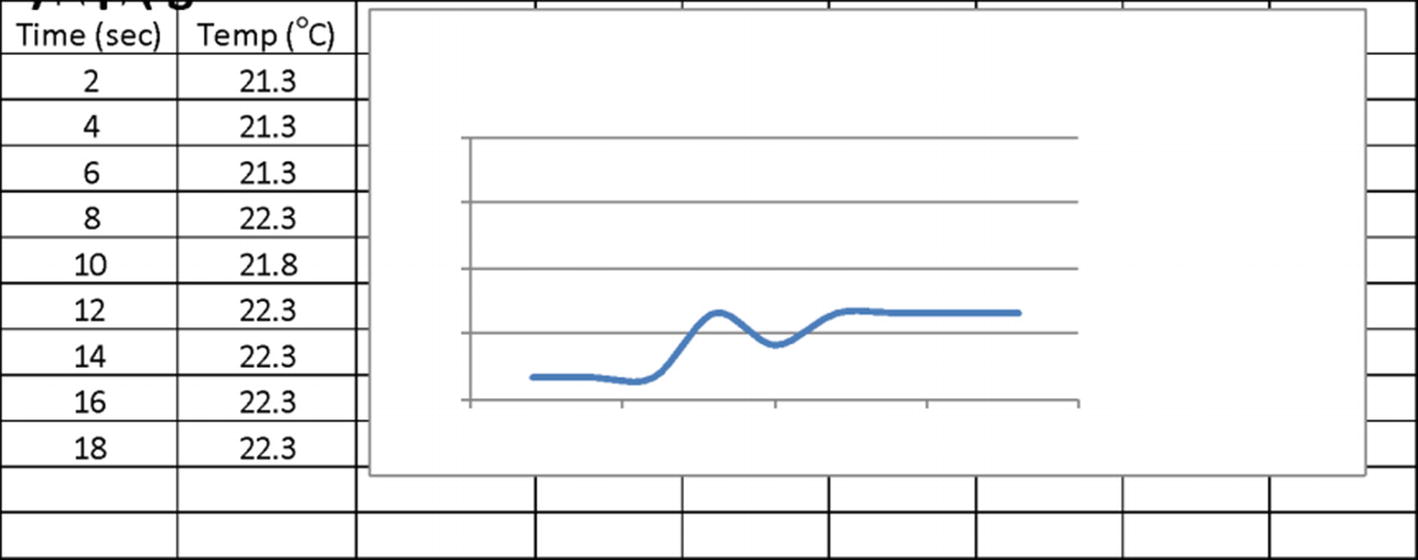
Excel Graph of Temperature Data
Another method of data logging will be discussed in a later chapter using a data logging shield. This board allows the user to set up the Arduino so it will collect data and save it in a file on an SD card on the shield without being connected to the computer. The SD card can be removed later from the Arduino shield to download the data to the computer.
Data Logging with the Raspberry Pi
The Raspberry Pi is a very low-cost technological breakthrough in a real personal computer that provides a lot of options for capturing and managing data. In this example, the authors will demonstrate how to capture and log data in a very similar way as was used on the Arduino in the previous section. One advantage of the Raspberry Pi is it has a built-in spreadsheet so that the data can stay on the device.
This project uses a different temperature sensor that is a bit more complex.
Raspberry Pi 3
MCM 40-pin GPIO breakout board and cable for Raspberry Pi (or equivalent)
DS18B20 waterproof temperature sensor (one-wire temperature sensor)
4.7K ohm resistor
Miscellaneous wires, proto-board, and terminal strips
The company MCM makes a 40-pin GPIO breakout board that has the power channels set up nicely for use (Figure 2-6 shows the 5 V connection on the left and 3.3 V connection on the right). There are other GPIO breakout boards available that are similar, but this one has the 5 V and 3.3 V connections directly to the proto-board which is helpful.
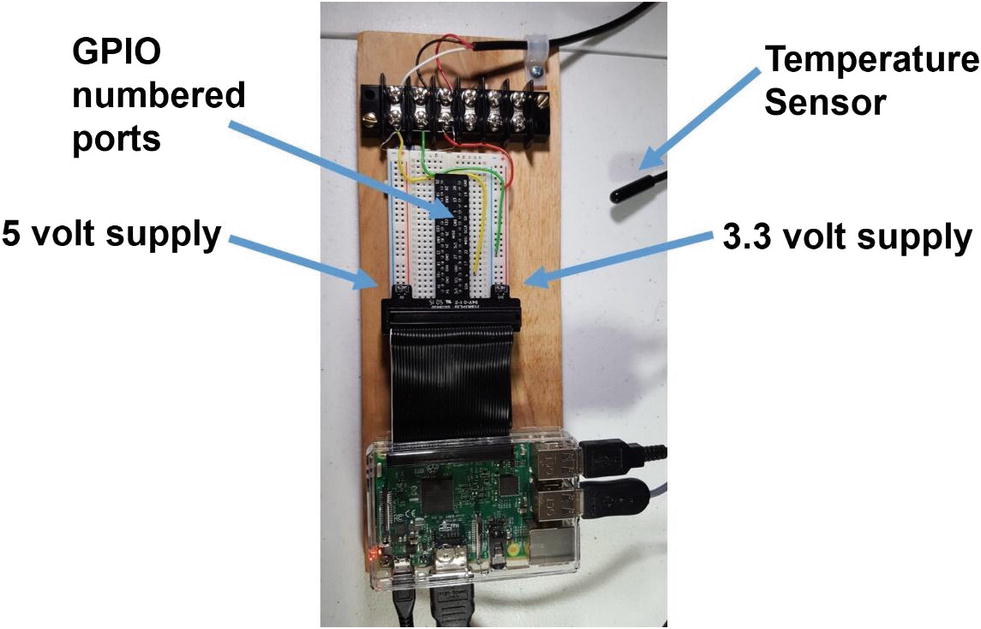
Raspberry Pi Connected to DS18B20 Temperature Sensor

Schematic of Temperature Sensor and Raspberry Pi
The following link at Adafruit has a great example to connect a one-wire temperature sensor to a Raspberry Pi:
https://learn.adafruit.com/adafruits-raspberry-pi-lesson-11-ds18b20-temperature-sensing
One thing that is required is to set the Raspberry Pi configuration to one-wire. To do that, you need to open the terminal window and then type in the command sudo raspi-config to open the configuration tool described in Chapter 1. Then scroll down and select Interfacing Options which is 5. Another window will open and then scroll down to select one-wire. Select yes to enable and press Enter. In an older Raspberry Pi, you may need to use the Nano text editor to modify the config.txt file directly.
Raspberry Pi Code PI_SN001 Basic 1 Wire Code
The preceding code consists of four parts that are labeled Parts 1, 2, 3, and 4. Part 1 imports the code modules that will be used. Part 2 configures the devices so the Raspberry Pi knows what is connected to the one-wire bus. Part 3 reads the device data, and then Part 4 records the value and sends it to the monitor pane running on the Raspberry Pi. In Part 3, the code takes the raw value and converts it to both degree Centigrade and Fahrenheit. The reader may notice the “#” symbol used in the code; this is a comment line and the computer ignores it. This is helpful to explain the code and document aspects.
To get it to run, go to Programming, open Python 3 or Thonny, find the file you saved it under, and open it.
Once in the program, select Run module, and then the data will start flowing.
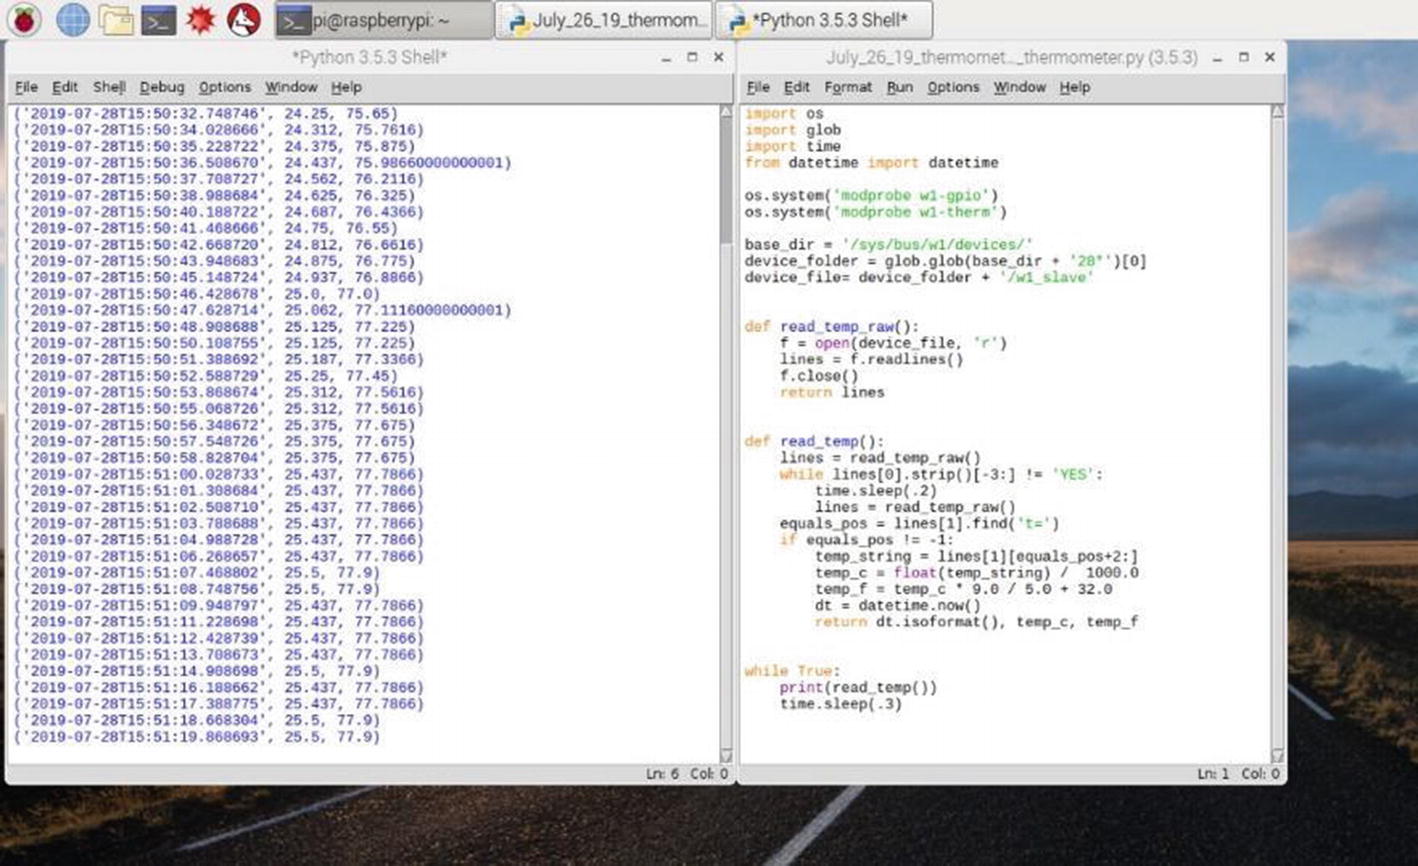
Code Running and Capturing Data in Python 3 Development Tool
The data on the left side can be highlighted and then copied over to a spreadsheet.
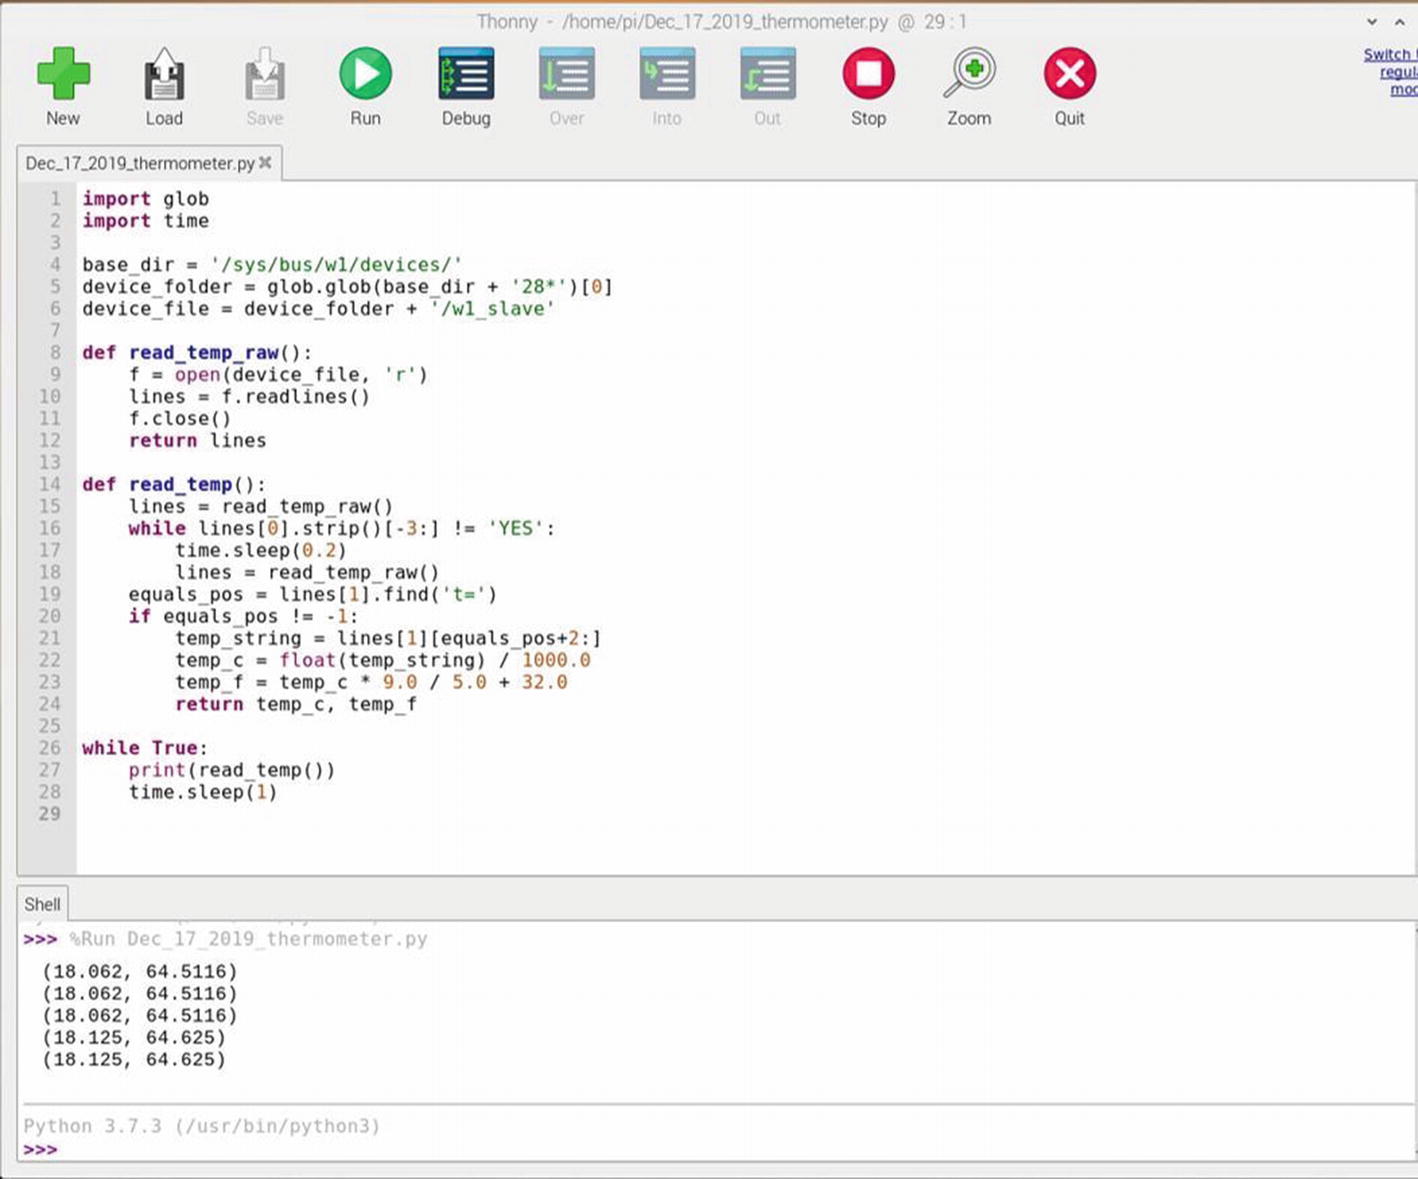
Code Running and Capturing Data in Thonny Development Tool
For readers who want to explore more about the Raspberry Pi and how it works with the one-wire devices and the I2C bus, this site has some good explanations and additional examples:
https://learn.sparkfun.com/tutorials/raspberry-pi-spi-and-i2c-tutorial/all
If the reader wants to create a data storage location, Listing 2-3 takes the data, creates a file if it does not exist, and then saves the data to the file. If there is a file, it just adds the data to it. This would provide a permanent record of the data if the reader is capturing a lot or if the Raspberry Pi is running unattended. This code is structured in a very similar fashion as Listing 2-2 and has very similar parts.
Make sure The following bolded lines of code are on one line:
Raspberry Pi Code PI_SN001B Advanced 1 Wire Code/Data File
The Arduino and the Raspberry Pi devices are approaching the Star Trek tricorder for gathering and saving data.
For those who really want to take this to the next level, this site describes a device built on a Raspberry Pi that resembles the Star Trek tricorder. It does not capture any data but instead plays videos of the original TV show; however, it looks incredible, and the Raspberry Pi fits inside the case:
Summary
These projects point out some interesting aspects regarding the MCP9700 and DS18B20 sensors. First, the MCP9700 output is a linear relationship but requires an offset. The DS18B20 sensor is directly proportional to temperature. Another item observed is the comparison of the response time of the MCP9700 temp sensor and the DS18B20 waterproof temperature sensor. The DS18B20 is encased in a plastic cover and as such responds to temperature changes slower. This phenomenon is known as heat transfer and will be explored in later chapters. Finally, the MCP9700 is an analog sensor which means the millivolt reading is not modified or converted; it provides an analog output of the actual temperature. The DS18B20 is termed an I2C (Inter-Integrated Circuit) device where the raw voltage is converted over to a digital reading. This data can then be sent over a digital bus to the computer along with several other devices.
The Raspberry Pi is not set up to receive analog measurements, but with the addition of an analog to digital converter, it can accept this type of data. This is described in a later chapter. As the reader can see, there are advantages and disadvantages to both types of sensors. In a later chapter, there will be a third temperature sensor utilized. It is the LM35, and it will be in a different package that is sealed, designated TO. Electronically, it behaves very similar to the MCP9700.
While it is not necessary to complete these projects to proceed in this book, they lay the groundwork for using the Arduino and the Raspberry Pi tools to capture data. In particular, Listings 2-1 and 2-2 demonstrate the key sections of code that most of the code in this book follows. The reader should consider studying these examples to start to learn the language. When the Arduino IDE is downloaded, there is a folder created titled examples. In this folder, there are many pieces of code that provide a lot of useful examples. Studying these and other examples allows a researcher to start gathering data and then analyzing it or using it later. This groundwork will aid the reader when they develop their own or any of the other remaining projects.