
This chapter explains several simple science and engineering projects that can provide data on some basic physical properties. These are good projects to explore science, engineering, the Arduino, and the Raspberry Pi. These projects can be useful too. The first project is a small-scale version of a key driving mechanism of how weather works. The second project highlights aspects of force and pressure including how distributing force over a different area changes the applied pressure. The final project is an automated tool to capture the number of events happening over time. This could be useful capturing scientific data, for example, examining the number of meteorites during a shower or the number of lightning strikes during a thunderstorm. These tools are great for measuring and observing key scientific concepts. Fortunately, the engineering skills and techniques needed to build these projects is relatively easy.
Buoyancy of Air
The first project will use two temperature sensors to track temperature change in two different elevations inside a house. It will demonstrate that hot air rises and the effect of buoyancy.
Buoyancy of heated air and using one form of the ideal gas law.
Using the Arduino or the Raspberry Pi and temperature sensors to collect data, to test methods, and to improve temperature distribution in a house.
This section explores the mathematics associated with density changes of air as a function of temperature. As air heats up and energy is added, the density decreases, and it will float on the colder denser air. If it is cooled, it will sink.
P = Pressure
ρ = Density
T= Temperature
R = Specific gas constant
ρ = P/(R × T)
As can be seen in the preceding equation, if the temperature (T) increases and the pressure is held close to constant, then the density will decrease which causes the warmer gas to rise. On a larger scale, the sun warms the Earth’s atmosphere, which causes a large mass of air density to decrease. This movement may result in winds and breezes. Enough of a temperature change and the pressure may decrease which will cause more wind flowing from high-pressure areas to low-pressure areas.
Arduino Buoyancy of Air Version
This project is similar to the Arduino project in Chapter 2; however, it uses libraries and the I2C temperature sensor used in the Raspberry Pi data logging project. The code is a little more complex and uses libraries which are ready-to-use packages of code that are called up when needed. These significantly simplify the code needed. The user will need to download the required libraries onto their computer in the library folder.
Arduino Uno 3
2 DS18B20 waterproof temperature sensors
4.7K Ω resistor
Miscellaneous wires, proto-board, and terminal strips
One piece of wood to mount the components on

Arduino and Two I2C Temperatures Sensors

Two Temperature Sensors

Arduino and Two One-Wire Temperature Sensors
This code was originally found at this web site:
It requires these libraries to b downloaded: One Wire and Dallas Temperature. If you are not familiar with Arduino libraries, then this site has a lot of good info:
www.arduino.cc/en/guide/libraries
SN103 Dual I2C Temp Sensors code
The comments in Listing 4-1 (which are either after two // or between /* and */ ) provide good explanation of what the code is doing. When these are in place, the code knows to skip over them and not execute them.
Arduino SN103_Two Sensors 1 Wire Code
Temp 0 is 20 inches (0.5 m) from the ceiling.
Temp 1 is about 24 inches (0.6 m) from the floor.
The room is 8 feet high (2.4 m).
The distance between the sensors is 2.4 – (0.5 +0.6) = 1.3 m.
This is SN103
Requesting temperatures...13:18:33.593 -> DONE
13:18:33.593 -> Temperature0 is: 24.87
13:18:33.640 -> Temperature1 is: 24.19
13:18:43.696 -> Requesting temperatures...DONE
13:18:44.446 -> Temperature0 is: 24.81
13:18:44.446 -> Temperature1 is: 24.19
13:18:54.501 -> Requesting temperatures...DONE
13:18:55.276 -> Temperature0 is: 24.69
13:18:55.276 -> Temperature1 is: 24.19
13:19:05.331 -> Requesting temperatures...DONE
13:19:06.081 -> Temperature0 is: 24.56
13:19:06.128 -> Temperature1 is: 24.19
13:19:16.183 -> Requesting temperatures...DONE
13:19:16.932 -> Temperature0 is: 24.50
13:19:16.932 -> Temperature1 is: 24.12
13:19:26.996 -> Requesting temperatures...DONE
13:19:27.746 -> Temperature0 is: 24.37
13:19:27.793 -> Temperature1 is: 24.12
13:19:37.803 -> Requesting temperatures...DONE
13:19:38.553 -> Temperature0 is: 24.31
13:19:38.600 -> Temperature1 is: 24.12
13:19:48.633 -> Requesting temperatures...DONE
13:19:49.383 -> Temperature0 is: 24.25
13:19:49.430 -> Temperature1 is: 24.19
13:19:59.475 -> Requesting temperatures...DONE
13:20:00.213 -> Temperature0 is: 24.25
13:20:00.260 -> Temperature1 is: 24.12
13:20:10.320 -> Requesting temperatures...DONE
13:20:11.069 -> Temperature0 is: 24.19
13:20:11.069 -> Temperature1 is: 24.19
Calculation of density and summary of the data:
ρ = P/(R × T)
The starting Temperature0 of 24.87 oC is 298.02 oK.
The starting Temperature1 of 24.19 oC is 297.34 oK.
The specific gas constant for dry air is 287.058 J/(kg·K) in SI unit
or 8.314462618 m3·Pa·K−1·mol−1.
Calculating the density and assuming a constant volume At 20 °C and 101.325 kPa pressure at the two temperatures yields the results below:
Density at T0 = P/(R x T) = 101325/(8.314462618 x 298.02) =
40.89.
Density at T1 = P/(R x T) = 101325/(8.314462618 x 297.34) =
40.99.
The preceding calculations show that at T0 the air is approximately 0.24% less dense than at T1; therefore, that piece of air will rise and float on top of the colder dense air. Once the air conditioner blows the air around, it pushes colder air down, but eventually there is enough mixing that the temperature between the two locations mixes and evens out.
Raspberry Pi Buoyancy of Air Version
This project uses the Raspberry Pi and the LM35 temperature sensor to also capture the temperature difference at two heights in a house. One other item that is needed is an analog to digital converter (ADC). This is needed because the LM35 sensor is an analog device, but the Raspberry Pi only accepts digital inputs.
Raspberry Pi 3
MCM 40-pin GPIO breakout board and cable for Raspberry Pi (or equivalent)
2 LM35 sensors that are connected to a wire harness (see Appendix)
MCP3008 analog to digital converter (ADC)
Miscellaneous wires, proto-board, and terminal strips
The authors found a lot of confusing information online regarding the use of the Raspberry Pi and the MCP3008 ADC. They found the following code which works well as long as its SPI configuration matches the pins on the Raspberry Pi. One of the confusing aspects in the documentation on the Internet regarding connecting to the ADC is the connections to GPIO. There are four key connections and multiple designations. The first one is pin number 23. This is also designated GPIO11 and the SPI SCLK clock connection. The next key connection is pin 24, and its other designations are GPIO8 and SPI CE0 or chip enable. Another key connection is pin number 19, also designated GPIO10 or SPI MOSI. The final key connection is pin number 21, also designated GPIO9 or SPI MISO . Keeping these key connections in mind and understanding the multiple designations will help to ensure the reader will get this powerful tool connected and running. The MCP3008 ADC can accept up to eight sensor inputs.

Raspberry Pi Setup to Measure Air Temperature

LM35 Sensor Assemblies
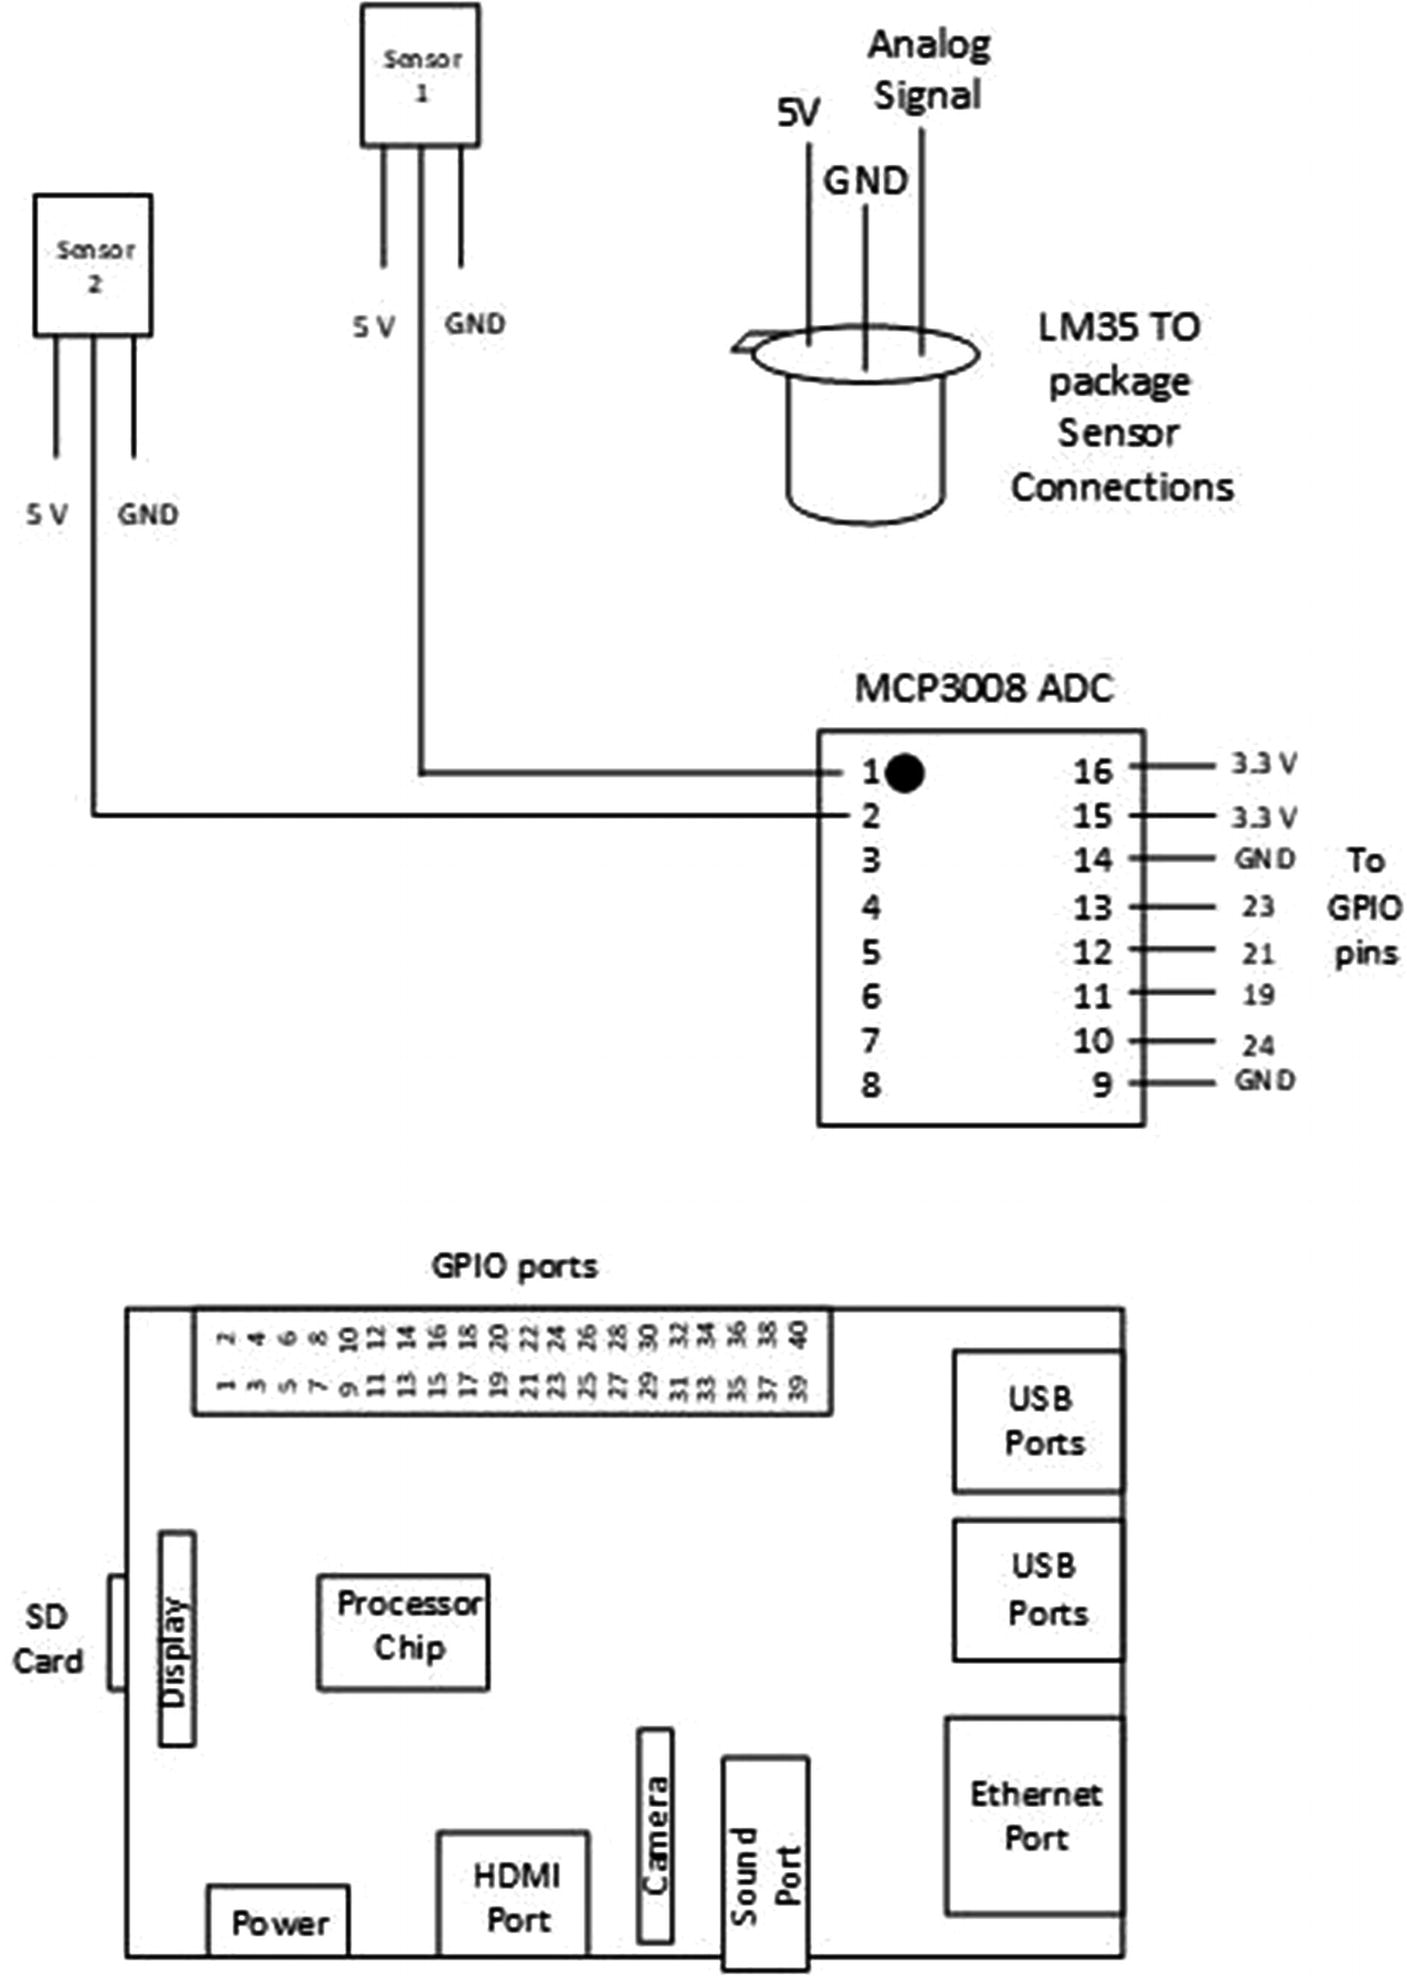
Raspberry Pi, A to D Converter, and Two LM35 Sensors
The basis for this code (Listing 4-2) was found on this Raspberry Pi web site. There is a bit of discussion regarding A to D converters that the reader might find helpful:
www.raspberrypi.org/forums/viewtopic.php?t=221972
The five lines of bold code below are each on one line in the program:
Raspberry Pi Code PI_SN002A Two Analog Temperature Sensors
The Raspberry Pi version provides another way to gather data to observe and monitor buoyancy of air, temperature changes, and how well the air mixes when the air conditioning is turned on.
Buoyancy Recap
These two projects explore ways of demonstrating and capturing buoyancy of air data and provide a way to track temperatures in two different heights in a room. This can be utilized to observe how air mixes and evens out the temperature when an air conditioner or fan is running. Additionally, it may be helpful assessing the benefits of ceiling fans and other ways to improve a home’s environment.
Demonstrating Pressure
This next project will help to clear up some of the confusion that may exist between force and pressure. They are related, and the mathematics showing this relationship will be demonstrated. The system in this project uses a force sensor to demonstrate how to measure force and applied pressure on a force sensor. It also demonstrates the concept of distributing a load over different areas. This concept of changing loads by changing the area is key to many civil and mechanical engineering problems.
Gain an understanding of the difference between the principles of pressure and force.
Using the Arduino and a force sensor.
Converting the sensor voltage reading to pressure based on the sensor’s calibration.
Arduino Uno 3
Square force sensor resistor (Adafruit or SparkFun)
10K Ω resistor
Miscellaneous wires, proto-board, and terminal strips
Several pieces of wood and a stack of ten pennies (or other coins)
Adafruit has a very good description of how this force sensor works along with a calibration curve showing where it is linear and indicating where it is not. The discussion on this site is that the force sensor is not an accurate device; however, it can be used to gain insight from relative force comparisons, in other words, comparing one measurement to another.
The Appendix section shows the technique needed to solder the wires to the force sensor.

Measuring Force with Arduino

Schematic of Force Measurement
- 1.
The first step of the program is to set up the variables.
- 2.
The program sets up the serial port communication rate.
- 3.
The program runs a repeating loop that cleans registers and then gets new data.
- 4.
The Arduino sends data to the serial port on the computer.
Listing 4-3 is the code, and it reads the data from the sensor and then sends it over the serial line to the computer.
The follwoing bold line of code needs to be on one line in the IDE:
Arduino SN104_Basic Force Sensor Code
For those who want to modify and improve the code, the following is an example of how you might convert the direct reading from the sensor to pressure. The factors and size of the interface may need to be adjusted based on what the researcher uses. This code uses the double function which is needed when the Arduino is doing detailed calculations.
This modified code (Listing 4-4) converts the output to a pressure reading of pounds per square inch.
The code that is bold below is on one line and should not overwrap when typed into the IDE.
Arduino Code SN104B Force Sensor Pressure Calculation
Analysis of the Data from Force Sensor Measurements
Test | Side of Area Interface (inches) | Area (square inches) | Average Voltage Reading | ¼ of Voltage Reading |
|---|---|---|---|---|
1 | 1 | 1 | 44.8 | N/A |
2 | 0.5 | 0.25 | 159.5 | 40 |
3 | 0.25 | 0.0625 | 327.75 | 82 |
For example, use Test 1 as the basis for comparison. The Test 2 area is ¼ of Test 1 (4 × 0.25 = 1). So the same force is pushing on ¼ the area, and the sensor would see four times the force. If we divide the reading of Test 2 by 4, we get very close to the Test 1 reading. This is in the last column of Table 4-1. For Test 3, the relationship breaks down; this may have to do with the sensitivity of the sensor for this small area.
Pressure/Force Recap
This project demonstrates and clarifies the difference between pressure and force. It demonstrates a very important concept showing how the applied load can be reduced by changing the area where the force interacts.
Capturing Counts
Scientists often need to count occurrences of events and compare them between different hypotheses. This project will show how to capture very fast events and count them to monitor the number of occurrences. Some examples might be meteorites or lightning strikes. When things happen very fast and there is not enough time to mark down an event on paper, this project allows the reader to just push a button and record these events.
If there is a need to count events to understand probability and likelihood of scientific data.
Using the Arduino and a pushbutton switch.
Aspects of statistics can be utilized to understand likelihood of data of event occurrence.
Arduino Uno 3
Pushbutton switch
10K Ω resistor
Miscellaneous wires, proto-board, and terminal strips
Old-style 35 mm file canister to hold the remote switch

Using the Arduino to Capture Count of Events

Schematic of Arduino Counting Events
Arduino SN105 Capturing Counts Code

Screen Capture of Data from Arduino Count of Events
Example Capturing Count Data
Cars Speeding | ||
|---|---|---|
Day of the Week | 9–10 AM | 7–8 PM |
Mon | 11 | 5 |
Tues | 8 | 3 |
Wed | 5 | 6 |
Thrs | 12 | 2 |
Fri | 14 | 8 |
Avg | 10 | 4.8 |
Std Dev | 4.85 | 2.64 |
The preceding data indicates a very high standard deviation, so we may need more data to see if there is a better correlation or it may just vary that high and be somewhat unpredictable.
Counts Recap
This tool can be used to capture several different types of events. If the switch is not the best input device, there are other types of sensors like infrared sensors that could be used to track fast events. The data can then be analyzed using statistics of event occurrence, and this type of analysis is key to many scientific studies.
Summary
The projects in this chapter provide tools to measure and analyze some key scientific parameters. These include air temperature buoyancy which is a primary driver in the weather of the world. The next project shows how to measure pressure and how area impacts this value given the same force. This is key to distributing load and a very important factor in many engineering projects. Finally, the last project provides a tool to quickly capture event occurrence and can be used to accurately obtain the number of events of interest for statistical analysis.