
Foundations for Health Care Institutions’ Design
This chapter is dedicated to present the ideas of leading authors on how to solve the problems the health system has all over the world, summarized in the second section of this chapter, and our proposal to design health services in trying to solve such problems, which was introduced in Chapter 1. Our approach is based on the ideas of Business Engineering, which emphasize competitiveness; so we start by reviewing the basis for making health services more competitive that various authors have proposed; then our proposal is presented.
Summary of Relevant Disciplines
As already mentioned, there are several disciplines that provide a foundation for the design methodology we propose. We present a brief review of the most relevant ones here.
Strategy
The work of Porter1 and Hax and Wilde2 on Strategy provides the starting point for Business Design, as shown in Figure 1.1. The key ideas adopted are:
Porter’s concept of Competitive Advantage is the key for obtaining a position that differentiates a business. He proposes to choose—in our terminology design—a set, or architecture, of different activities—in our terminology processes—that gives a unique mixture of value to the client. It relates to Business Design to perform its activities in a different form or to develop different activities other than the competitors’. For example, the way in which eBay offered auctions over the Internet differentiated it from its competitors.
Hax and Wilde’s proposal that defines three basic positioning strategies for a business to generate customer bonding and hence Competitive Advantage:
(a)
Best product means developing unique attributes for a business’ products that attract clients’ preferences, such as the unique features Apple intends to provide for them, or good quality at a low price as Walmart does for theirs; another good example of this strategy is by Zara, the second world-level manufacturer and distributor of fashionable clothes, which bases its positioning on novel products at reasonable cost and their fast renovation, together with one of the best logistics in the industry that allows the fast launching to the market and replenishment of products.3
(b)
Integral solution to clients implies understanding their needs in such a way that customized solutions can be offered; its final aim is for the offering organization to get placed into the Value Chain of the client, taking activities from such a chain for which it has top competences, as FedEx does for the complete delivery logistics for some of its clients4 and Amazon that provides full Internet selling solutions for their business clients.
(c)
Systemic lock-in is based on the economic theory of switching costs and network externalities. It attempts to create conditions that make it very expensive and almost impossible for a client to make do without the services of an offering organization (lock-in), by creating an extended company that includes all the clients and the complementors, who develop value-add products and a portfolio of services they offer to the clients. The emblematic case of systemic lock-in is Microsoft, which has positioned Windows as a de facto standard, incorporating a great number of complementors to the system that produce a large offering of software that run only on this operating system. Candidates of the same status are Google and Apple iTunes.
After choosing a strategic positioning, among the options presented, we propose that an organization should design its Business Model, processes, and supporting IT applications in such a way that they materialize and make operational the Strategy. Without a disciplined design, like the one we propose in Businesses Engineering, it is difficult to be able to guarantee the success of a Strategy, which means a significant change in the way a business is performed.
Business Model
Also relevant are the ideas of Business Model proposed by several authors5 that provide key inputs for Business Design. The basic concept of having a good strategy is not sufficient; it is necessary to design a Business Model, as stated earlier, which put strategy into practice and the processes that make it operative. This is how FedEx changed its positioning strategy from package mover to supplier of logistic solutions, which meant a substantial change in its Business Model, offering to its clients the possibility of handling an important part of their distribution logistics, using its own processes and IT applications.6
To make the concept of Business Model more precise, the ideas of Johnson et al.7 are adopted, which define it as a logical history that explains who the clients of an organization are, what they value, and how a positive economic result will be generated through providing such value.
The idea is to materialize a strategic approach in a plausible Business Model. Such a model should include solid foundation assumptions with respect to the customers and what they value, resulting in economic outcomes provided with an adequate justification. These should be reflected in a rigorous economic evaluation.
An example of a good Business Model is eBay, a company that started with the assumption that there were numerous customers who wanted to obtain goods by means of auctions, but did not have access to them or it was inefficient for them to resort to such type of service offering. Such clients would prefer to be users of a simple system at low cost, running fully on Internet, which would allow them to bid for goods of any type following the auction model. These clients would value, in addition to the transaction possibilities, avoiding to physically moving, assuring the payment to the seller, simple procedures of participation and a low cost. They would be willing to pay a percentage of the value of the transaction, generating the income that makes the business viable. In addition, the costs would be low, since the Business Model of eBay did not imply getting directly involved neither in the physical handling of the goods nor in the associate financial handling, which could be handled by a courier and available means of payments. Therefore, the Business Model not only seemed attractive, but also economically sustainable; this has been actually demonstrated with the great success of this company. Notice that the Business Model determines the required processes and structure.
A case similar to eBay is Google, which discovered a value associated with the searches on Internet and a great mass of clients who required it. Google assumed correctly that the users, in this case, were not willing to pay for the service and that the key was to create a great community from which this company could extract value with other products. One of these products was advertising, which, in varied forms, provides income to Google, which has turned it into one of the most successful companies of the world, besides generating a lock-in effect.
Another interesting example of Business Model is of Grupo Multiasistencia, which operates in Spain, France, and Portugal. This organization offers services that allow coordinating repairs of houses, including the ones that occur from events covered with insurance policies. Multiasistencia allows that several companies, in particular insurance organizations, and individuals who need this type of service, sign up by means of the Internet to its network. Subsequently the demand for services of repair work is processed and assigned to a set of outsourced professionals who execute the repairs. Furthermore, their services coordinate the successful execution and the invoicing of the repairs, payment collection, and the fees to the professionals.8
One impressive Business Model at the moment is of Apple that, for example, made the downloading of music by means of Internet easy and convenient; it combines hardware, software, and a 24-hour service that are implemented with the collaboration of the music suppliers. With the iPad, the model has become generalized to provide all types of applications developed by complementors. This has made Apple one of the companies of highest market value in the world and put it on the road to systemic lock-in.
A Business Model, according to Johnson et al.9 besides specifying value for clients, should establish the other factors that are briefly described as follows.
The Value Proposal to the objective clients is related to the work needed to solve an important problem or to satisfy a key necessity of such clients; this determines an offer that solves the problem or satisfies the necessity. This is determined not only for what it is sold but also for how it is sold.
The Profit Formula relates to: (a) the model of income, that is, how much money can be earned, which is determined by size of market, frequency of purchase, and others; (b) the cost structure that is determined by how the costs are assigned, including costs of key assets, direct costs, indirect costs, and economies of scale; (c) the margin model or the difference between income and cost of each transaction so as to arrive at the desired level of profits; and (d) the rate of use of resources, or how rapidly the resources are used to obtain the desired volume, which includes times of delivery, speed of production, rotation of inventory, use of assets, and similar.
The Key Resources are the ones necessary to profitably give the client the value proposal; they may include human resources, technology, equipment, information, channels, partnerships, alliances brands, and licenses.
The Key Processes include metrics, rules, and norms that make the delivery of the value proposal profitable and, also, repeatable and scalable. It may include: (a) processes such as product design, development, supplying, manufacture, marketing, hiring and training, and IT; (b) rules and metrics, such as requirements for return for investments, credit rules, times of delivery, and conditions for suppliers; and (c) norms, that is, policies for the channels and clients.
Osterwalder and Pigneur proposed another methodology for Business Model development,10 which shares many characteristics with the Johnson et al. proposal. The main difference is that it provides a canvas or table that summarizes all the variables that define a Business Model. It can be used as a design tool by systematically assigning characteristics to the variables in the canvas, thus defining the way the Business Model is to be structured. Osterwalder and Pigneur and Johnson et al. concur on most of the variables that define a Business Model and only differ on how to structure and present them. We conclude that they are equivalent and, in what follows, we opt for the proposal of Johnson et al., as it is more easy to use.
Business Intelligence
Business Intelligence (BI) is, in our approach, the application of Analytics, which is defined later, to business design and management. Davenport is the champion of the idea of using Analytics in better managing businesses: As early as 2005, he and others11 proposed a “new form of competition based on the extensive use of Analytics, data, and fact-based decision making. The Analytics—quantitative or statistical models to analyze business problems—may be applied to a variety of situations, including customer management, supply chains, and financial performance.” In a follow-up paper in HBR and a book,12 he elaborated on the subject; in summary, he stated that well-known companies base their success on the use of Analytics and this is a good practice to be followed. He distinguishes the following types of Analytics in order from moderately complex to very complex:
Statistical analysis, such as regression and factorial analysis
Forecasting/Extrapolation, such as times series models and Neural Networks
Predictive models, such as Data and Web-Mining models
Optimization models, such as Discrete Linear Programming (LP) and Stochastic models
These analytical techniques are to be clearly distinguished from the more basic, so-called BI tools, which essentially consist of facilities for access and reporting from data by means of information dashboards.13 Advanced Analytics provides truly BI that generates insights on the state of the business and predictive or prescriptive Capabilities to support optimal or close to optimal actions. For example, Walmart uses online data from all the sales points to feed predictive models that forecast demand for each of such points, which are used by optimization models that determine actions over the supply chain logistics to assure product availability at minimum distribution cost; currently, they are also using social media data to predict shoppers’ purchases and act on that basis to plan logistics.
In this work, we consider Analytics of two types: data based, oriented to predictive models, which includes traditional Statistics and Econometrics, Data Mining, Web Mining, and Process Mining14 and Operations Research and Management Science, which make possible prescriptive models, with techniques such as optimization models, both linear and discrete, heuristics, probabilistic models, simulation models, knowledge extraction and characterization models, and many others. These types of Analytics can be further classified as follows:15
Analytics 1.0 based on assembling internal data oriented to reporting, which can be enhanced by visualization tools. Emphasis in this level is on integrating, structuring, and using the data to generate information on the state of the processes to allow fact-based, improved, and fast decision making. Front-end tools, such as visualization software based on dashboard reporting, are used; also integration tools that allow data preparation, built-in querying on an analytical database and descriptive Analytics—complex graphical analysis—are options.
Analytics 2.0 ads, in relation to the previous level, big data. This is fast moving, external, large, and unstructured data coming from external sources, including social media, which is stored and processed rapidly using new technology like parallel servers and Hadoop. Visual Analytics, a form of descriptive Analytics, is introduced. Emphasis is on real-time operations analytic solutions to make organizations more agile and proactive. Main idea is that there is a wealth of data that, adequately used, can generate great value for them. For example, McKinsey16 has calculated in 60 percent the potential increase in retailers’ operating margin by better using big data. It has also estimated in $300 thousand millions the potential value for the U.S. health care by the right use of patients’ data. As to impact on the bottom line, McAffe and Brynjollfson17 have found that companies in the top third of their industries in the use of data-driven decision making are, on the average, 5 percent more productive and 6 percent more profitable than their competitors. As an example of these possibilities we have the case of Ommeo, a division of Siemens that delivers millions of electronic devices and other products throughout the world, which has developed a solution for supply chain product data management, including data from suppliers, equipment, field service, and repair operations.18 With this solution they provide suppliers, Ommeo operations and customers with an end-to-end, fast, holistic view of supply chain data. Using such solution, one customer has been able to to search 1.5 thousands million records in less than three second.
Analytics 3.0 complements the previous levels by incorporating predictive and prescriptive models in routine service production and management processes, which are based and operate on the internal and external big data. Aim is not only to drive operational and strategic decisions but also the creation of new product and services. Here true BI, as defined earlier, is performed to advise, recommend, and, in some cases, automate decisions and actions or both using the full range of analytical tools: Data Mining, optimization, Machine Learning, and the like. The example of Walmart given before is a good instance of this idea. Other real case examples are to use diabetes patients’ data, available in the whole health system, to develop predictive models to allow detecting probable crisis for a specific patient, before it occurs, to prevent serious health problems for him and high emergency treatment costs, a case to be presented in Chapter 6; and monitoring and collecting data on line for mining trucks, using available sensors, by a service company that sells them and also offers maintenance services, in order to develop models that predict failures just in time, allowing to take corrective actions that minimize down-time and maintenance costs.19 Also dynamic predictive models that use common company data and big data can help discovering new business possibilities with improved or new services and also allow designing and operating them as follows.
These types of Analytics will be included in different BI architectures that will be presented in a following section. The use of Analytics in our design proposal relates to providing business logic that supports intelligent business decision making and operations and also business development using well-founded designs. The central idea is that, in executing services delivery and related processes, business logic is necessary to formalize certain routines that use models to assure that certain objectives are attained. For example, one may want to assure that the right services are offered to clients in order to maximize sales, for which a customer behavior’s predictive model is needed. Or one may need to assure satisfaction of a certain service level to clients but trying to minimize costs, where a mathematical prescriptive model is required to optimally assign requests to facilities that process them. In both examples, the analytical tool—predictive model or prescriptive model—will be embedded in a business logic that specifies in a formal way how the process should be executed. In some cases, this logic will be fully automated as Amazon does for the logic that makes recommendations for clients or the logic that Walmart uses to optimize its logistics. In others, the logic will make recommendations to the person who operates the process and he will have the authority to follow them or not, as, for example, in prescriptive models that recommend medical actions on patients that we will present later. Also business development, improving current services and designing new ones, is possible by the right use of Analytics. A case we have developed, which exemplifies this possibility, is a distributor of heavy machinery to the mining industry, mentioned before, which, besides the current business of just selling equipment, wants to be able to offer added value services for equipment maintenance by means of a new Value Stream. These are based on online equipment monitoring, by means of remote sensors mounted in them, which feed state data to the service company systems allowing to generate corrective actions just in time, by means of predictive maintenance models; this case is similar to a General Electric business that offers the same services for the equipment it sells.20 Another case is a children’s hospital which has chronic patients with respiratory problems that need permanent monitoring, spending most of their time at the hospital using beads, which is a very scarce resource. So the challenge was to design a new service, with a new Value Stream, that provides a solution for keeping the children at their home with the proper attention that assures their well being, including online monitoring of medical variables—such as temperature, cardiac frequency, and respiratory frequency—and a diagnosis data-based analytical model to determine when the patient is in crisis and needs medical attention to advise care professionals; this case will be revisited in Chapters 3 and Chapters 6. These new Value Streams, when they execute externalized customers’ processes, produce a lock-in effect that makes it difficult for them to terminate the service. Different streams may execute different Business Models. For example, the hospital case has one Value Stream that executes a traditional hospitalization care, and another Value Stream that gives a proactive service to patients, which generates a high value for them.
We summarize some of the relevant Analytics for this book, which will be specifically used in some of the cases in Chapters 3 to Chapters 6, for the more technical reader who wants to get a feeling on how Analytics gets implemented. If one does not want to get into technical details, he can skip the rest of this section without loss of understanding of the cases.
Data-Based Analytics
The first type of model, which corresponds to some of the examples we gave previously in this section, is based on the model for Knowledge Discovery and Data Mining (KDD). A recent version of this model is Cross-Industry Standard Process for Data Mining (CRISP-DM).
One particular Data Mining modeling tool that will be used in one diabetes case we will present later is the clustering algorithm k-Means, which works as follows.
A clustering or Segmentation algorithm consists of finding groups between a set of individuals. The segmentation technique k-Means, which is a well-known algorithm for clustering and a simple and effective application, follows a procedure of classification of a set of objects in a certain given number of k clusters. It represents each one of clusters by the average (or weighted average) of its points or centroid. The representation by means of centroids has the advantage that it has an immediate graphical and statistical meaning. According to Lloyd, it is simple, efficient, and often results in the optimal solution.21
The mathematical formulation of the clustering problem is as follows:22 Given a set of observations (x1, x2,..., xn), where each observation is a d-dimensional real vector, k-Means clustering aims to partition the n observation into k sets (k ≤ n) S = {S1, S2,..., Sk }, so as to minimize the within-cluster sum of squares:
|
(2.1) |
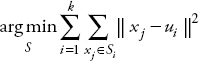
where μi the mean of points in ![]() .
.
Based on this formulation, the algorithm for clustering a set of objects (defined by a vector of observed data) Dn = (x1, x2,....xn) is as follows:
Stage 1: Choose k initial objects at random and assign each of them to one of the k clusters. For each cluster k, the initial value of the centroid is xi, the only object in it.
Stage 2: Reassign the objects of a cluster. For each object xi, assign it to the cluster that is closest to the object, according to a distance measurement (usually the Euclidian distance).
Stage 3: Once all the objects are placed in a cluster, recalculate the centroids of the k clusters.
Stage 4: Repeat Stages 2 and 3 until no more reassignments can be done.
Although the aforementioned algorithm always finishes, there is no guarantee of obtaining the optimal solution. In effect, the algorithm is very sensible to the random election of the k initial centers. Therefore, the k-Means algorithm is used numerous times on a same data set to try to diminish this effect, knowing that the most spaced initial centers give better results.
A clustering method is usually complemented with the technique of Decision Trees, in the particular version of Binary Decision Trees, which is considered a Classification method. The idea is to know which individuals within a segment have a similar behavior defined using known data on several variables that may explain such behavior. For a particular segment, the Decision Tree technique looks for “twins”; that is, clients who have a similar behavior defined by a variable that clearly generates groups that minimize the difference in the values of the variable for the clients inside a group. The technique of Binary Decision Trees uses division in two groups; so at the start, two branches are generated, one for each group. Then for each of these groups, two subgroups are defined using the same idea of minimizing differences for the values of another variable for clients within a subgroup, creating branches at a second level. And so on, each subgroup is again divided until all the variables for which data is available are included in the analysis. Clearly, this is a very simplified description; important aspects of the technique, such as how to select the order in which variables generates groups and to select the “best branches” to obtain better results, will be avoided.23 The important thing is that once a tree is built, rules that define clients’ behavior can be derived.
k-Means and binary Decision Trees are well-established techniques and are much used, which has been facilitated by its inclusion in popular analytical software packages such as SSSP,24 Rapid Miner,25 and Weka.26
A variant of data-based Analytics is what is called Process Intelligence.27 Its emphasis is in knowing the state of service production and establishing the performance of the overall flow for action generation to correct and improve the service. For this, data is systematically collected to analyze the individual steps within a production process or operational workflow and evaluate performance, such as:
Process compliance for well defined processes, which consists of verifying if process’steps comply with given sequence and times and informing nonconformities; for example, in credit processing inform that risk evaluation is taking more time than a desired level. Business Process Management Suits (BPMS) software28 allows to do this.
Process flow analysis to discover if there are avoidable delays, frequent avoidable repetition and bottlenecks that can be eliminated. Also overloaded paths and. exception paths, can be found to that need to be improved. These analyses can be done online and information provided to the process operator, based on a business logic that recommends actions such as, for example, avoid dangerous delays in a hospital’s emergency.
We will treat this type of Analytic as a particular case of Intelligence Structures that we will propose in the next section. A particular variant of this idea is Process Mining29 that does similar analysis as (ii) earlier, but with a different purpose, which is to discover opportunities for process redesign; it is based on complex algorithms, special software and requires historical data, so it is adequate for such purpose but it is not appropriate for online use.
Machine Learning30 is a generalization of the predictive methods in this section which has its roots in Artificial Intelligence, having media exposure with success cases as IBM’s Watson that has defeated the chess world champion and also the Jeopardy champion.31 It has also been increasingly incorporated in software products of common use that offers intelligent options such as predictive text, speech recognition, translation, and the like. Currently, it is becoming more available through products in the cloud, such as Microsoft’s Azure, IBM’s Watson Analytics, and Amazon’s Machine Learning. Some of these products include the common predictive Analytics—Classification, clustering, and regression—but also incorporate other methods such as text and social network analyses that discover sentiments, emotions, key words, entities, and high-level concepts; cognitive applications that understand content and context within text and images; personality insights discovery from transactional and social media data to identify psychological traits; and deep-learning Neural Networks.32 The common characteristic of these more advanced methods is that as much computational capability you give them, the better the result becomes because the results of previous Machine Learning exercises can be fed back into the algorithms. This means that each layer becomes a foundation for the next layer of Machine Learning, and the whole thing scales in a multiplicative way as time goes by. So there is continuous learning and results get even better.
Another class of analytical methods has to do with measuring the productivity and efficiency of a business in order to determine corrective actions to improve its performance. A particular, effective, and proven method for businesses that have replicated facilities or units, such as retail, banks, telecommunications, public health services, and the like, is Data Envelopment Analysis (DEA). This method is based on the idea that given data vectors of inputs and outputs for all the units, which represent well the value of the service provided and the costs incurred, including historical data about them, it is possible to calculate their comparative efficiency by solving an optimization model that determines their efficiency frontier. This is defined by the units that are comparatively most efficient according to the data. Then the units that are not in the frontier are not efficient and are candidates for improvement. DEA has analytical complements that make possible calculating potential improvements on outputs by manipulating certain inputs in a defined way.33 There are also techniques that allow establishing other variables, not considered in the efficiency measurements, which are related to efficiency and if adequately manipulated can improve nonefficient units; in particular variables associated to design considerations, such as unit location, size, mix of services, and the like. So this method is also valuable in generating configuration design ideas in some cases and evaluating them in terms of efficiency, thus complementing the methodology we will propose. We have applied this technique to 40 public hospitals and shown in practice that it allows to define in a very precise way how hospital services should change to improve their efficiency and also improvements in the EA of the public organization that manages them;34 we are also currently calculating the efficiency of academic departments at the Medical School of the University of Chile and finding similar opportunities as in the hospital case. Both cases will be presented in Chapter 3.
The other type of data-based Analytics we use in this book is forecasting models. Next we outline two types of models of this type found to be particularly useful: Neural Networks, which are the same as in the deep learning mentioned earlier, and Support Vector Regression (SVR).35
The particular type of Neural Network we consider is the Multilayer Perceptron (MLP). Its basic units are neurons that are grouped in layers and are connected by means of weighted links between two layers. Each neuron receives inputs from other neurons and generates a result that depends on only the information locally available and which serves as an input to other neurons, conforming a network.
The structure of the network consists of an output layer with one neuron that generates the desired forecast. The input layer contains the variables that we will use to explain demand, which will be determined subsequently. In the hidden layer, a number of neurons between input and output neurons are used; a high number of them will tend to copy the data (over fitting) and a small number will not generate good forecasts.36 The basic idea is that historical data predicts demand of a given future month. Regarding the network, several architectures can be tested with several parameters, such as the number of epochs to use, the learning rate, and the number of hidden neurons. The output layer contains simply one neuron that generates the forecasted demand in month N. The hidden layer contains a number of neurons that provides the model an adequate degree of freedom, usually calculated by: (Number of input neurons + Number of output neurons)/2.
We also present SVR 37 for demand forecasting. This technique performs a linear regression in a high-dimensional feature space generated by a kernel function as described later, using the ε-insensitive loss function proposed by Vapnik.38 It allows a tolerance degree to errors not greater than ε. The following description is based on the terminology used in Smola and Schölkopf.39
We start with a set of observed data ![]() , where each
, where each![]() belongs to the input space of the sample (data points) and has an associated target value
belongs to the input space of the sample (data points) and has an associated target value ![]() . We assume l to be the number of available data points to build a regression model. The SVR algorithm applies a function Φ,transforming the original data points from the initial input space
. We assume l to be the number of available data points to build a regression model. The SVR algorithm applies a function Φ,transforming the original data points from the initial input space ![]() to a generally higher-dimensional feature space
to a generally higher-dimensional feature space ![]() . In this new space, a linear model f is constructed, which represents a nonlinear model in the original space:
. In this new space, a linear model f is constructed, which represents a nonlinear model in the original space:
|
(2.2) |
|
(2.3) |
In Equation 2.3, ![]() denotes the dot product in
denotes the dot product in ![]() . When the identity function is used, that is,
. When the identity function is used, that is, ![]() , no transformation is carried out and linear SVR models are obtained. The goal when using the ε-insensitive loss function is to find a function f that fits given training data with a deviation less or equal to ε and, at the same time, is as flat as possible in order to reduce model complexity. This means that one seeks a small weight vector ω. One way to ensure this is by minimizing the norm
, no transformation is carried out and linear SVR models are obtained. The goal when using the ε-insensitive loss function is to find a function f that fits given training data with a deviation less or equal to ε and, at the same time, is as flat as possible in order to reduce model complexity. This means that one seeks a small weight vector ω. One way to ensure this is by minimizing the norm ![]() 2 leading to the following optimization problem:
2 leading to the following optimization problem:
|
(2.4) |
|
(2.5) |
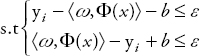
This problem could be infeasible. Therefore, slack variables ![]() , are introduced to allow error levels greater than ε, arriving at the formulation in Equations 2.6 to 2.9.
, are introduced to allow error levels greater than ε, arriving at the formulation in Equations 2.6 to 2.9.
|
(2.6) |
|
(2.7) |
|
(2.8) |
|
(2.9) |
This is known as the primal problem of the SVR algorithm. The objective function takes into account the generalization ability and accuracy in the training set, and embodies the structural risk minimization principle.40 Parameter C > 0 determines the trade-off between generalization ability and accuracy in the training data, and the value up to which deviations larger than ε are accepted. The ε-intensive loss function ![]() has been defined as in Equation 2.10.
has been defined as in Equation 2.10.
|
(2.10) |
It is more convenient to represent the optimization Problems (6) to (9) in its dual form. For this purpose, a Lagrange function is constructed and, once applying saddle point conditions, the dual problem is converted to a quadratic optimization problem that is easier to solve, which is the one that provides the estimation of f (x). The accuracy of the estimation depends on an appropriate setting of parameters C, ε, and others.41 So the use of grid-search to find good parameters for SVR can be applied to test combinations of such parameters.
SVR has been also integrated in software packages such as Rapid Miner, mentioned earlier.
Assignment Optimization Models
Another popular structure of optimization is the Assignment problem. In its simplest form, the objective is to assign n tasks to m agents so that each task has only one assignment and each agent gets only one task, assuming n = m, and that the sum of the assignment costs is minimized. We have solved versions of this problem in assigning technicians to customer requests in telecommunication companies, IT specialists to software projects and for the assignment of operating rooms (ORs) to medical specialties in a hospital. The simplest mathematical formulation for this problem is the LP model:
Minimize:
![]()
Subject to the constraints:
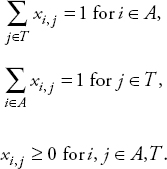
The variable x i,j represents the assignment of the agent i to task j, taking value 1 if the assignment is done and 0 otherwise. This formulation allows also fractional variable values, but there is always an optimal solution where the variables take integer values, since the first constraint requires that every agent is assigned to exactly one task, and the second constraint requires that every task is assigned exactly one agent. A and T are sets of equal size that contain agents and task. This version can be easily solved with a standard LP algorithm and also very effective heuristics have been proposed as the Hungarian one.42
For more realistic versions of this problem, there are complications such as tasks have execution times and several tasks may be assigned to an agent; agents have a defined capacity available; and the cost structure can be more complex, for example, with multiple objectives. In such cases, the model must be discrete to assure that the assignment of tasks is exclusive, and several more constraints, to take care of the complications outlined earlier, may emerge. Besides these complexities, it is our experience that these types of optimization models can be solved with standard software for discrete problems. However, in some cases, heuristics can be applied, such as Tabu search.43
The next problem is also very common in practice; this is the Job Shop Scheduling, which can be described as follows. Let ![]() and
and ![]() be defined as two finite sets. In an industrial context, the problem is proposed as m machines and n jobs to be scheduled on them. Furthermore, X denotes a set of sequential assignments of jobs to machines, such that each job is done just one time;
be defined as two finite sets. In an industrial context, the problem is proposed as m machines and n jobs to be scheduled on them. Furthermore, X denotes a set of sequential assignments of jobs to machines, such that each job is done just one time; ![]() can be describe as a
can be describe as a ![]() matrix, where a column i shows the jobs that a Mi machine will perform in order, for example:
matrix, where a column i shows the jobs that a Mi machine will perform in order, for example:

The matrix indicates that the M1 machine will perform three jobs J 1, J 2, J 3 in the order J 1, J 2, J 3, while the M2 machine will execute the jobs in the sequence J 2, J 3, J 1. Also, the cost function ![]() is defined, which is interpreted as the “total cost of processing” and it can be an expression that represents the cost due to the time the machine Mi takes in doing the job Jj . The Job Shop problem corresponds to finding an assignment of jobs
is defined, which is interpreted as the “total cost of processing” and it can be an expression that represents the cost due to the time the machine Mi takes in doing the job Jj . The Job Shop problem corresponds to finding an assignment of jobs ![]() such that C(x) is minimum. It can be solved using several types of algorithms or techniques; the most popular are branching and pruning, Tabu search, genetic algorithms, and search in directed graphs.44
such that C(x) is minimum. It can be solved using several types of algorithms or techniques; the most popular are branching and pruning, Tabu search, genetic algorithms, and search in directed graphs.44
A complex version of this problem is the hospital OR scheduling application we will present in Chapter 6, where, among others, jobs (operations on patients) have an execution time, the cost structure is multi objective and there several other constraints.
Process Modeling
The idea behind process modeling is to design an organization with formal graphical models that allow representing the options of business and process structures that put into practice a Strategy and associated Business Model. Moreover, for each process of the structure or architecture (EA), we want to generate models, also formal, that represent the design of the components of such process. For this we use the Business Process Management Notation (BPMN),45 which is supported as a standard by the Object Management Group (OMG),46 which allows detailing activities, the flow, and the logic of a process.
In a nutshell, BPMN is a formal notation that provides many constructs to build process models; here we summarize the more basic ones. BPMN has a set of three core elements of the Flow Objects, as follows:
Event, which is represented by a circle; it is something that “happens” during the course of a business process. They affect the flow of the process and usually have a cause (trigger) or an impact (result). Events are circles with open centers to allow internal markers to differentiate different triggers or results. There are three types of Events, based on when they affect the flow—Start, Intermediate, and End, diagramed as follows:

Activity, which is represented by a rounded-corner rectangle and is a generic term for the work organizations perform. It can be atomic or nonatomic (compound). The types of activities are task and subprocess. The subprocess is distinguished by a small plus sign at the bottom center of the shape, as follows:

Gateway, which is represented by a diamond shape and is used to control the divergence and convergence of sequence flow. Thus, it will determine traditional decisions, as well as the forking, merging, and joining of paths. Internal markers will indicate the behavior of the flow of control, as follows:

The Flow Objects are connected together in a diagram to create the basic skeletal structure of a business process. There are three Connecting Objects that provide this function. These connectors are as follows:
Sequence Flow is represented by a solid line with a solid arrowhead and is used to show the order (the sequence) in which activities will be performed in a process:

Message Flow is represented by a dashed line with an open arrowhead and is used to show the flow of messages between two separate process participants (business entities or business roles) that send and receive them. In BPMN, two separate Pools, defined later, in the diagram will represent the two participants. The Message Flow graphical symbol is as follows:

Association is represented by a dotted line with a line arrowhead and is used to associate data, text, and other artifacts with Flow Objects. Associations are used to show the inputs and outputs of activities and are drawn as follows:
![]()
Many process modeling methodologies utilize the concept of “swim lanes” as a mechanism to organize activities into separate visual categories in order to illustrate different functional capabilities or responsibilities. BPMN supports swim lanes with two main constructs. They are as follows:
A Pool represents a participant in a process, usually at an aggregated level, such as a company, a division, or a department. It also acts as a container for partitioning the aggregate into smaller components, such as an individual, using lanes. Its representation is as follows:

A Lane is a subpartition within a Pool and will extend within the entire length of the Pool. Lanes are used to organize and categorize activities.

Examples of BPMN modeling that use Pool and Lanes to represent business designs at different detail levels will be presented in this chapter and the following ones.
In the models that will be used to support the design approach we propose, two modeling styles will be used.
The first style is a nonprocedural style that follows the ideas of IDEF0,47 but using a software tool to edit BPMN models.48 We summarize the conventions of IDEF0 to make this book more self-contained. This technique models processes, subprocesses, or activities by a box (rectangle with rounded corners); defines Inputs, which are supplies to them; Outputs, which are the product of the transformation that occurs within them; Controls, which are policies, rules, restrictions, or any other information that regulates the behavior of such processes, subprocesses, and activities; and Resources, which are the necessary elements for their realization. By convention, the inputs are represented by arrows entering from the left to the box; the outputs by arrows leaving to the right; Controls by arrows from above; and resources by arrows at the bottom.
BPMN has many elements of representation, some of which were summarized earlier, and we will use a few of them to implement the first style of process modeling that emphasizes the components involved and their relationships through flows of information. Because BPMN has a clear orientation to the stream and control logic, we must use creatively some of its elements to represent flows of information. So we will use BPMN boxes to represent processes, subprocesses, and activities, and one of the many varieties of arrows, the sequence one, to represent information flows. As stated earlier, a circle with a bold edge and an envelope in its interior represents a flow and associated event that is terminal within the diagram in question, which relates to a given destination in another diagram or outside the company; a similar circle, except for an edge without bold, represents an initial event and associated input flow; a simple circle and associated event initiates or terminates (bold) the process. These elements allow to link diagrams of different degree of detail, such as those generated in the scheme of hierarchical decomposition of IDEF0, which will be demonstrated in this and the following chapters.
At this stage, we will give a very simple use for Pools and Lanes. Pools, which are represented as separate tracks in the diagrams, are used to represent entities or different businesses running self-sufficient processes. Relationships between activities of different Pools are represented in BPMN as a special type of dotted lines called Message Flow. Given these adaptations of BPMN to represent high-level processes in our conception, it is not possible, in general, to directly use simulators or executable code generators, which are discussed later, associated with this language for this level of modeling, since the representation is asynchronous; in other words, there is no strict sequence and many things may be happening simultaneously. But these models can be easily converted to models executable with simulation software as shown by Barros et al. in a case of emergency patients processing in a hospital.49
The second style of modeling, detailing the first style models by progressive decomposition of higher-level elements (hierarchical decomposition), will be used when we get to the detailed design of processes, including the business logic associated with the computer support; for these we will adopt BPMN conventions in its conception of sequence and control logic, which leads to synchronism. Here we will define two substyles: one that does not intend simulation and implementation of processes by executing them and another allowing for this. The difference between these is the degree of formality of the representation, since, in the second case, strict conventions of BPMN that make feasible the simulation and execution must be respected. The advantage of this second variant is that, under certain conditions, the computing support to the process can be generated automatically, without the need for computational design or writing code. This is feasible because BPMN was designed to make graphic representations, which comply with certain conditions, to be converted to the conventions of software that can generate execution. These types of software, called Business Processes Managements Suites (BPMS), have proprietary complements to BPMN that make the execution feasible and provide the possibility of using web services, which contain logic that cannot be modeled with BPMN that interact with the suite. This type of technology is illustrated in Barros and Quezada50 and will be illustrated with the case of managing ambulatory patients in Chapter 6.
In summary, depending on the level of design, as defined in Chapter 1, in which we find ourselves within the modeling and design objectives that we pursue, we will use different styles of representation, which can be defined as consistent and complementary. But BPMN does not allow, as stated earlier, to design complex business logic that execute Analytics imbedded in the internal tasks of each activity, particularly those that provide automatic support to complex decisions in the form of algorithm or heuristics. Here, we have the opportunity to integrate the analytical techniques mentioned in the previous section by means of logic, which is encapsulated in computer programs that are called by the activities of the BPMN during the execution of the process by means of a technology such as web services.51
The union of the approach of structural design of business processes and analytical methods, made possible by the type of modeling just presented, generates the possibility of a new class of business design, which we will call intelligent solutions, to be presented as BI structures in this chapter. The differences in these solutions with the traditional approaches—which only improve the handlings of information in a process, as the Enterprise Resource Planning (ERP) packages typically do, or rationalize the processes, eliminating existing unnecessary activities or improving them with logics based on experience—are to approach thoroughly and rigorously the decisions that exist within a process. To support such decisions, Analytics is used as explained in the previous section. We have important accumulated experience of Analytics embedded within processes that has allowed us to incorporate it in the patterns used for such integration, which will be summarized in this chapter as Business, Architecture, and Process Patterns.
The hierarchical modeling approach based on BPMN allows managing the complexity inherent in integrating very different mental models and tools—problem that was outlined at the beginning of this chapter—since they are progressively introduced, as design goes from structural to detailed. Thus, for example, at the top of the modeling hierarchy, the conceptual models for Strategy determination, Business Model definition, Capabilities determination, and consequent Business Design are the most relevant. Subsequently, Business Design is made operational in Business and Process Architectures, modeled with the first modeling style with BPMN, based on patterns. As this architecture is decomposed with detailed design of its component processes, Analytics provide the tools that allow generating business logic, which assures that the innovations conceived at the structural level really produce the desired results. This results in BPMN designs modeled with the second style that has embedded business logic and appropriate Information System support allowing their execution. This hierarchical modeling approach is detailed later in this chapter and will be present in all the cases reported in Chapters 3 to Chapters 6.
Competitive Strategy and Business Model for Health Care Services
We start with the following question: What could be the principles of a Competitive Strategy and Business Model for health care services that provide a foundation for design?
Porter’s Proposal
One answer to previous question can be derived from Porter and Teisberg’s proposal to concentrate on what Porter calls Value-Based Health Care Delivery, which defines the core issue as the value of health delivered or the patient health outcomes per dollar spent.52 They believe that the fundamental issue in health care is value for patients, not access, volume, convenience, or cost containment, defining value as:
Value = Health outcomes/Costs of delivering the outcomes
Outcomes are the full set of patient health outcomes over the care cycle, and costs are the total costs of care for the patient’s condition, not just the cost of a single provider or a single service. Then the challenge is how to design a health care system that dramatically improves patient value. In doing so, several design variables can be manipulated; for example:
Prevention
Early detection
Right diagnosis
Right treatment to the right patient
Early and timely treatment
Treatment earlier in the causal chain of disease
Rapid cycle time of diagnosis and treatment
Less invasive treatment methods
Less care induced illness
The aforementioned ideas imply that people’ health should be monitored to determine preventive and effective actions required to avoid people getting seriously ill; by doing so, the need for expensive treatments to correct a situation that could have been avoided is eliminated. In this line of though, we developed a project for a large private medical clinic in Chile, where a Classification model, as in the idea of Data Mining, described in the previous volume, was developed for chronic diabetes patients to predict the risk of complications of their medical conditions. This allowed the definition of rules to generate preventive actions based on the clinical patient information and differentiated medical interventions. The model developed was able to successfully predict the crisis risk of chronic diabetes patients and the use of the model led to 6.4 percent reduction in the annual hospitalization for them,53 which was also detailed in previous volume.
Other ideas of Porter implicate that, when people get sick, more effective medical methods and processes should be used so that the treatments are the right ones at the right time, minimizing time for the patient and adverse consequences derived from the treatment.
Porter and Teisberg’s approach is clearly aligned with a Competitive Strategy of best product54 in the variant of developing unique attributes for a hospital’s services that interpret clients’ genuine needs and also partially cover the Strategy of integral solutions to clients, summarized in previous section, since a deeper knowledge of clients will allow to define customized services to them, as shown in the previous example of diabetes patients.
As for a Business Model, the value for clients is its emphasis on services that try to prevent people from falling sick, which means less risk of complications and less cost for society in general, and the value previously defined of minimizing the cost of the health outcomes.
Obviously, the aforementioned approach is not easy to implement since it requires massive and useful data about population health at the individual level. Also, it requires an important change in the medical practices that the profession is reluctant to accept. Hence, it is a model for the most progressive health services, as the one exemplified earlier.
Disruptive Innovation
Another radical proposal for redesigning health services proposed by Christensen et al. is that of Disruptive Innovation, in which the argument states that:55
In any industry, a Disruptive Innovation sneaks in from below. While the dominant players are focused on improving their products or services to the point where the average consumer doesn’t even know what she’s using (think over engineered computers), they miss simpler, more convenient, and less costly offerings initially designed to appeal to the low end of the market. Over time, the simpler offerings get better—so much better that they meet the needs of the vast majority of users. We’ve seen this happen recently in the telecommunications industry, where routers—initially dismissed by leading makers of the faster, more reliable circuit switches—came to take over the market.
They posit that this is exactly what is happening in the health services, where its development is geared to developing even more complex solutions for the few illnesses that present more challenges to the medical profession and professionals are trained to treat them. This implies that they are overqualified and too expensive to treat the larger numbers of patients who have much lesser needs, which means excessive costs—a problem that is evident in the health sector of the United States. Hence, their challenge is to develop Disruptive Innovations from below, from the simpler needs up, and give as examples the evolution of treatment of diabetes from complex blood laboratory analysis to present solution where patients pack miniature blood glucose meters with them wherever they go; they are able to manage most aspects of a disease that previously had required much more professional involvement. They also mention angioplasty as another example. Prior to the early 1980s, patients with coronary artery disease were treated through bypass surgery. It required a complex, technologically sophisticated surgical team, as well as multiple specialists in several disciplines, complicated equipment, days in the hospital, and weeks in recovery. The far simpler angioplasty uses a balloon to dilate narrowed arteries and is more effective and much less costly. So they conclude that these types of solutions should be emphasized, but the medical industry, which loses with cost reductions, has so far blocked the popularization of this approach. What solution do they propose? Match the clinicians’ skill level to the difficulty of the medical problem, for which they propose a hierarchy of medical problems, from simple to more complex, in the following way:
The lowest level of medical problems is the one where diagnostic and treatment can be rule-based, as it can be done with many infectious diseases.
The middle tier can be approached with diagnosis and treatment based on pattern recognition, as Type I diabetes can be detected with a pattern of symptoms and a relatively standardized treatment be applied.
The most complex disorders have to be diagnosed and treated with a problem-solving approach, which requires collective experience and judgment and implies executing cycles of testing, hypotheses, and experimentation.
Therefore, the conclusion is to orient the investments and efforts to initiatives that focus on the first two levels of the previous hierarchy with an emphasis on simplification as opposed to what occurs worldwide today. We will further pursue this idea on a case presented in the following section.
The Christensen et al. proposal is consistent with the best product positioning, in that it favors the generation of new products that are more adapted to peoples’ needs according to the level of complexity of their pathologies and also to operational effectiveness, since it tries to diminish costs for medical problems of complexity levels (1) and (2).
The Business Model behind this approach creates value for patients by providing the medical service that is just right for a given pathology, according to its level of complexity, avoiding overtreatment, with the health risks associated, and unnecessary costs.
Other Proposals
Recently a group of advisors to President Obama has proposed the idea of using Systems Engineering, in solving the U.S. health problem, defined as an interdisciplinary approach to analyze, design, manage, and measure a complex system with efforts to improve its efficiency, productivity, quality, safety, and other factors, including the full suite of tools and methods that can analyze a system, its elements, and connections between elements; assist with the design of policies and processes; and help manage operations to provide better quality and outcomes at lower cost.56 It is evident the alignment of this idea with the proposals we have made so far in this book, since our approach is not only systemic, using all the disciplines and techniques already presented, but provides a hierarchical design approach that allows managing design complexity.
Another theory that studies the structure of complex layered systems, as public health systems are, is flexibility and complexity.57 Such theory defines flexibility as the facility to make certain changes in a system, as, for example, changing its function. But flexibility may increase complexity, so the challenge is to design structures that are flexible but not too complex. In analyzing this problem, structure may use typical generic architectures: Tree, layered, and networks. Tree structures are hierarchies more centralized and inflexible than the others and layered are also centralized but more flexible. On the other hand networks are very flexible but complex. Public health is naturally layered, since there is usually a level of complex hospitals, another of intermediate services, and a third of primary care practices. Then an important question is how this layered structure can be managed to maintain flexibility but in a more decentralized way. We will encounter this problem when considering the managing the architecture of the public health system later in this chapter.
In other line, McKinsey has estimated in 300 billion dollars the potential value to the U.S. health system of using big data,58 using powerful IT and Analytics, in generating better service for patients that will save lives, increase live expectancy and reduce costs. Also a recent report estimates in 3 to 4 trillion dollars, at least a 17 percent of the GNP, the cost of health care in the United States, its efficiency being very low, since its ranks 50 in this item among 55 developed nations.59 So there a lot of potential of cost reduction by increasing efficiency, which is true for many other countries and, in particular, for Chile.
Our Proposal
On the basis of the experience with many projects in the private and public health sectors in Chile, we propose to concentrate on the following variables that define objectives to be pursued in improving health services:
Quality: The treatments must be appropriate to maximize the cure probability and must improve in time to increase such probability, especially for diseases that have a high rate of mortality.
Efficiency: Hospitals should maximize their production—measured according to clinical complexity, for example Diagnosis-Related Groups (DRG)60—using their resources in the best possible way.
Fairness: The patients must be taken care of according to their needs and, in the case of the Public Sector where the resources are always limited, in an order related to the associated risk of life of the pathology that affects them.
These objectives have something in common with Porter and Teisberg’s ideas, as quality is correlated with minimizing the cost of the health outcomes, because the search for an adequate treatment for each pathology contributes to generate good patients’ health outcomes; this, combined with efficiency, contributes to improve patient health outcomes per dollar spent. Furthermore, fairness implies giving patients the right treatment at the right time, avoiding waiting lists ordered by time of first diagnostic as it is the usual case in Chile, defining explicit priorities associated with the pathology and aggravating factors; this agrees with their idea of minimizing time for patients and the risk of adverse consequences. They are also related to the Christensen et al. proposal, since, in pursuing quality in the sense just defined, the complexity of the illnesses can be accounted for in finding the right cure. Moreover, the efficiency pushes in the direction of avoiding unnecessary treatments.
The objectives we propose are aligned with a best product positioning Strategy, including operational effectiveness (efficiency) and unique attributes due to quality and fairness.61
The Business Model62 behind such objectives generates value for patients in general by the way of better quality of treatment and, in the case of the Public Sector, fairness that prioritizes patients with a high risk of death, thus generating value for the people and society in terms of increased life expectancy. Value is also generated for customers who pay less for the medical services due to better efficiency that reduces costs and prices.
In what follows, we will consider only our approach, since most of our cases developed follow its ideas; however, when relevant, we will relate our ideas to the other proposals presented earlier. Given this, what are the Capabilities in health institutions needed to make operative the Competitive Strategy and Business Model of such an approach?
Capabilities are provided by the Intelligent Structures and Business Patterns (BPs) that are presented in the next section. Note that, besides proposing good foundations for the design of health services, we provide a mechanism to implement the Capabilities needed to put such principles into practice. This is our differentiation: We not only provide ideas, but also make them operational by means of predesigned structures of processes.
General Architectures for Health Services
Now that we are clear about general health Strategy and Business Model, including Capabilities involved, we provide general architectures for health systems that can serve as a framework of reference for health services design, including the necessary Capabilities within them.
As a part of the framework, Intelligence Structures and BPs are summarized, which were detailed in the previous book mentioned in the Prolog; then we present the general health architectures we propose.
Intelligence Structures and Business Patterns
Intelligence Structures
We now show how Analytics can be incorporated in alternative design structures that offer different complexity levels of techniques used, which can be applied when performing the design levels identified in Chapter 1.
The use of Analytics in our design proposal aims to providing business logic that supports intelligent business development and management. In order to formalize the options a service designer has in using Analytics, we propose Intelligence Structures that provide several levels with increasing complexity as follows. We start with a basic case, where business processes, which are structured as in the design levels of Chapter 1, have an IT system support providing nonintelligent information that just reports the state of the processes. Then we complement this structure with intelligent support that specifies how such processes, which are in routine execution, can be supported by Analytics and IT. The general structure we propose is summarized in Figure 2.1, where the intelligent support in introduced as a general component that can be implemented with four intelligence levels, summarized in the figure. Such levels are then detailed as four different structures that define how they can be implemented.
Now we give a summary of the structures for the different intelligence levels defined in Figure 2.1; more detail can be found in the previous volume mentioned in the Prolog.
Intelligence Structure I corresponds to the idea of developing and implementing simple business logic that, based on the state of the process, discovers the need for action and, possibly, recommends actions on process execution and management. Logic can be based on several ideas:
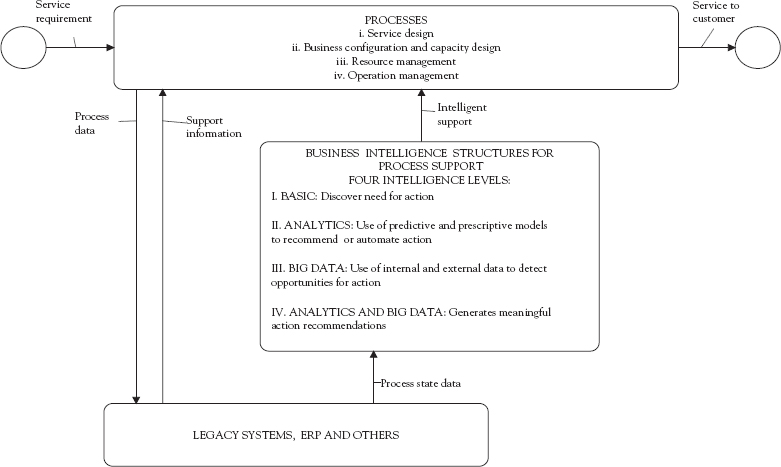
Figure 2.1 General Intelligence Structure
Simple rules based on experience and process metrics, which show that the process is not operating as expected; for example, waiting time before a step of the process that is not according to a service metric in patient treatment in a hospital emergency. There is BPMS software63 that allows to model and execute this type of processes, using BPMN, including metrics definition and their monitoring.
Formalization of expert knowledge based on semantic modeling and similar techniques; for example, formalization of medical criteria in an emergency triage to determine illness severity for a patient, which is applied with patient data using a computer program that recommends a priority for him. Similar cases to this are logic for surgical list prioritization and bed management as reported in Barros.64
Use of Balanced Scorecard65 and similar techniques that specify the expected results of a process, which compared with state data that gives actual results determine which parts of the process are not according to plan.
Intelligence Structure II uses predictive and optimization models allowing to make a well-founded recommendation on how to act on the process, including the possibility of influencing the customer, as presented in Figure 2.1. Barros66 presents several real cases that also use this structure including cardboard optimal production management, flight demand management in an airline, proactive sales management in an office equipment distributor, chronic disease management in a private clinic, preventive compliance checking of labor law infringements, sawmill optimal production planning, and management of a large workforce in a food distributor; it is also possible to have applications oriented to business developments, such as a real case of use of demand forecasting and simulation models to design an hospital’s emergency configuration and capacity.67 Other well-known cases of this type are Amazon and Walmart on predictive and optimization models use.
Intelligence Structure III builds on Intelligence Structure I by introducing big structured and unstructured data coming from different sources—web, cloud, contact center, sensors, social media, logs, Internet of Things (IoT), and the like—and sophisticated data manipulation and analysis technologies. Examples of such technologies are Hadoop for data storage, advanced multistructure data architecture and in memory databases; high definition models to discover patterns—for example, clicks patterns for customer buying on a commerce site—and find path to purchase, product affinity and shopping cart abandonment; and advanced visualization. Real cases of use of these technologies are a medical supplies company that uses sensors to monitor employees and products movements in a warehouse in order to determine what to do in real time to expedite shipments and make better use of resources; and a Telco that combines web usage with contact center interactions to identify important churn factors, resulting in the identification of hundreds of at-risk churn targets worth millions per year.68
Intelligence Structure IV uses Analytics, in advanced versions, over traditional data and big data to generate meaningful actions over the service processes (Levels i to iv), as shown in Figure 2.1. Actions may be generated by advising, recommending, and, in some cases, automating them by means of prescriptive models. Actions may be related to service delivery, service processes management and execution, service capacity adjustments, and new business development, including, for example, creating new Business Models, discovering new services offers, and monetizing data to external companies. The general objective in doing this is to provide business agility at different design levels. The Analytics involved in this include truly intelligent approaches, such as Web Mining, text mining, voice recognition and processing, image recognition, and Machine Learning. These are necessary to make sense of the big data coming from the web, social media, the cloud, mobile devices, IoT, and sensor data a company may collect; for example, the IoT data coming from sensors on trucks to determine their maintenance needs mentioned before. Cases using these ideas are:
Netflix, which has developed a movie “recommendation engine” based on customer behavior that relies on an algorithm that clusters movies, connects customer movie rankings to the clusters, evaluates ratings online, and considers current use web behavior to ensure a personalized web page for each user; it also has a testing culture for new business developments that uses surveys, website testing, concept development and testing, advertising testing, Data Mining, brand awareness studies, subscriber satisfaction, channel analysis, marketing mix optimization, segmentation research, and marketing material effectiveness. Machine Learning is behind the “recommendation engine” and other analyses.69
Walmart, besides historic use of demand prediction with its own data, has introduced mining of social media data to predict shoppers’ purchases and act on that basis to plan logistics, which is also optimized with mathematical models.70
Asthmapolis,71 an organization that gives services to asthmatic patients in the United States,72 was motivated by the fact that around 26 million people suffered from asthma in 2003 in this country. The annual cost of treating this condition was estimated at $50 billion for medical expenditure, plus a further $6 billion in additional indirect costs resulting from missed school and days off work. This considerable expense is to some degree due to the patients themselves, who do not follow their treatment procedures properly or are not in regular contact with their health care providers, who then lack feedback on how the treatment is going and under what conditions attacks continue to occur. It has been calculated that if patient treatment could be better monitored, 80 percent of all asthma-related hospitalization could be avoided, and that the mortality rate from asthma could be reduced by 20 percent. The technology that Asthmapolis has developed has several objectives, one of them being to help health care workers to treat their patients more effectively as a result of monitoring their treatment on an ongoing basis and collecting precise data on the environmental conditions under which patients use their inhalers. Aside from enabling patients to manage their own treatment more efficiently, the Asthmapolis system is also proving very useful for medical staff. It works with a small sensor attached to the patient’s inhaler linked to an IoS or Android mobile app and an online platform. Geolocation is integrated into the app, so medical practitioners have access to precise, detailed information on how their patients are using their inhalers. They can also monitor how the treatment is working. Doctors receive this information about their patients on an ongoing basis and can therefore work more closely with them. Moreover, the data collected can indicate those areas where asthma attacks most often occur, thus enabling health practitioners to warn their patients about any danger areas and sending them notifications, suggestions, and advice on the precautions they ought to be taking. Asthmapolis has also entered into a partnership with Qualcomm Life, so that those patients who do not own a smartphone can be alerted by standard phone call, SMS, or e-mail. A pilot study has shown that 60 percent of all patients who embarked on the project were not monitoring their own condition. After three months, 50 percent of these patients were able to track and manage their asthma condition proactively, while 70 percent of all participants in the study stepped up their overall self-monitoring activity.73
A Chilean children’s hospital decided to send chronic patients with respiratory problems to their homes to liberate beads. They had a monitoring process designed by the hospital but operated by children relatives, from which need for medical attention was determined. Then we developed a new design based on online monitoring of medical variables—such as temperature, cardiac frequency, and respiratory frequency—and a diagnosis data-based analytical model to determine when the patient is in crisis and needs medical attention. All this is supported by computing and telecommunications technologies that make the process effective. The new process, which will be elaborated in Chapters 3 and Chapters 6, is now under implementation at the hospital.
Business Patterns
Now we present the BPs that model different structures, using the various Intelligent Structures just presented, from which a business can select to have a first approximation to the Business Design. We give a summary, presenting more details for patterns relevant for health services design. A complete presentation of BPs is given in the previous volume.
For organizations that provide the services we intent to design we propose several BPs abstracted from experience. They show how the components of a service business can be structured in different configurations to generate a desired Capability. The need for such Capability is derived from a Strategy and Business Model and is related to some kind of innovation that an organization wants to perform in its business. Then the BPs will show the new business components that are necessary for particular Capabilities. The more relevant innovations in services relate to the more changing and dynamic demand for services. Moreover, demand, when occurs, is difficult to manage, since there are constraints for its programmed release to “production” that go from cases where demand cannot wait, as in hospital emergencies, to situations where Service Level Agreements (SLAs) must be met. So we need to determine creative ways to tackle such a type of complex demand. As the BPs show, some answers to this challenge are to track and monitor demand using Analytics to predict in advance customers needs; to continuously monitor service processes to know when they are not adequately processing demand and take corrective actions to fix them; and constantly evaluate the services performance to discover opportunities for improved or new services.
The proposed patterns emphasize the introduction of Analytics that will be embedded within the components of the management system, which implies innovation and redesign in the way the business is performed. Such patterns have been developed based on experience and knowledge generated by hundreds of projects; we summarize them here, highlighting the ones we consider have the most potential for innovation in health services.
One such pattern is Client’s Knowledge-Based Selling. The common aim of the organizations that have motivated this pattern, called Business Pattern 1 (BP1), is to advance to:
Strategic positioning in the line of giving integral services to clients, as defined by Hax and Wilde and summarized in Chapter 1.
A Business Model based on providing value to clients by personalized services, in the idea of getting toward lock-in, generating “captive” income, and the advantages of better pricing; for this the key processes are those that implement the Capabilities, which will be discussed later, and the resources are mainly professional people who can develop these Capabilities.
Real cases of use of these ideas are to actively monitor customers to model their behavior and generate customized services; examples of this are the asthma and chronic respiratory patients monitoring in the cases presented for Intelligence Structure IV.
To implement the Strategy and Business Model objectives of this pattern, there is a need to have Capabilities that allow to capture and organize customer data, to process such data with analytical machinery—for example, Data and Web Mining, including analysis of data in social networks, semantic analysis, and the like—and to generate ideas, based on this, for proactive services to clients. A pattern, BP1, for this situation is shown in Figure 2.2, where the key idea is to complement typical components a service has with more advanced and intelligent management elements that define what is required to generate the new Capability. In such a model, a Value Stream is a set of interrelated operating activities or processes that go from generating requirements for a client to successfully delivering the service. It has a more restricted scope than the typical Value Chain, defined by Porter and others, and the one we will define later. The Management System is a set of interrelated activities, using basic practices, which decides about actions necessary to define and direct the Value Stream to fulfill clients’ requirements, including short-term management, such as sales and operations or logistics, in addition to longer-term Strategic Planning, new product development, and other new development Capabilities. Financial, human, and other resources management is not explicitly included. These basic practices are enhanced with new components that have embedded Analytics-based models, which allow generating new knowledge about users of the service and actions based on it. For modeling simplification, all the data have been summarized under the label “State information,” which includes items such as customers’ service history, website navigation logs, and the like. The flows in the model represent the typical relationships among the components; some of them are information flows, such as “Orders” and “Behavior results” and other flows of material things, such as “Input products” and, in some cases, “Products and services.”
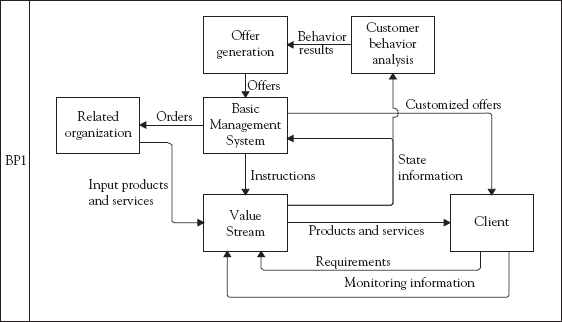
Figure 2.2 Business Pattern 1 (BP1)
An implemented case of use of this pattern is the children’s hospital that maintains chronic patients with respiratory problems at their homes with a new design based on online monitoring of medical variables and diagnosis data-based analytical models to determine when the patient is in crisis and needs medical attention, presented earlier.
This pattern is an instance of application of the Intelligence Structure II or IV, when big data is present, of the previous section, since it incorporates specific components that allow developing predictive models to provide proactive service to customers. It is oriented to operational design (Level iv).
Following pattern is Business Pattern 3 (BP3): Internal Learning for Process Improvement. This pattern is based on the following objectives defined by Strategy and Business Model:
The positioning that is selected is best product according to the definition by Hax and Wilde in the variant, also defined by Porter, of operational effectiveness.
The value that is to be generated for clients is to provide attributes for the product that are appreciated by them such as low cost, due to better efficiency, quality, on-time delivery, and the like; key processes are related to discovering how to generate more value by operational process redesign and implementing such redesigns; and key resources are again human resources that are able to innovate on processes, including users who have to adapt to new ways of doing things.
The Capability that is needed for such Strategy and Business Model is to be able to systematically analyze the organization processes, in particular, the Value Streams, to detect opportunities for process improvement. This should lead to very effective and efficient processes, which are also convenient for the customer.
The BP3 in Figure 2.3 provides a way to implement such Capability with an emphasis on the use of Analytics to systematically find the origin and possible solutions for process problems using hard data. Real cases on which this pattern is based relate to the analysis of events in the workflow of patients in urgency, ambulatory services, and surgical operations in hospitals to discover events that delay or put into risk the treatment of patients to redesign the associated process and eliminate such events.
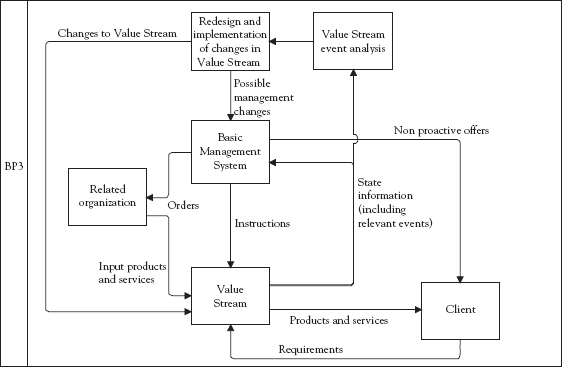
Figure 2.3 Business Pattern 3 (BP3)
This pattern covers the possibilities of redesigning the service itself, configuration and capacity, use of resources, and operational processes (Levels i to iv); possible Intelligence Architectures are I, II, and III, with simple rules, predictive and optimization models, and analyses with big data. A case of use of BP3 is the application of DEA, as will be detailed in Chapter 4, to 40 public hospitals, which has shown in practice that measuring efficiency allows to define in a very precise way how hospital services should change to improve their efficiency and assign resources accordingly; we are also currently calculating the efficiency of academic departments at the Medical Faculty of the University of Chile and finding similar opportunities as in the hospital case.
Next pattern is Optimum Resource Usage. The common aim of the organizations that have motivated this pattern, called Business Pattern 6 (BP6), is to advance to:
Strategic positioning in the line of giving the best product in its version of operational effectiveness.
A Business Model based on providing value to clients by means of excellent service at competitive prices, which requires low cost based on good resource use; for this, the key processes are those implemented by the Capabilities that will be discussed later and the resources are mainly professional people who can develop these Capabilities.
Real health cases on which this pattern is based are the following: OR scheduling in a hospital that comply with patients’ priorities and optimize resource use and optimal capacity and assignment of OR to specialties to satisfy patients’ maximum waiting time. These cases will be presented in Chapters 4 and Chapters 6.
This pattern includes Capabilities that allow having the abilities to detect opportunities for better resource usage and the tools to develop models, mathematical or heuristics, to produce optimal use. The pattern, BP6, for this situation in shown in Figure 2.4, where the key idea is to complement typical components that a service has with more advanced and intelligent management elements that define what is required to generate the new Capability.
This pattern aims to redesigning configuration and capacity, use of resources, and operational processes (Levels ii, iii, and iv) using Intelligent Structures II or IV, since predictive models based on internal data or complex analyses of big data and prescriptive mathematical models may be necessary to analyze resources use and design improved processes that optimize their use.
Additional BPs, detailed in previous volume, that cover other design levels and other Intelligence Architectures are:
Business Pattern 2 (BP2): Creation of New Streams of Service, which provides further integration with the customer, in the line of integral services to clients, with new streams of business services that provide innovative added value services to them. Intelligent Structure IV is the one present in this pattern, since powerful Analytics applied on local and external big data are needed to generate new business opportunities; so its aim is business design (Level i).
Business Pattern 4 (BP4): Performance Evaluation for Replanning and Process Improvement. This pattern is centered on the analysis and redesign of the operational processes (Level iv) with simple business logic of the Intelligence Structure I. It is applicable in situations where there is a formal Strategic Planning process that generates formal KPI’s or equivalent targets that allow to detect systematic noncompliances and, from there, generate redesign opportunities.
Business Pattern 5 (BP5): Product Innovation. New products or services or both, developed from this pattern, provide high value personalized services, generating a lock-in effect that induces loyalty. This pattern aims to business design (Level i) using Intelligent Structures II, III, or IV, since predictive models or complex analyses on internal data or of big data may be necessary to identify new service opportunities. A case in which this pattern has been applied is a large private hospital, where the problem solved was to create a Capability, based on this pattern, to manage all investments in assuring the generation, evaluation, planning, and implementation of innovative new health services for their clients. This case was introduced in Chapter 1 and it will be detailed in Chapters 3 and Chapters 4.
Business Pattern 6: Optimum Resource Usage. This pattern covers design levels ii to iv, by developing predictive and optimization models in the Intelligence Structure II style, to assure that the resources needed to provide the capacity necessary to process demand, estimated by forecasting models, is provided at a minimum cost; that resources needed to provide the capacity are deployed dynamically, as needed, at a minimum cost; and that the day-to-day scheduling of demand over the capacity is performed in such a way that demand is satisfied with the best use of resources. Examples were given when presenting Intelligence Structure II.
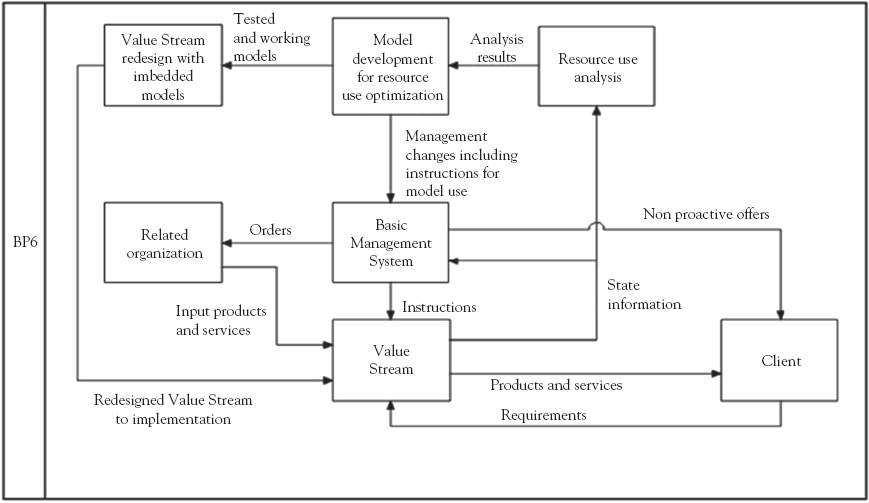
Figure 2.4 Business Pattern 6 (BP6)
General Architectures
First general architectures proposed for any business, presented in the previous volume, are summarized.
We propose Architecture and Business Process Patterns 74 that can be adapted to any domain in order to model service processes configuration options. So it will be shown that any design based on the BPs can be converted into corresponding processes design by means of an instantiation or specialization of the Architecture and Business Process Patterns that are presented later. All the patterns are based on extensive experience with process design in hundreds of real cases and share the idea that there are four aggregations of processes, called macroprocesses, which exist in any organization; they are:
Macroprocess 1 (Macro1) or Value Chain: Collection of processes for the production of the services the organization offers to its customers, which begins with their requirements formulation and ends with the satisfaction of the requests; it includes all the management and operating activities related to marketing, sales, supply, production, and logistics necessary to capture and generate the service. We call this macroprocess Value Chain, adopting a definition slightly different from Porter’s that includes other processes in it, such as the development of new products and the management of supporting resources, such as personnel and financial;75 such processes are included as part of other macroprocesses in this proposal. Value Streams are contained within Macro1 (Value Chain) and there may be several of them, explained using cases in the following chapters.
Macroprocess 2 (Macro2) or New Capabilities Development: Collection of processes for the development of new Capabilities that the organization requires to be competitive, such as new products and services, including new Business Models; necessary infrastructure to produce and operate those products, including IT infrastructure; and new business processes to assure operational effectiveness and value creation for customers, establishing, as a consequence, IT-based systems.
Macroprocess 3 (Macro3) or Business Planning: It contains the collection of processes that are necessary to define the direction of the organization, in the form of strategies, materialized in plans, programs, and budgets with well-defined objectives.
Macroprocess 4 (Macro4) or Support Resource Management: Collection of support processes that manage the resources necessary for proper operation of the other macroprocesses. Four versions of these processes can be defined a priori: financial resources, human resources, infrastructure, and materials.
These process aggregations are called macroprocesses because they contain many related processes, subprocesses, and activities that are necessary to produce key services, for internal organizational use or external clients, such as those offered to customers, strategic plans, and new facilities.
The four macroprocess patterns just presented can be combined into different structures depending on the type of businesses. We call these structures Process Architecture Patterns, modeled in BPMN as explained in the previous volume. The most basic pattern is shown in Figure 2.5 where only one instance of each macroprocess is included and therefore there is only one Value Chain; also the relationships with clients, suppliers, and other entities are not shown in detail. In real complex cases, there may be several Value Chains, each of these containing several Value Streams, integration of processes with clients, suppliers, and business partners and other relationships.
All the architecture patterns we define are based on the general structure in Figure 2.5, which shows the interaction of the different macroprocesses with markets, customers, and suppliers by means of information flows and the internal flows, such as “Plans” generated by Macro3 that direct the behavior of the other macroprocesses; “Needs” that request “Resources” to Macro4; flow of “Resources” and feedback flows of “Ideas and Results” to monitor processes and initiate new plans in Macro3 and change in Capabilities in Macro2.
Since our patterns model business practice, they must represent different business structures. Here we define structure types based on the classification developed at MIT,76 which was reviewed in the previous volume. This classification defines the following business structures: Diversification, Unification, Coordination, and Replication.
Then we consider the following architecture types:
Businesses with just one Value Chain of the Macro1 type.
Businesses with several Value Chains, each of which operates independently (Diversification of MIT’s classification).
Businesses that have several Value Chains, each of which operates independently but may share some supporting central services, such as business planning (Macro3), product design (Macro2) and financial, IT, and human resources services (Macro4); they may also use instances of centrally defined processes in their operations (Coordination and Replication of MIT’s classification).
Businesses that have several Value Chains, which share some of their internal processes—which are common services such as logistics, IT, and supply, some of which may be outsourced—and supporting central services (Unification of MIT’s classification).
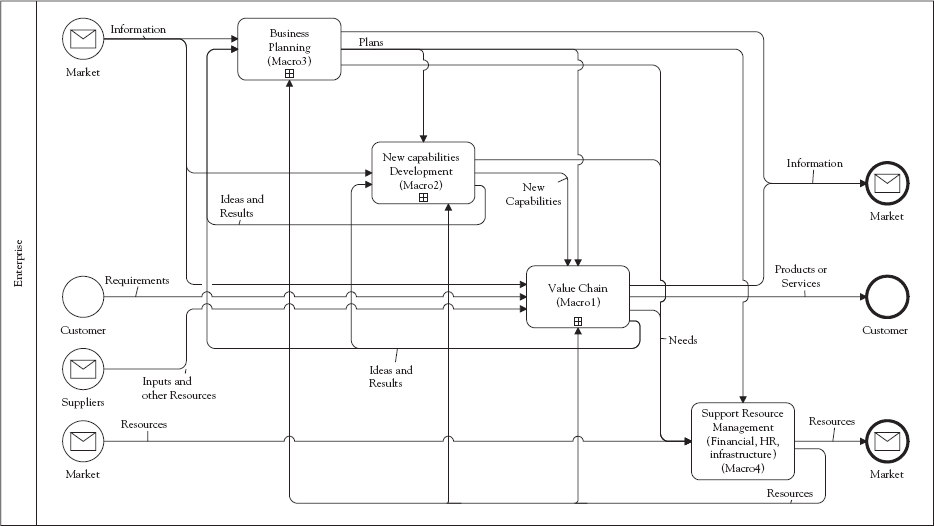
Figure 2.5 Macroprocesses Architecture Pattern
The Process Architecture Patterns types can be modeled in similar way to Figure 2.5, which we do not show here. We will only present the pattern more relevant to health institutions, which is the one in Figure 2.6. The basic idea of this pattern is to factor out the different Value Chains (i), which generate the services organization offers, several Internal Services (j) that may be centralized because of economies of scale or scope, transaction costs, agency advantages, and other economic reasons.77 For example, laboratories, ORs, beads, cleaning, and IT support in hospitals. We notice that some of the shared services can be outsourced to suppliers. Later, in Chapters 3 to Chapters 6, the application of this architecture to several cases will be presented.
The Process Architecture Patterns proposed are Enterprise Architectures with emphasis on the dimension of processes; but other architecture dimensions, such as organizational structure, which were outlined in Chapter 1, are present in the proposed structures. The dimension of IT architecture is more hidden, but, for example, shared services imply a centralized structure of systems, data, and infrastructure to support the shared services. It implies that the process structure dimension, corresponding to an explicit business design, determines the other dimensions of organization and IT structure, as modeled in Figure 1.1.
Hospital Architecture
We propose a general process architecture for hospitals based on the Shared Services Architecture Pattern presented earlier. Shared services are part of hospital practices, as all the existing Value Chains that provide different services for patients—emergency, ambulatory services, and hospitalization—use several internal common services, such as laboratory services, ORs for surgeries, food services, and cleaning services. Therefore, our architecture pattern applies directly to this domain. Specialization of such a pattern to hospitals then results in the architecture of Figure 2.7.78 This architecture has been fully validated by the management of several representative public hospitals and also by the staff of one of the largest private hospitals in Chile. In such an architecture, the Capabilities associated with “Product innovation” are taken care by the macroprocess “New Capabilities Development,” where processes are designed and projects are implemented that assure constant innovation that takes care of the variables of quality and fairness by, as shown in Figure 2.7, monitoring the Value Chains in “Services Lines for Patients,” by means of “Ideas and Results,” and redesigning them as needed to improve such variables. Moreover, the variable efficiency is present since, when redesigning, Value Chains and “Internal Shared Services” will be designed to make best possible use of resources, using Analytics as exemplified in the Intelligence Structures of previous section. In designing the macroprocess “New Capabilities Development” that provide innovation of a health service, the pattern for Macro2 defined earlier provides the guidelines on how it should be structured, as described in the first case of the following chapter.
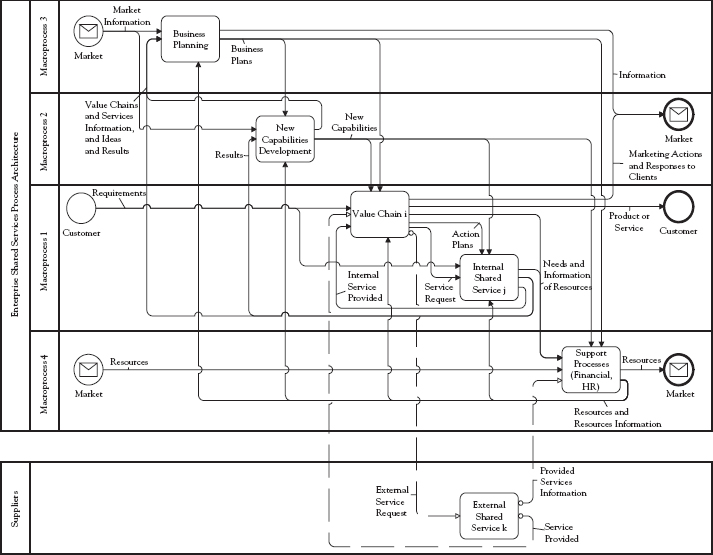
Figure 2.6 Shared Services Process Architecture Pattern
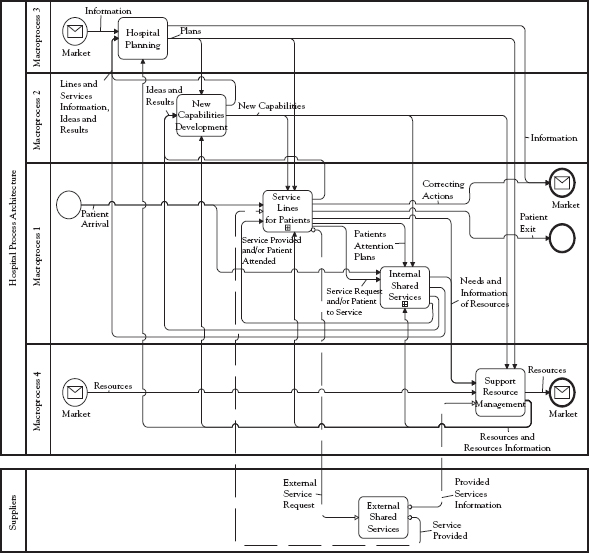
Figure 2.7 Process Architecture Pattern for Hospitals
The macroprocess “Hospital Planning” in Figure 2.7 also contributes to the improvement of the variables selected by providing “Plans,” which are, first, guidelines on which lines of innovation are more pressing or profitable, possibly in a social sense, and second, feedback on proposals that “New Capabilities Development,” “Services Lines for Patients,” and “Internal Shared Services” submit to be considered in the plans. In the first case in the next chapter, interaction among the three macroprocesses of pattern in Figure 2.7 is clearly shown following the guidelines just presented. In the second case in the next chapter, the role of “Hospital Planning” is much more important; since it is a public case where the key decision is on how to assign resources to Chilean hospitals, part of the public health system. This assignment is for innovating in selected hospitals on the variables of quality, efficiency, and fairness in a coordinated way, concentrating on those hospitals with the best possibilities of social value return.
Further details of the architecture will be exemplified by decomposing “Services Lines for Patients” and “Internal Shared Services” in Figures 2.8 to 2.11. When performing such decompositions, the general process pattern developed for Macro1 is used, as detailed in previous volume. For example, processes such as “Demand Analysis and Management,” “State Updating Service,” “Demand Forecasting and Characterization,” “Define Correcting Actions,” “Demand Analysis,” and “Operating Room Scheduling” are instances or specializations, in our terminology, of generic processes or subprocesses defined in Macro1; also many of the flows in these decompositions are specializations of general flows defined in the pattern.
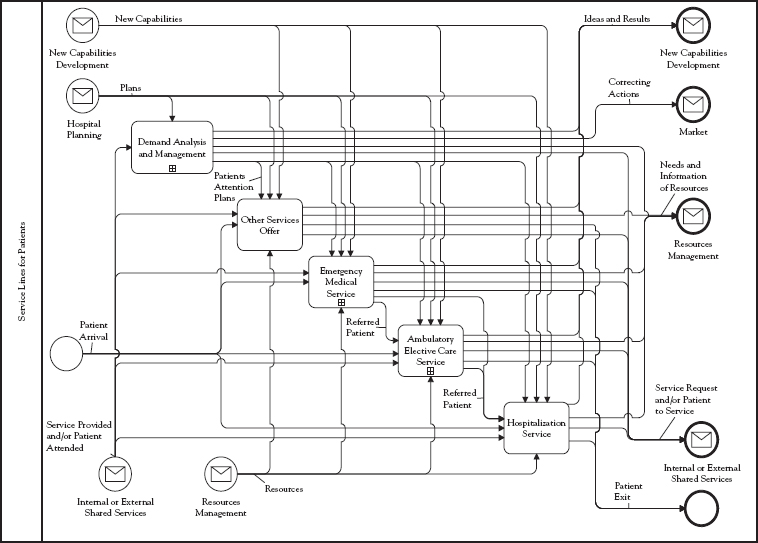
Figure 2.8 Detail of “Services Lines for Patients”
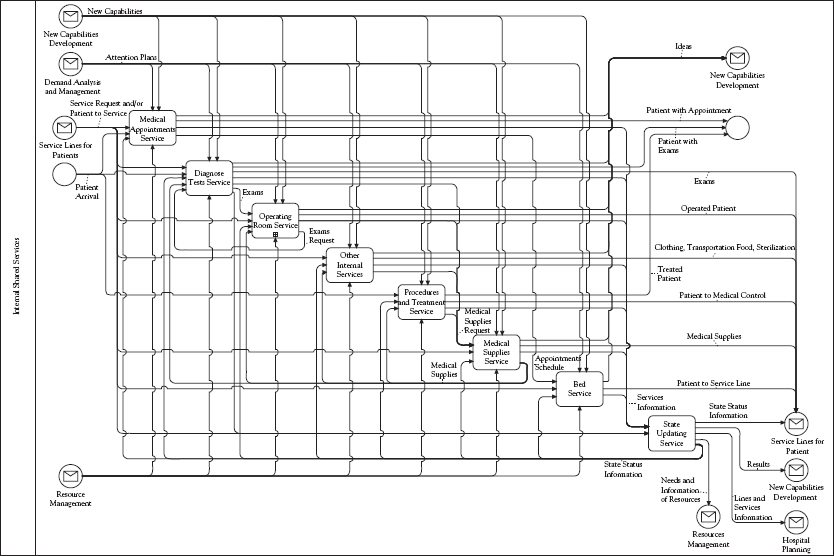
Figure 2.9 Detail of “Internal Shared Services”
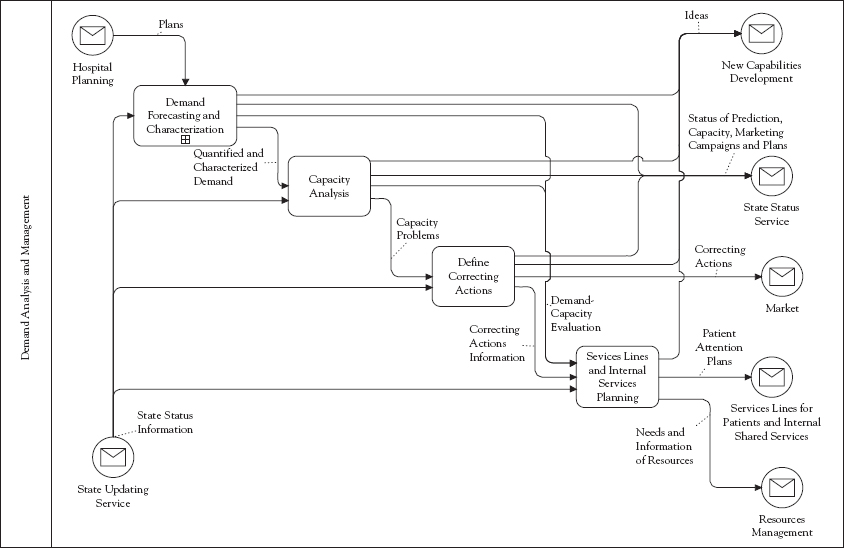
Figure 2.10 Detail of “Demand Analysis and Management”
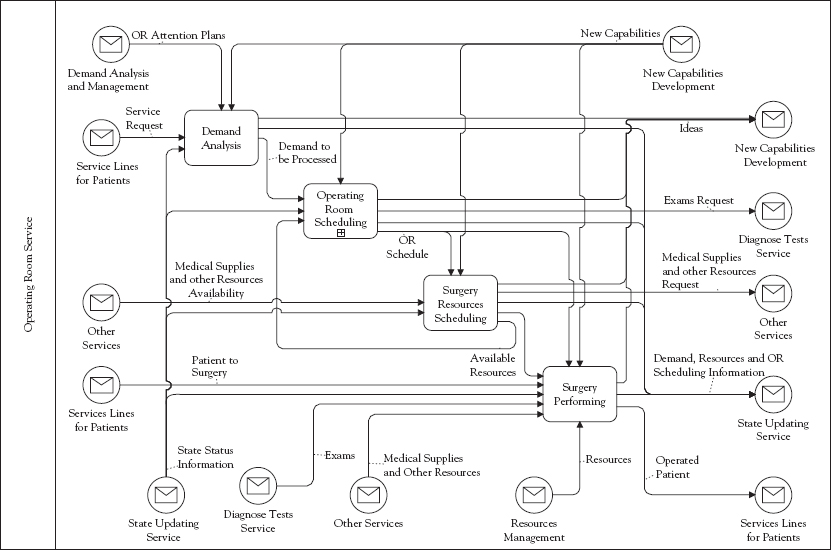
Figure 2.11 Detail of “Operating Room Service”
Figure 2.8 presents the decomposition of “Services Lines for Patients.” There are three main service lines at the hospitals we have studied, to which patients may access directly or by being referred from another service line. These lines are:
Emergency Medical Service: Attends nonelective patients, for example, those who require urgent medical attention and, as a consequence, cannot be programmed with anticipation. Each patient who arrives to this service line is categorized according to the severity of its illness, in such a way that more urgent patients are attended to with priority. Here the patient may also be referred to any of the other service lines in case the patient needs to be hospitalized or requires specialized medical attention.
Ambulatory Elective Care Service: Attends elective patients, for example, those patients whose medical attention can be programmed in advance. In this line, a medical consultation is made and some procedures are performed.
Hospitalization Service: Attends elective and nonelective patients who must be hospitalized, either to prepare to or recover from a surgery or a procedure.
In addition to the aforementioned service lines, other complementary services might be offered to single patients or groups; for example, health insurance plans for specific patient’s classes or certain company employees. This process takes place in the “Other Services Offer” line, where such services are typically found in the private health system.
The process “Demand Analysis and Management” is defined as a shared process for all service lines in such a way that it captures the behavior of their demand, allowing to plan their resources in a coordinated way to attend to such a demand.
Figure 2.9 shows the decomposition of “Internal Shared Services.” These services are shared by all the service lines mentioned earlier and they constitute a fundamental part of the activities they perform; such services are the following:
Medical Appointments Service: Assigns to patients a medical appointment for any kind of elective medical attention: diagnosis, exams, procedures, and so forth. The patient may request the appointment directly to the service or through the service lines.
Diagnose Tests Service: Performs all necessary tests to diagnose the patient. For example, blood tests, X-rays, lab analysis, among others.
Operating Room Service: Receives and prioritizes the waiting list for surgery, schedules the ORs, and performs the programmed surgeries.
Other Internal Services: Contains other services shared by the services lines for patients, such as blood bank, internal and external transportation of patients, food and cleaning service, sterilization, and so forth.
Procedures and Treatments Service: Provides procedures and treatments to patients who do not require a doctor. For example, wound-healing treatment, physical therapy, and vaccination.
Medical Supplies Service: Provides the medical supplies requested from the service lines and internal shared services.
Bed Management Service: Provides and manages different bed types for the service lines and internal shared services. Its principal goal is to locate each patient on the right bed at the right time, according to the complexity of the patients’ pathology and its expected evolution.
State Updating Service: Updates and provides the state of every process of the hospital, which makes it a shared information service.
“Demand Analysis and Management,” of Figure 2.8, is the process defined to forecast the demand for hospital services and manage such demand and the hospital capacity to ensure that an adequate balance is reached. The basic idea is to proactively create the conditions for all the relevant demand to be processed with a required quality of service (variable quality) and that large current lists of patients waiting for services are eliminated (variable fairness). Our experience so far is that a better distribution of the existing resources should increase customers’ satisfaction, without additional investments in capacity (variable efficiency), which has been proved true in the cases we present in the following sections. The details of this process, shown in Figure 2.10, are as follows:
Demand Forecast and Analysis: This process uses a forecast and analytical model that allows the hospital to anticipate the behavior of the demand through its periodical execution and the analysis of its results.
Capacity Analysis: Evaluates if the capacity of the hospital will be adequate to attend to the demand forecasted in the previous process, depending on the resources required for each category of patients. If lack or excess of capacity is concluded, then actions are taken in order to increase capacity or decrease the expected demand.
Define Correcting Actions: Defines the correcting actions to decrease the demand for services or adjust capacity. For example, to inform nonelective patients with certain pathologies that they can be attended to in other health services.
Services Lines and Internal Services Planning: Analyzes the impact that previous correcting actions will have on the forecasted demand, in order to design plans that improve the quality of service for the new demand expected.
“Operating Room Service” is the process that prioritizes and schedules the incoming demand for surgical interventions in such a way that maximum waiting times, defined by medical experts, are met and the use of resources associated with the facilities is optimized. The detailed process of the same is shown in Figure 2.11 and its subprocesses are as follows:
Demand Analysis: In this process, medical orders for surgery are added to the waiting list and then prioritized, according to the medical criteria previously formalized as business logic, which is directly related to the variable fairness presented earlier. Subsequently, a waiting list analysis determines if the resources will suffice to attend such demand on time or if additional resources are required to achieve this objective.
Operating Room Scheduling: Generates the OR schedule using the waiting list prioritized in the previous process. Although the scheduling maximizes the use of facilities, attending to the variable efficiency, it also includes good medical practices to decide the order and time of surgical interventions, which relates to quality.
Resources Scheduling: Schedules the resources that are necessary to perform the surgical interventions schedule, optimizing their use, which leads to efficiency.
Surgery Performing: Executes every surgery scheduled, which includes the preparation of the patient, the surgical procedure, and recovery. After surgery is performed, the procedure protocol information is registered and the patient is removed from the waiting list.
The Process Architecture Pattern that has been presented is only a partial selection of the complete model and emphasizes the processes and subprocesses that are used in the cases to be presented in the next chapters. The complete architecture includes the details of all the components in the general architecture of Figure 2.7.79
Health Network Architectures
Hospitals in public health services are part of a complex network, which include a central management, usually a high government office, subnetworks geographically defined that have a decentralized management and primary services that refer patients to hospitals; these primary services may belong to the subnetworks or be decentralized and locally managed, for example, by counties. We have had some experience in trying to apply our proposal to the design of Chilean Health Network, which has allowed us to define the Network Architecture we present as follows.
The architecture we propose is based on a general architecture pattern for multilevel structures that appear in complex organizations, such as holdings, businesses with several product or service lines and government services, which, besides health, include justice, education, and various others. The general architecture is included in the previous volume where an application to public health system planning was also presented. Here we present the application of the general architecture to model the problem of subnetwork management. We use as reference the case of the Chile’s Public Health System and, in particular, the operational management of a geographical defined subnetwork, which is a grouping of hospitals and primary health services, operating units, that are located in a given region and, in the case of a big city, covers sectors of the same. The key structure design decision in this case is the degree of management decentralization, since there are two hierarchical levels, overall health system and subnetwork management, above the operating units that provide the health services. In principle the management of the system is decentralized, since most of the hospitals are defined as self-managed units and primary health services are run by counties. But there are still many coordination issues that need to be centralized, such as referrals among units within a subnetwork and among subnetworks; management of waiting lists; and share of scarce resources such as beds. We will not go into these coordination issues but focalize on how to make possible that the units’ performance is maximized. This analysis of management centralization of complex systems has recently been studied under the flexibility and complexity theory mentioned before. Health structure is layered, which tends to be centralized, so the question is how to decentralize but maintaining flexibility, which is the advantage of layering, and also align results with the interests of the health authorities.
The current solution to this decentralization issue in Chile is “management by commitments,” where health system central management negotiates with network and units’ management production targets and associated operating budget; then a unit commits a given production in accordance with the budget. This practice has two problems: there is no way to calculate the right performance, with optimum use of resources, and no well-founded method to determine the correct budget. We have proposed a structural solution to this problem based on hospitals’ efficiency measurement by means of DEA and budget assignment based on this, which is detailed in other publication80 and will be presented as a case in the next chapter. Here we consider the situation of subnetwork central management, where the short-term operations management is analyzed. One design consideration is to provide means to assure that “commitments” negotiated with health system management are met. Such design is shown in Figure 2.12.
The management by commitments is simple and follows the idea of Intelligent Structure I, which is to monitor results, compare with goals and determine actions to correct deviations. It is shown in Figure 2.12 by several flows among levels that inform commitments, report results, and provide instructions to correct deviations from plan. More interesting is the possibility that subnetwork management learns from results and discovers opportunities of changes in the operating units by using best practices that increase quality of service or improve use of resources or both. The flows related to this idea are “Activity information” from “Operating unit j Value Chain” to “Information System” and then from there the flow “Performance information” to “Sub Network i central operations management,” where the data is analyzed and operations improvements determined, which are then proposed as “Operations plans, instructions, and innovation proposals” to “Innovation development and implementation” (Macro2) of the operating unit. We worked on this idea with one subnetwork in Chile and found many opportunities for improvement, which will detailed in a case in the next chapter.

Figure 2.12 Network Operations Management Architecture
Design Levels for Health Services
We defined a hierarchy of design levels in Chapter 1; here we complement such definition, including the role of Analytics in each level. The use of Analytics in our design proposal relates to providing business logic that supports intelligent business decision making and operations and also business development using well-founded designs; we define this concept as truly BI, as opposed to simpler methods based only information displays of the dashboard type. The central idea is that, in executing services delivery and related processes, business logic is necessary to formalize certain routines that use models to assure that certain objectives are attained. Models can be predictive, such as Data Mining to investigate customers’ behavior or sales forecasting models, or prescriptive to advise or automate decisions, such as optimal assignment of resources by means of mathematical optimizations models. Also service development, improving current services and designing new ones, is possible by the right use of Analytics. There are several levels of complexity at which Analytics can be applied, from very simple rules to complex optimization models, with only internal or big data. We have formalized such levels in what we call Intelligence Structures, which were summarized in this chapter. In the cases we present in Chapters 4 to Chapters 6, the use of Analytics in all these versions will be illustrated.
The design levels and the role of Analytics in each of them are as follows:
Service Business Design that delivers the structure of components of the service–production, management, supporting, and others–and their relationships, together with the interaction with the environment that generates a business Capability, which provides value to customers according to Strategy and Business Model. It represents what the business does and does not yet map to organizational units, area, or product. For example, the case of the private hospital we have presented shows that the Business Model of leading on medical treatments and technology requires new Capabilities in the form of new activities that discover and manage innovations of this type. Analytics may have an important role at this level when there are customer data, both internal and external big data, which can be used to develop new services. This requires the ability to formally perform what we have called “design of the service itself” and its production, which is similar to the product and production engineering that traditional manufacturing does with well-known practices. The difference here is that services in general and health in particular do not have well-defined processes to do this and service design is the result of experience and tradition. This has the added complexity that health services are always changing because of scientific and technological advances and that, in many cases, health services cannot be designed in advance in terms of the specific treatment a patient will need and this has to be determined for its particular needs. So the challenge is to have a process that continuously generates health services that provide innovation and the possibility of dynamic adaptation to the particular patients’ needs. This idea is present in the private hospital case of Chapter 3.
Business service configuration and capacity design, which includes, when necessary, the detail design of the service and its production process, as will be exemplified with cases in the following chapters; it also covers the identification of the management processes that should be present to assure that the service is provided in an effective and efficient way; and also the determination of what capacity each process should provide in order to be able to attend the demand according to desired SLAs. This level is based on a Process Architecture design. This design has two versions: the first is when there is a one-time redesign of the service and, due to the dynamics of the market, it is not expected to change in the short time. The other case is when, due to demand behavior changes or possible frequent innovations in service technology, it is necessary to continuously redesign the service and its production and management processes; this means that another level of processes is required, designed to produce service designs (design for producing designs recursively), which provides a continuous Capability for doing this, generating innovations required to keep the service competitive. Analytics is relevant to discover new service opportunities with internal and big data analysis, for example to model behavior of chronic patients to support preventive treatments as a new service and to model demand and determine optimal service capacity.
Resource management process design; that is people, equipment and supplies that are necessary to provide the capacity established in (ii). For example, in hospitals, number of doctors of different specialties that will work in each shift. This requires well-designed processes that, based on Analytics, forecast demand, plans and assigns resources in such a way that capacity is dynamically provided at the minimum cost. Such processes are executed regularly with a frequency that depends on the dynamics of the demand. The use of Analytics is relevant here to optimize capacity available.
Operating management processes design, such as processes, are necessary for the day-to-day scheduling of the demand over the resources in order to provide the required level of service and optimize their use. For example, in public hospitals there are usually waiting lists of surgery patients that should be scheduled in ORs in such a way that priorities associated to the severity of the patients illnesses is met and use of facilities is maximized. The use of Analytics is relevant here to optimize resource use.
This can be interpreted as a hierarchical top down approach, where business service components are progressively designed in increasing levels of detail, always starting with previously defined components and processes. In an ideal world, this assures a systemic, consistent, and efficient global health service design. However it is not necessary to do it all at once; the advantage of a top-down approach is that, once upper levels of design are performed, detail design may proceed with selected components of global design, as it will be shown in the examples to be presented in next chapters.
Alternatively one may take any lower level of design, ii to iv, without having a global business-service design, as defined earlier, and proceed with a design at such level, accepting what will not be designed as given and determined by previous decisions on how they are structured and performed. We will call this a local design case. This situation arises when priority, timing, resources, and other restrictions do not make viable a more systemic approach. The design proposed for these levels is applicable independently of no having made the design of the previous levels.
We will present cases of both of the previous approaches in the following chapters.
It is important to notice that design levels i and ii may be executed just one time to generate a new business design, configuration, and capacity, which will get implemented, possibly, with new resource management and operating processes that execute the new business-service design. On the other hand, levels i and ii can generate new processes designs that are routinely updated when the dynamics of the business require continuous innovation, as exemplified in some cases before and that will be present in more cases in what follows.
Design Methodology
Based on the ideas in previous section our proposal for service design is as follows.
At the outset we assume that the business under design is looking for innovations in their services to make it more competitive, which may imply going from increasing its productivity to changing in a fundamental way the offer and value to clients or to provide entirely new services. To accomplish this we define the following steps, not necessarily sequentially implemented:
Start with an innovative Strategy and Business Model.
Derive the need for new Capabilities to implement the Business Model; this implies defining new practices over existing activities or new activities that are created for this purpose. For example, new BI practices to develop customers’ predictive models to be able to make service offers adapted to their needs.
The business is designed to include such Capabilities using BPs, presented in this chapter; the design defines how the new Capabilities are inserted into the current business structure or form a new structure. This may require the redefinition of the service itself; for example, the case of a financial information processing organization that has one Value Stream executing a traditional model of mechanical credit card transaction processing for banks with low added value, which has decided to implement another Value Stream that makes proactive offers related to credit cards to banks’ customers, based on BI predictive models developed with the transaction data, generating a high value for them; this case was presented in detail in the previous volume. This step covers a Level i design, as defined in previous section, and generates a first approximation to Business Design using a BP.
Process Architecture designs are generated, including configuration and capacity of its components; they should be aligned with the preceding, possibly including additional detail design of the service as well as its production processes, as will be exemplified in next chapters. For example, hospitals emergency services may have different configurations in terms of its processes: among others use of a Triage (patient classification), a fast track line and several different lines of service; once components are determined, enough capacity has to be provided in order to have a desired patient average waiting time. This step covers a Level ii design, as defined in previous section.
Detail design that makes operational the architecture of previous step is performed, including processes that manage the resources required to provide the service efficiently and with adequate quality. Also the operations management processes are designed. It covers Levels iii and iv designs.
These ideas are summarized in the conceptual model of Figure 2.13.
Figure 2.13 shows the components of the structures and patterns, defined in previous section, that support each of the steps of the methodology. In the cases we will present in the following chapters, we will show how they are applied in producing a design. In their application we will use the logic and set of rules that follows.
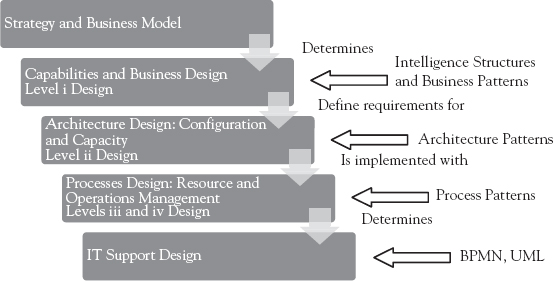
Figure 2.13 Service Design Methodology
First we consider how to determine the Capabilities and the BP that are required according to Strategy and Business Model. For the Capabilities we only provide a guide, considering certain typical situations that illustrate the line of reasoning that should be applied. Most frequent cases of Strategy we have found consider the positioning of best product, with variants of operational effectiveness and differentiation, and integral solutions to clients with variants of redefining clients’ relationship and integration with clients,81 as outlined in Chapter 1 and detailed in previous book.
With the positioning of operational effectiveness, the emphasis is on price competition with services that are usually a commodity; so the value provided to customers is mainly low price, with quality according to market standards. Then the main Capability the business needs has to do with being able to lower costs as much as possible, without compromising quality. For this there are two approaches: (a) to redesign the production of the service, using a Level ii design, or (b) to concentrate on optimizing the use of resources, using Levels iii or iv designs. In terms of intelligence needed, Option (a) needs Analytics as proposed in Intelligence Structure II, in previous section, which allow optimizing configuration and capacity of production of the service. For Option (b) relevant Analytics are the ones of Intelligence Structure I, to identify and correct situations of waste of resources and eliminate them, or Intelligence Structure II to optimize the use of resources. So if we select the positioning of operational effectiveness we end up with clear options of the design level in which to concentrate and the Intelligence Structure that should be used.
For differentiation positioning, the Business Model should be to offer, ideally, a service that is unique and provides more value to clients than any alternative. For this the necessary Capability is being able to continuously improve the service, adding features that increase value, for which a Level ii design is required to redesign the service itself and its production process, as defined in previous section; however, complementary, design Levels iii and iv are necessary to put into practice the service design. As to intelligence needed, Analytics as proposed in Intelligence Structures II or IV, as defined in previous section, are needed that allow to determine customer service’s evaluation and preferences and to optimize the configuration and capacity of the production of the service; what structure is more relevant will depend on the importance of big data to study customer behavior.
For integral solutions to clients in the variant of redefining clients’ relationship, the key is to know the client in order to offer customized services to people or other businesses. Then the necessary Capability is being able to process information available for clients and discover behaviors that suggest services he will appreciate. A Level ii design is required if it is necessary the redesign of the service itself and its production process, as suggested by customer’s behavior. Then in order that a new service design is well managed, Levels iii and iv designs are necessary to put into practice the required processes. However there may be cases in which only Level iv is required, since there are situations in which, without a complete redesign on the service, we can introduce Analytics into current marketing and sales processes to offer the same service, but personalized; for example, the product suggestions that Amazon does. Intelligence needed, as it is clear from previous analysis, is Intelligence Structure II or IV, depending on the relevance of big data to develop customer’s behavior models.
For integral solutions to clients in the variant of integration with clients, the aim is to be part of the client’s Value Chain, performing services that provide high added value to the served business. Clearly we are in the case of a B2B situation; then the necessary Capability is to be able to process information available for clients and discover situations that suggest services he will appreciate. A Level i design is required in cases in which the service needs a new business line, and a Level ii to design the service itself and its production process according to customers’ needs; however, complementary, design Levels iii and iv are necessary to put into practice the product design. Analytics needed are the ones included in Intelligence Structures II or IV, depending on the relevance of big data to develop customer’s behavior models.
In all the Strategy and Business Models variations analyzed earlier we conclude, from the Capabilities needed in each case, which are the levels of design that should be performed and the Intelligence Structure that applies in order to comply with a required positioning and value to be generated for customers.
Now we show how to determine the BP that applies to define a first approximation to Business Design. For this we start with the design level and Intelligent Structure that apply to the business situation under analysis, determined as just explained. For each combination of design level and Intelligent Structure, the possible BPs that apply were discussed when the BPs were presented; thus, for example, BP1, Clients’ Knowledge-Based Selling, applies for Level iv design and Intelligent Structure II or IV, and BP3, Internal Learning for Process Improvement, applies to all design levels and Intelligence Architectures I, II, and IV.
Next the relationship between Business Design, materialized in an instantiated in a BP, and process architecture is examined. The selected BP is implemented through processes, for which the following rules apply:
BP “Client’s Knowledge-Based Selling” (BP1) implies a redesign of Macro1, as will be shown in the case of the in-home patient monitoring to detect treatment needs by means of predictive models in next chapter; so the Process Architecture is just Macro1. This applies only when there is not a need for structural changes of the Value Chain, which is so in cases where the Analytics can be readily inserted in its current processes, and also clients’ predictive models are stable and do not need continuous review.
All the other BPs require that the design includes the ability to continuously reconsider, through several means, the situation and performance of the Value Streams and, based on this, propose changes to such streams or new ones. Hence, a structure that generates new designs for the streams is required. This implies that Macro2, “New Capabilities Development,” must be a part of the Process Architecture, together with the Value Streams of Macro1, which are to be continuously changed. This can be relaxed when any of the following conditions apply:
Structural change is made just one time, since there is not a need for reconsideration.
Stable environmental conditions make unnecessary continuous change.
Improvements can be part of Macro1 or Macro4.
In architectures derived by Rules (1) and (2), Macro3, “Business Planning,” may appear when changes to Macro1 should be aligned with Strategic Planning; this is particularly required in the BP “Performance Evaluation for Replanning and Process Improvement” (BP4). Also BP “Product Innovation” (BP5) usually requires an architecture with Macro3, since this type of innovation should be aligned with or approved by the strategic level.
In all the aforementioned architectures, Macro4, “Support Resource Management,” may appear in the architecture depending on the need to assure that a certain resource is available to supply the other macros in the architecture; a particular case in which Macro4 may be the main macroprocess is when, under the BP “Optimum Resource Usage” (BP6), a particular Value Stream of Macro4—for example, human resource provision, financial management, or equipment maintenance—is the one under design.
Cases that illustrate the use of all these rules will be presented in the following chapters.