
7
Intelligent Charging for Electric Vehicles—Scheduling in Battery Exchanges Stations
An environmentally friendly lifestyle is the trend in recent years, as the number of plug‐in hybrid electric vehicles (PHEVs) and electric vehicles (EVs) increases each day. As discussed in the previous chapter, PHEVs and EVs may also be considered as energy storage units in the smart grid to contribute in demand response. In this chapter, we study intelligent smart charging schemes for PHEVs and EVs in the smart grid. In particular, we introduce battery exchange stations into the demand‐side management system so that the PHEVs and EVs can help smooth the load on the power grid. Two centralized schemes for optimal charging are proposed to achieve the minimum peak‐to‐average ratio in the smart grid. We also propose a game theoretical scheme so that the battery exchange stations can participate in the DSM system without handing over control to the control center.
7.1 Background and Related Work
7.1.1 Background and Overview
PHEVs and EVs (we will use PHEV in the rest of the chapter for simplicity) consume much less fossil fuel and produce low levels of greenhouse gas emissions (or none at all) compared to traditional vehicles based on fossil fuels [115–118]. However, PHEVs will significantly increase the load on the power grid. For example, if ![]() of conventional vehicles in the United States were replaced by PHEVs, the total charging load would be around
of conventional vehicles in the United States were replaced by PHEVs, the total charging load would be around ![]() of the peak US summer peak load [13, 14]. Fortunately, the traditional grid is transforming into a smart grid, which tends to be more efficient at generating and transferring electricity to the customers. Because of advanced two‐way communication networks, demand‐side management (DSM) can be achieved by exchanging the information of customer‐side load request and the corresponding control message (e.g. smart price or direct scheduling) [14, 100, 101, 105]. By applying DSM, the load of the power grid can be smoothed. In particular, many studies have been conducted to reduce the peak‐to‐average ratio (PAR).
of the peak US summer peak load [13, 14]. Fortunately, the traditional grid is transforming into a smart grid, which tends to be more efficient at generating and transferring electricity to the customers. Because of advanced two‐way communication networks, demand‐side management (DSM) can be achieved by exchanging the information of customer‐side load request and the corresponding control message (e.g. smart price or direct scheduling) [14, 100, 101, 105]. By applying DSM, the load of the power grid can be smoothed. In particular, many studies have been conducted to reduce the peak‐to‐average ratio (PAR).
In this chapter, we introduce PHEVs into the DSM system to further smooth the load of the power grid. Instead of letting customers charge on their own [14, 115, 119–122], it has been proposed to establish battery exchange stations (BESs) analogous to gas stations if PHEVs have standardized batteries [123]. In a BES, the charging outlets can be upgraded to more powerful ones (e.g. 600 volt [115]), which can charge the batteries much faster than normal power outlets (e.g. 120 volt in the United States) in households. Customers do not need to worry about spending a long time charging their PHEVs. It seems clear that if the BESs sell electricity back to the grid during peak hours and charge the batteries during off‐peak hours, the load on the grid can be smoothed. Therefore, our focus for the proposed DSM system is on the BESs instead of individual PHEVs.
We first assume that the control center takes over the load scheduling of all the BESs, with the object of achieving minimum PAR while satisfying all the customers. This scheduling scheme is formed as a convex optimization problem where the optimal solution can be found. However, direct load control is not practical in the smart grid, so many existing DSM systems apply a smart pricing scheme. When a smart pricing scheme is used, electricity is more expensive when the load on the grid is high. Because of the real‐time information exchange between customers and the control center, smart pricing can be applied frequently and regularly (e.g. hourly). Based on smart pricing, we propose another incentive load scheduling scheme for BESs so that they will make a profit by selling energy back to the grid during peak hours and charge the batteries during off‐peak hours. With reasonable assumptions, we prove that this scheme also achieves minimum PAR. Moreover, we propose a game theoretical scheme so that the load scheduling can be done locally at each BES with little information exchanged. In this scheme, each BES tends to maximize its own profits instead of maximizing overall profits of all BESs. Unlike the first two schemes, the distributed scheme does not guarantee ![]() customer satisfaction, since each BES lacks accurate information about the others. We conduct analysis on the planning of BESs (e.g. number of charging ports and amount of battery storage) in order to decrease the impact on customers.
customer satisfaction, since each BES lacks accurate information about the others. We conduct analysis on the planning of BESs (e.g. number of charging ports and amount of battery storage) in order to decrease the impact on customers.
7.1.2 Related Work
The PHEV charging scheduling problem has been studied by many researchers [14, 92, 115, 120–123]. Huang et al. in [92] studied the charging schedule for PHEVs in shared parking lots. However, while the peak load is reduced, the control center took over all the scheduling, which may not be practical. Fan in [14] applied a smart pricing scheme to distributed PHEV charging scheduling, in which each PHEV adjusts the demand according to the result of demand response. However, selling electricity back to the grid was not considered. Bahrami et al. in [115] also introduced smart pricing and formulated a game among all the users. The goal in their work was to minimize the cost of charging for all the owners. However, the users did not actively contribute to the DSM. Zhou et al. in [124] proposed distributed charging scheduling for PHEVs, which could avoid bus congestion and large voltage drops in the distribution grid. The PHEVs were provided with incentives, which is different from smart pricing. Moreover, the ability to sell back capability and DSM were not studied.
The authors in [120–122] applied a smart pricing scheme to encourage the PHEVs to sell back energy during peak hours. Moein et al. in [122] proposed a two‐stage charging control strategy in a multicarrier energy environment. The customers were motivated to participate. However, the customers would passively adjust the load according to the smart pricing (time‐of‐use pricing in [122]). Liu et al. in [121] assessed the impact of the scheduling of PHEV charging on wind power; however, the DSM system was not considered. Dong et al. in [123] proposed adaptive scheduling of PHEV charging based on a battery replacement strategy (similar to BES). Their focus was on the impact of imperfect data communication on the scheduling performance; however, the BESs were not considered to contribute to the DSM system. In this chapter, we focus on BESs instead of direct charging of PHEVs. By introducing a smart pricing strategy, the BESs contribute positively to the DSM system by selling back electricity during peak hours, which will reduce the PAR of the power grid. The batteries stored in BESs form a power storage system; however, it is different from the traditional ones [125, 126]. While the traditional power storage system is designed to save overgenerated energy for future use, the BESs are intended to fulfill the needs of the PHEVs while lowering the PAR for the power grid. More specifically, energy stored in BESs does not decrease the requirement of power generation or increase the available energy when needed.
The rest of this chapter is organized as follows. In section 7.2, we illustrate the DSM being studied. In section 7.3, we propose several load‐scheduling schemes for BESs. In section 7.4, we show the numerical and simulation results. In section 7.5, we present our conclusion and describe some future research directions.
7.2 System Model
In this section, the system model is illustrated. Notations, variables, and preliminary assumptions to be used in the problem formulation are also described in this section.
7.2.1 Overview of the Studied System
The DSM system is illustrated in Figure 7.1. It consists of a control center, power suppliers, and customers. Although DSM should be applied to all types of appliances, including residential, business, and industrial customers as well as PHEVs, we focus on the role of PHEVs in the DSM system in this section.
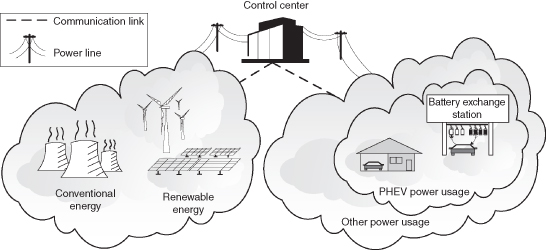
Figure 7.1 Demand‐side power management system with BESs.
7.2.2 Mathematical Formulation
For better understanding of in problem formulation, all notations and variables to be used in the rest of this chapter are listed in Table 7.1.
Table 7.1 List of notations and variables.
| Sets | |
| set of BESs | |
| set of time intervals | |
| set of PHEVs | |
| set of load scheduling for | |
| Variables and parameters | |
| number of power outlets at | |
| number of batteries at | |
| electricity bought from the grid at | |
| electricity sold to the grid at | |
| number of fully charged batteries at | |
| number of customers at | |
| maximum charging electricity load for one outlet | |
| maximum discharging electricity load for one outlet | |
| amount of electricity to charge/discharge a battery | |
| unit price for battery exchange | |
| unit price for electricity at | |
| minimum charging time for a battery | |
Let ![]() be the set of all BESs. The total number of BESs is assumed to be
be the set of all BESs. The total number of BESs is assumed to be ![]() . Analogous to traditional gas stations, BESs are assumed to be widely available throughout a town or city. Each BES is equipped with
. Analogous to traditional gas stations, BESs are assumed to be widely available throughout a town or city. Each BES is equipped with ![]() fast charging outlets (e.g. DC fast charging, 600 volt) and discharging outlets. In practice, an outlet may be connected to multiple charging ports. We assume that only one port is connected to an outlet for simplicity. A BES does not directly provide charging/discharging ports for customers in order to maximize the utility of the equipment. Moreover, customers would only need to stop for a few minutes to exchange their batteries instead of for hours if charging them. Let
fast charging outlets (e.g. DC fast charging, 600 volt) and discharging outlets. In practice, an outlet may be connected to multiple charging ports. We assume that only one port is connected to an outlet for simplicity. A BES does not directly provide charging/discharging ports for customers in order to maximize the utility of the equipment. Moreover, customers would only need to stop for a few minutes to exchange their batteries instead of for hours if charging them. Let ![]() be the set of all PHEVs, and let
be the set of all PHEVs, and let ![]() be the total number of PHEVs. Although the DSM system can be modeled for any arbitrary time period to satisfy the assumptions, we consider a daily model in this work without loss of generality. Let each day be divided into several uniform time intervals (e.g. hourly), denoted as
be the total number of PHEVs. Although the DSM system can be modeled for any arbitrary time period to satisfy the assumptions, we consider a daily model in this work without loss of generality. Let each day be divided into several uniform time intervals (e.g. hourly), denoted as ![]() .
.
We assume that the PHEVs are equipped with standardized batteries that can be easily exchanged. Without loss of generality, we assume that there is only one type of standard battery. It is relatively straightforward to extend the model with multiple sizes and types of batteries depending on the types of vehicles, similar to grades of gasoline. When a customer comes, a simple battery exchange is performed at a flat rate![]() per exchange. For simplicity, we assume that the state of charge (SoC) of the batteries being exchanged is a constant value (e.g.
per exchange. For simplicity, we assume that the state of charge (SoC) of the batteries being exchanged is a constant value (e.g. ![]() ). A customer will exchange a
). A customer will exchange a ![]() battery for a fully charged one. If the BES sells back the electricity to the grid, it discharges a fully charged battery to
battery for a fully charged one. If the BES sells back the electricity to the grid, it discharges a fully charged battery to ![]() as well. Besides earning profits by exchanging batteries, each BES also makes profits by participating in the DSM system with smart pricing mechanism. Each BES is willing to sell back electricity to the power grid during peak hours, when the price is much higher than during off‐peak hours, and to charge the batteries during off‐peak hours. Many researchers have considered the smart pricing function as convex and increasing [27–29]. It is generally adopted as a quadratic function as follows:
as well. Besides earning profits by exchanging batteries, each BES also makes profits by participating in the DSM system with smart pricing mechanism. Each BES is willing to sell back electricity to the power grid during peak hours, when the price is much higher than during off‐peak hours, and to charge the batteries during off‐peak hours. Many researchers have considered the smart pricing function as convex and increasing [27–29]. It is generally adopted as a quadratic function as follows:
where ![]() should be determined by utility companies. Note that
should be determined by utility companies. Note that ![]() in Eq. (7.1) is the total load of the power grid but not the total load for PHEVs.
in Eq. (7.1) is the total load of the power grid but not the total load for PHEVs.
7.2.3 Customer Estimation
It is important to estimate the number of customers and their expected usage patterns for a BES business. If there is a large number of customers, a BES will require more equipment. If most customers visit during the same hour, then more batteries shall need to be prepared beforehand. More ports will be required if batteries are charged frequently. Without a good estimate, a BES may not be able to maximize its profits due to insufficient equipment or may even lose money due to deploying too much equipment. Moreover, efficient operation of BESs is required for the smart grid to achieve the best DSM.
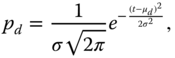
Without loss of generality, we assume that most customers either go to a BES on their way to work or on their way back home. Each PHEV needs to exchange its battery (or charge) once daily. Moreover, a customer will not purchase service at BES ![]() if no fully charged batteries are available. This customer will check some other BESs within the area during the same time slot (e.g. one hour). Therefore, it is assumed that the distribution of incoming customers at BESs follows the pattern of the customers' departure from and arrival at home. Following [124, 127, 128], the departure and arrival times of the PHEVs are modeled as two normal distributions with the mean of 7 a.m. and 6 p.m. and a standard deviation of one hour respectively. The distributions are expressed as follows:
if no fully charged batteries are available. This customer will check some other BESs within the area during the same time slot (e.g. one hour). Therefore, it is assumed that the distribution of incoming customers at BESs follows the pattern of the customers' departure from and arrival at home. Following [124, 127, 128], the departure and arrival times of the PHEVs are modeled as two normal distributions with the mean of 7 a.m. and 6 p.m. and a standard deviation of one hour respectively. The distributions are expressed as follows:
and

where ![]() ,
, ![]() and
and ![]() . Since a customer only needs to exchange the battery once, the estimate of incoming customers at BESs adopts modified distributions, that is,
. Since a customer only needs to exchange the battery once, the estimate of incoming customers at BESs adopts modified distributions, that is, ![]() for the customers coming during the departure window and
for the customers coming during the departure window and ![]() for the customers who come during the arrival window. The distribution of incoming customers to all the BESs is illustrated in Figure 7.2. Note that the estimate of incoming customers could be extended to more precise models based on big data analytics on the lifestyles of drivers and types of PHEVs from voluntary participants: for example, docked PHEVs at BESs, social networks, or tracking applications in smart phones. Moreover, we agree that not all customers will need to replace batteries on a daily basis in practice. Nonetheless, the service frequency of each customer can be easily extended to other settings.
for the customers who come during the arrival window. The distribution of incoming customers to all the BESs is illustrated in Figure 7.2. Note that the estimate of incoming customers could be extended to more precise models based on big data analytics on the lifestyles of drivers and types of PHEVs from voluntary participants: for example, docked PHEVs at BESs, social networks, or tracking applications in smart phones. Moreover, we agree that not all customers will need to replace batteries on a daily basis in practice. Nonetheless, the service frequency of each customer can be easily extended to other settings.

Figure 7.2 Distribution of incoming customers.
In this chapter, assuming that each BES exchanges only one battery for each customer. Customers are not allowed to purchase extra batteries. The total number of batteries in a BES (i.e. ![]() ) is a constant value,
) is a constant value, ![]() . Let
. Let ![]() (e.g. hour) be the minimum charging time for a battery; then the maximum number of batteries can be charged daily at
(e.g. hour) be the minimum charging time for a battery; then the maximum number of batteries can be charged daily at ![]() is
is ![]() . Therefore, a larger
. Therefore, a larger ![]() may cause waste instead of providing better service to customers or making more contribution to the DSM system.
may cause waste instead of providing better service to customers or making more contribution to the DSM system.
7.3 Load Scheduling Schemes for BESs
In this section, we propose centralized optimization schemes to minimize PAR. The minimum PAR can be used as a benchmark for distributed schemes or even real‐time schemes based on dynamic settings. We also propose a game theoretical approach for practical deployment.
7.3.1 Constraints for a BES 
Let ![]() be the electricity load at BES
be the electricity load at BES ![]() during time slot
during time slot ![]() , where
, where ![]() is the load selling back to the grid,
is the load selling back to the grid, ![]() is the load buying from the grid, and
is the load buying from the grid, and ![]() is the number of cars exchanging batteries. Note that
is the number of cars exchanging batteries. Note that ![]() can be negative, meaning that the BES is providing electricity to the power grid. Without loss of generality, we assume that the total load of the grid is always positive with DSM. We then discuss in detail the constraints for BES
can be negative, meaning that the BES is providing electricity to the power grid. Without loss of generality, we assume that the total load of the grid is always positive with DSM. We then discuss in detail the constraints for BES ![]() .
.
During time slot ![]() , the total amount of electricity bought from the grid cannot exceed the charging capacity of the station, that is
, the total amount of electricity bought from the grid cannot exceed the charging capacity of the station, that is
where ![]() is the maximum charging electricity load for one port. Similarly, the total amount of electricity sold back to the grid cannot exceed the discharging capacity of the station, that is
is the maximum charging electricity load for one port. Similarly, the total amount of electricity sold back to the grid cannot exceed the discharging capacity of the station, that is
where ![]() is the maximum discharging electricity load for one port. Note that
is the maximum discharging electricity load for one port. Note that ![]() does not buy and sell electricity during the same time slot, thus,
does not buy and sell electricity during the same time slot, thus,
However, since ![]() has limited storage space for fully charged batteries
has limited storage space for fully charged batteries ![]() during
during ![]() , the total amount of electricity sold back to the grid is also bounded by
, the total amount of electricity sold back to the grid is also bounded by ![]() , that is
, that is
It is possible that ![]() does not have enough fully charged batteries
does not have enough fully charged batteries ![]() for
for ![]() customers. In this case, we assume that unsatisfied customers will randomly find another nearby station (e.g.
customers. In this case, we assume that unsatisfied customers will randomly find another nearby station (e.g. ![]() ) with available batteries during the same time slot. Therefore, we must ensure that the overall number of fully charged batteries is enough for all the customers, that is
) with available batteries during the same time slot. Therefore, we must ensure that the overall number of fully charged batteries is enough for all the customers, that is

A battery being charged will not be able to sell its energy back to the power grid. The electricity sold back to the grid must be from fully charged batteries. Batteries changed to the customers' PHEVs are also fully charged ones. In order to satisfy all the customers while reducing peak load on the power grid, the constraint that needs to be satisfied is as follows:

Finally, the total surplus electricity bought from the grid should exceed the total need of the PHEVs, that is

Note that the right hand side of Eq. (7.10) is a constant. A strict equality applies to this constraint if the system has ![]() efficiency.
efficiency.
7.3.2 Minimizing PAR: Problem Formulation and Analysis
The objective of applying the DSM system in BESs is to smooth the PAR in the smart grid. Therefore, we first propose ![]() to directly minimize PAR, that is
to directly minimize PAR, that is

7.3.3 Problem Formulation and Analysis for Minimizing Costs
If all the customers choose to exchange their batteries at BESs instead of charging on their own, all of the batteries must be scheduled by the BESs. In this case, the optimal solution to ![]() is the minimum PAR. When some customers choose to charge PHEVs on their own, those charging loads will not purposely contribute to lowering the PAR. Thus the overall PAR will be higher than the optimal PAR in most cases. However, we still need to make it clear that both the BESs and the customers have the incentive to participate in the DSM system, because the BESs can make more profits while customers can generate more savings. Let
is the minimum PAR. When some customers choose to charge PHEVs on their own, those charging loads will not purposely contribute to lowering the PAR. Thus the overall PAR will be higher than the optimal PAR in most cases. However, we still need to make it clear that both the BESs and the customers have the incentive to participate in the DSM system, because the BESs can make more profits while customers can generate more savings. Let ![]() be the unit cost of electricity (i.e.
be the unit cost of electricity (i.e. ![]() ), which follows the cost function shown in Eq. (7.1). Let the daily profit of BES
), which follows the cost function shown in Eq. (7.1). Let the daily profit of BES ![]() be the utility, that is
be the utility, that is
where ![]() is the total load of other appliances in the power grid after applying DSM. Note that
is the total load of other appliances in the power grid after applying DSM. Note that ![]() is considered as a constant in this work.
is considered as a constant in this work.
An intuitive incentive for each station is the overall daily profit, which is calculated as follows:

Note that ![]() may not satisfy
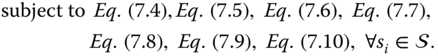
may not satisfy ![]() on its own; we assume that all the BESs together satisfy all the customers in this centralized scheme. The objective is to maximize the overall profit of the BESs, that is
on its own; we assume that all the BESs together satisfy all the customers in this centralized scheme. The objective is to maximize the overall profit of the BESs, that is


Existing convex optimization problem solutions can be applied to reach the optimal solution ![]() .
.
7.3.4 Game Theoretical Approach
In practice, it is impossible to let a control center schedule all the BESs. Technically, a centralized system is too complex to achieve the computational efficiency required by the scale of the smart grid. Besides, very few BESs would surrender their confidential information to the utility company. Therefore, distributed local scheduling schemes are more appropriate for the smart grid. For this reason, we propose a game theoretical approach for the DSM system. The game is formulated as a 3‐tuple ![]() , where
, where ![]() is the set of all possible load schedules for station
is the set of all possible load schedules for station ![]() . Let
. Let ![]() be the load scheduling of all the BESs
be the load scheduling of all the BESs ![]() . The utility for each BES is the daily profit, represented as follows:
. The utility for each BES is the daily profit, represented as follows:
where ![]() returns the smaller value of the two inputs.
returns the smaller value of the two inputs.
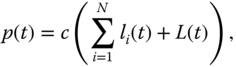
In the proposed local scheduling scheme, each BES (e.g. ![]() ) is limited by the physical charging/discharging capacity, as expressed in Eq. (7.4), Eq. (7.5), and Eq. (7.6). Note that with a local scheduling scheme, if a customer cannot exchange a battery at
) is limited by the physical charging/discharging capacity, as expressed in Eq. (7.4), Eq. (7.5), and Eq. (7.6). Note that with a local scheduling scheme, if a customer cannot exchange a battery at ![]() , there is no guarantee that another BES will be available. Although
, there is no guarantee that another BES will be available. Although ![]() does not guarantee
does not guarantee ![]() customer satisfaction, its storage of fully charged batteries satisfies some of the customers and also allows electricity to be sold back to the grid, that is
customer satisfaction, its storage of fully charged batteries satisfies some of the customers and also allows electricity to be sold back to the grid, that is
For ![]() , the total surplus electricity bought from the grid should exceed the total need of the PHEVs at
, the total surplus electricity bought from the grid should exceed the total need of the PHEVs at ![]() , that is
, that is

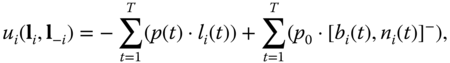
The objective for each BES ![]() is to maximize its daily profit with the given smart pricing schedule, that is
is to maximize its daily profit with the given smart pricing schedule, that is
Note that the constraints are applied to individual BES ![]() only. For simplicity, we assume that
only. For simplicity, we assume that ![]() has taken into consideration the customers not served by another BES. Therefore, a BES should always have enough fully charged batteries for incoming customers. In this case, we have
has taken into consideration the customers not served by another BES. Therefore, a BES should always have enough fully charged batteries for incoming customers. In this case, we have ![]() . If a customer comes in without being serviced, he/she will leave and charge on his/her own at a public parking lot or at home.
. If a customer comes in without being serviced, he/she will leave and charge on his/her own at a public parking lot or at home.
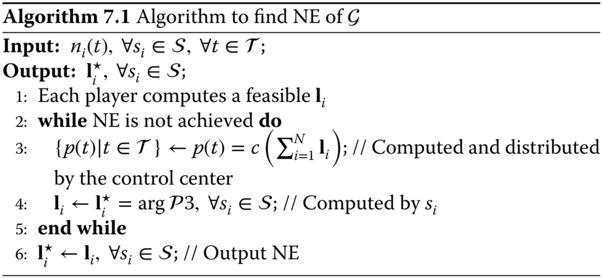
The NE can be found by iteratively calculating the best response at each BES following Algorithm 7.1. In each iteration, each BES submits its load schedule to the control center, then the control center computes the price schedule and sends it back to the BESs. The BESs will adjust their schedules based on the given price schedule and resubmit them to the control center.
7.4 Simulation Analysis and Results
In this section, we conduct a simulation to demonstrate the proposed intelligent charging schemes for BESs in the smart grid.
7.4.1 Settings for the Simulations
In the simulation, we assume that there are 10 BESs in the town. For simplicity, the BESs are assumed to be identical. A total of ![]() PHEVs require battery exchange service daily in this area. Each battery is assumed to have a capacity of 10 kilowatt‐hours, thus
PHEVs require battery exchange service daily in this area. Each battery is assumed to have a capacity of 10 kilowatt‐hours, thus ![]() kilowatt‐hours as
kilowatt‐hours as ![]() of the capacity. Without loss of generality, we assume that each charging port at the BES charges a battery at 17 KW per hour with
of the capacity. Without loss of generality, we assume that each charging port at the BES charges a battery at 17 KW per hour with ![]() efficiency and discharges a battery at 8.5 KW per hour with
efficiency and discharges a battery at 8.5 KW per hour with ![]() efficiency. Let
efficiency. Let ![]() so that each time slot lasts one hour. In this case, two batteries can be fully charged using the same port in one time slot, and one battery can be depleted in one time slot. These settings will be used throughout the simulations unless specified otherwise. Note that the settings are chosen arbitrarily for performance evaluation of the proposed DSM. The settings are subject to change based on further big data analytics before actual deployment of BESs.
so that each time slot lasts one hour. In this case, two batteries can be fully charged using the same port in one time slot, and one battery can be depleted in one time slot. These settings will be used throughout the simulations unless specified otherwise. Note that the settings are chosen arbitrarily for performance evaluation of the proposed DSM. The settings are subject to change based on further big data analytics before actual deployment of BESs.
To better demonstrate the impact of PHEVs on the smart grid, we assume the existing load of the power grid without PHEVs follows a trend of typical peak and off‐peak hours. The off‐peak hours span from 0 to 8 and from 19 to 24, while peak hours span from 9 to 18. An example of the power load in a power grid without PHEVs is shown in Figure 7.3. Peak and off‐peak hours can be seen in the illustration. Note that the exact power load in a time slot fluctuates. The total load needed by PHEVs (![]() ) is assumed to be exactly
) is assumed to be exactly ![]() of the existing load in the power grid for better evaluation of the proposed schemes.
of the existing load in the power grid for better evaluation of the proposed schemes.

Figure 7.3 An example of a power load without PHEVs in the power grid.
7.4.2 Impact of the Proposed DSM on PAR
In this evaluation, we show that intelligent charging schemes for PHEVs can contribute to smooth PAR in the smart grid. Assume that each BES is equipped with an unlimited supply of batteries, 20 charging ports, and ![]() fully charged batteries in the beginning. The solution to the PAR minimization problem
fully charged batteries in the beginning. The solution to the PAR minimization problem ![]() can be found by solving Eq. (7.16). The optimal load schedule is shown in Figure 7.4. We can see that with the introduction of BESs, although the total load of the power grid increases by
can be found by solving Eq. (7.16). The optimal load schedule is shown in Figure 7.4. We can see that with the introduction of BESs, although the total load of the power grid increases by ![]() , the peak load is reduced. As a result, the load schedule is further smoothed, and the PAR is reduced. Note that because the BESs sell back electricity to the grid during previous peak hours and charge during previous off‐peak hours, the new load schedule has a different pattern of peak/off‐peak hours. For example, previous off‐peak hours from midnight to 8 a.m. are peak hours with DSM. Therefore, the concept of peak/off‐peak hours may be dropped in the smart grid. Instead, real‐time based smarting pricing may be applied, as discussed in the previous chapter.
, the peak load is reduced. As a result, the load schedule is further smoothed, and the PAR is reduced. Note that because the BESs sell back electricity to the grid during previous peak hours and charge during previous off‐peak hours, the new load schedule has a different pattern of peak/off‐peak hours. For example, previous off‐peak hours from midnight to 8 a.m. are peak hours with DSM. Therefore, the concept of peak/off‐peak hours may be dropped in the smart grid. Instead, real‐time based smarting pricing may be applied, as discussed in the previous chapter.

Figure 7.4 Smoothed load with BESs.
7.4.3 Evaluation of BESs Equipment Settings
7.4.3.1 Number of Charging Ports
The numbers of charging/discharging ports and batteries have different impacts on BESs as well as the efficiency of the DSM. For example, increasing the number of charging ports would increase the parallel charging ability of the BESs. A larger number of batteries would increase the service capacity of a BES as well its contribution to the DSM system. However, the number of batteries is limited by electricity demand and electricity supply in the smart grid. With the settings applied in this simulation, the number of stored batteries reaches an upper bound as the number of ports increases to support the DSM most efficiently, as shown in Figure 7.5. Therefore, there is no need to deploy too many charging ports at each BES. Such information should be provided by utility companies to avoid shortages or overdeployment.

Figure 7.5 The impact of  on fully charged batteries.
7.4.3.2 Maximum Number of Fully Charged Batteries
Another important parameter to each BES is the number of fully charged batteries available in a given time slot. Intuitively, more of such batteries would allow the BES to provide service to more customers and contribute more to the DSM system. However, storing more fully charged batteries requires more ports for charging. With the same settings used in the simulation before, the minimum number of fully charged batteries required in each time slot is shown in Figure 7.6. In this simulation, the maximum number of fully charged batteries is required at six a.m. The BESs take advantage of the previous off‐peak hours during the night to prepare for the service peak to incoming customers as well as to resell electricity. Therefore, the optimal number of fully charged batteries stored at each BES shall be the maximum requirement of each time slot. In the case evaluated in this part, each BES will store ![]() fully charged batteries to support PHEV customers and DSM optimally. In reality, this value could be used as a benchmark for BESs, based on their actual service capacity.
fully charged batteries to support PHEV customers and DSM optimally. In reality, this value could be used as a benchmark for BESs, based on their actual service capacity.

Figure 7.6 Impact of port number on fully charged batteries.
7.4.3.3 Preparation at the Beginning of Each Day
The number of fully charged batteries at the beginning of each day (![]() ) has an impact on the total amount of batteries as well. With
) has an impact on the total amount of batteries as well. With ![]() fixed, we show the impact of different
fixed, we show the impact of different ![]() in Figure 7.7. As we can see, a larger
in Figure 7.7. As we can see, a larger ![]() results in a larger amount of battery storage. Now that it is unlikely to sell back electricity during off‐peak hours, it might be more cost effective for the BESs to start with
results in a larger amount of battery storage. Now that it is unlikely to sell back electricity during off‐peak hours, it might be more cost effective for the BESs to start with ![]() , where the storage is sufficient for incoming customers. Considering the estimates used in this chapter,
, where the storage is sufficient for incoming customers. Considering the estimates used in this chapter, ![]() . However, whether
. However, whether ![]() is the optimal choice or not depends on PAR as well, since it affects the efficiency of the DSM system.
is the optimal choice or not depends on PAR as well, since it affects the efficiency of the DSM system.

Figure 7.7 Impact of  on fully charged batteries.
7.4.3.4 Impact on PAR from BESs
In this evaluation, we would like to present different contributions from BESs based on two factors: preparation for the beginning of each day and the number of ports. In Figure 7.8, we show the impact on PAR with different preparations for the beginning of each day (i.e. ![]() ). It can be seen that a larger
). It can be seen that a larger ![]() leads to a lower PAR. This result occurs because hat once there are sufficient batteries for PHEV customers, the remaining batteries will be used as storage units to contribute to DSM. With a large enough number of storage units, the PAR can be reduced to 1 in the smart grid. However, as mentioned earlier, maintaining more storage units requires more charging/discharging ports in each BES.
leads to a lower PAR. This result occurs because hat once there are sufficient batteries for PHEV customers, the remaining batteries will be used as storage units to contribute to DSM. With a large enough number of storage units, the PAR can be reduced to 1 in the smart grid. However, as mentioned earlier, maintaining more storage units requires more charging/discharging ports in each BES.

Figure 7.8 Impact of  on PAR.
The impact of the number of ports ![]() on the PAR is shown in Figure 7.9. The results show that with more charging ports in each BES, a lower PAR could be achieved in the smart grid. With more charging ports, a BES can fully charge more batteries during off‐peak hours and support the grid during peak hours. However, since the increase in battery storage has an upper bound, the achievable PAR has a lower bound. In this case, the optimal PAR (i.e. PAR=1) is not reached even with four times the number of ports. The relationship between the optimal number of charging ports and number of PHEVs needs to be studied in the future with big data analytics so that better guidance will be available for BESs deployment.
on the PAR is shown in Figure 7.9. The results show that with more charging ports in each BES, a lower PAR could be achieved in the smart grid. With more charging ports, a BES can fully charge more batteries during off‐peak hours and support the grid during peak hours. However, since the increase in battery storage has an upper bound, the achievable PAR has a lower bound. In this case, the optimal PAR (i.e. PAR=1) is not reached even with four times the number of ports. The relationship between the optimal number of charging ports and number of PHEVs needs to be studied in the future with big data analytics so that better guidance will be available for BESs deployment.
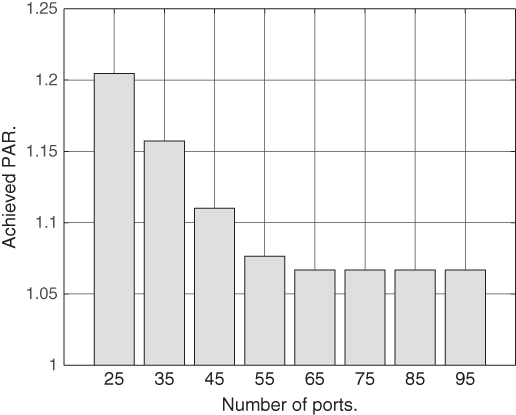
Figure 7.9 The impact of port number on PAR.
7.4.4 Evaluations of the Game Theoretical Approach
Using the general settings and ![]() ,
, ![]() , we evaluate the game theoretical approach. As shown in Figure 7.10, the distributed approach did not achieve the minimum PAR. Compared to the optimal solution achieved by solving problems
, we evaluate the game theoretical approach. As shown in Figure 7.10, the distributed approach did not achieve the minimum PAR. Compared to the optimal solution achieved by solving problems ![]() or
or ![]() , the game theoretical approach returns a higher peak demand with the
, the game theoretical approach returns a higher peak demand with the ![]() demand increase from PHEVs. Nonetheless, the PAR is lowered by almost
demand increase from PHEVs. Nonetheless, the PAR is lowered by almost ![]() from 1.3158 to 1.2047, which clearly demonstrates that the proposed distributed approach could contribute to DSM in the smart grid. Correspondingly, the maximum number of fully charged batteries required in each time slot is given in Figure 7.11. Compared to the optimal solution, the distributed scheme requires more fully charged batteries.
from 1.3158 to 1.2047, which clearly demonstrates that the proposed distributed approach could contribute to DSM in the smart grid. Correspondingly, the maximum number of fully charged batteries required in each time slot is given in Figure 7.11. Compared to the optimal solution, the distributed scheme requires more fully charged batteries.
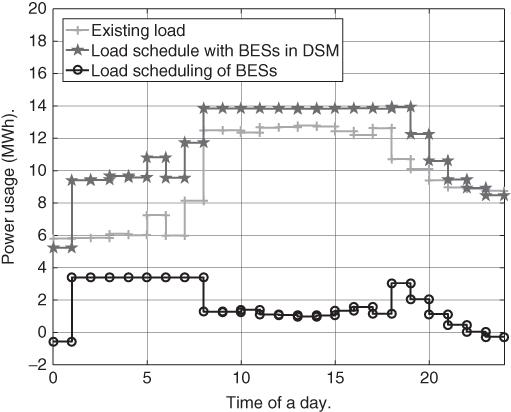
Figure 7.10 Load schedules achieved by distributed scheme.
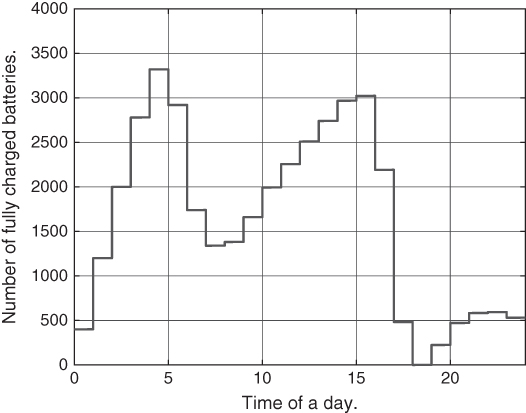
Figure 7.11 Estimate of battery storage by distributed scheme.
7.5 Summary
In this chapter, we studied intelligent charging schemes for PHEVs in the smart grid. Instead of charging the PHEVs directly, we proposed to adopt battery exchange stations so that the customers only need to spend a few minutes exchanging their batteries. While PHEVs will significantly increase demand for electricity on the power grid, the intelligent charging schemes can be designed to cope with the demand increase and enhance grid efficiency. Because of the large number of batteries stored at each BES, we proposed to let the BESs participate in the demand‐side management system so that they can store electricity during off‐peak hours and reduce electricity demand from the grid during peak hours. Specifically, we proposed several load‐scheduling schemes to minimize the PAR while earning extra profits for BESs. We successfully proved that the proposed profit incentive scheme also minimizes the PAR. We also proposed a distributed game theoretical approach so that the scheduling can be done locally in practice. In the simulations, we analyzed the optimal number of stored batteries and the selection of a reasonable number of charging ports to help building BESs. In future research, more types of PHEVs and versatile lifestyles should be considered for a better modeling of the demand‐side management system based on big data analytics.