
8
Big Data Analytics and Cloud Computing in the Smart Grid
The advanced communications infrastructure to be deployed in the smart grid is used for data exchange in many systems. Whether the smart grid can benefit from new and upgraded features, such as demand response and wide‐area monitoring system is closely related to issues of collection, storage, and processing of data. In this chapter, we will introduce big data analytics and cloud computing and discuss their relevance to the smart grid. More specifically, we will focus on relevant issues in demand response and wide‐area monitoring for illustration.
8.1 Background and Motivation
8.1.1 Big Data Era
Big data is a term for large and complex data sets that cannot be adequately processed with traditional data processing application software [129]. The concept of big data is widely defined as a set of ‘V’s:
- Volume. Big data indicates a massive volume of data that continues to grow larger.
- Velocity. Data comes in at unprecedented and possibly increasing speeds. Many data streams are generated in near real time.
- Variety. Data comes in all types of formats, structured and unstructured.
- Variability. The inconsistency of the data sets can hamper processes to handle and manage them.
- Veracity. Data quality varies greatly.
According to [130], the world's effective capacity to exchange information through telecommunication networks has increased from an annual volume of 281 petabytes in 1986 to an annual volume of 667 exabytes in 2014, as illustrated in Figure 8.1. The annual volume will continue to increase. The same research pointed out that general‐purpose computing capacity grew at an annual rate of 58%. The world's capacity for bidirectional telecommunication grew at 28% per year, closely followed by the increase in globally stored information (23%).
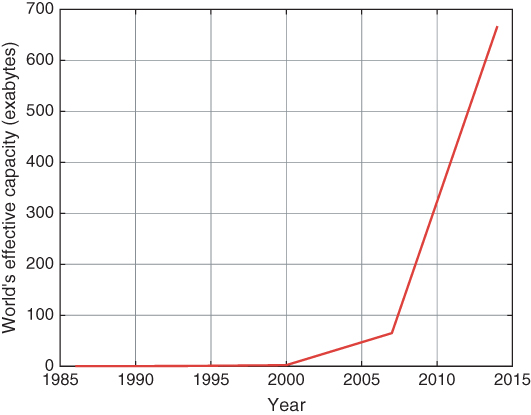
Figure 8.1 The world's effective data capacity.
Big data often refers to the use of predictive analytics, user behavior analytics, or other methods for data analysis that extract information from data sets. In particular, big data analytics would be a more appropriate term. Data analytics has been studied and applied for decades in areas such as machine learning and data mining. Compared to those traditional data analytics methods, big data poses challenges, including capture, storage, analysis, search, sharing, transfer, visualization, information privacy, etc. The issue of big data was initially introduced in space exploration, weather forecasting, medical genetic investigations, etc. Similar problems occurred to social media such as Facebook, Twitter, YouTube, and others. Big data is inevitable in the smart grid.
8.1.2 The Smart Grid and Big Data
The smart grid is in the big data era because the presence of the ‘V’ concepts can be demonstrated. The smart grid has an advanced bidirectional communications infrastructure that enables many systems, such as advanced metering infrastructure (AMI) and wide‐area monitoring systems (WAMS). It is foreseeable that smart grid will generate a massive amount of data. For instance, smart meters will soon generate over ![]() petabytes a year in the United States [78]. Real‐time data from the smart grid could be generated in terabytes due to the massive scale of the power grid. Thus the velocity of data is increasing considerably. Moreover, the smart grid has various data sources that range from field measurements obtained by substation/feeder intelligent electronic devices to specialized commercial and/or government/state databases, weather data of different types, lightning detection data, seismic data, fire detection data, electricity market data, vegetation and soil data, etc [131].
petabytes a year in the United States [78]. Real‐time data from the smart grid could be generated in terabytes due to the massive scale of the power grid. Thus the velocity of data is increasing considerably. Moreover, the smart grid has various data sources that range from field measurements obtained by substation/feeder intelligent electronic devices to specialized commercial and/or government/state databases, weather data of different types, lightning detection data, seismic data, fire detection data, electricity market data, vegetation and soil data, etc [131].
The processing and management of data on such a scale in the smart grid requires considering the data analytics used in big data industries. In general, data in the smart grid needs to be relevant, clean, organized, aggregated, processed, and analyzed to obtain and present actionable intelligence [132]. Cybersecurity and energy use are issues to be addressed with big data techniques, due to the massive number of devices in the communications infrastructure. The smart grid is intended to achieve efficient grid operations and to reduce greenhouse gas emissions. Therefore, the increases in energy consumption required by big data as well as cybersecurity should not threaten the operation efficiency of the grid.
In particular, demand response in the smart grid requires data analytics to accurately forecast electricity demand and predict peak power needs to power generators. Consumers rely on pricing/tariff set by demand response programs to control their electricity usage. Another application in the smart grid is its advanced monitoring and control system, for example WAMS. Transmission and distribution entities in the smart grid will use data analytics to identify anomalies in power delivery, detect and avert outages before they happen, and restore service faster after an outage. While data volume may not be big in the monitoring system, its real‐time requirement presents challenges equivalent to those of big data.
8.2 Pricing and Energy Forecasts in Demand Response
Demand response is one of the most important applications in the smart grid that is based on the communication infrastructure (particularly the AMI). Although real‐time demand response is the ultimate goal, online algorithms for controlling it are hard to deploy on a large scale. As an alternative, pricing forecasts and energy forecasts are critical to efficient demand response [133].
8.2.1 An Overview of Pricing and Energy Forecasts
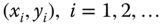
A variety of data is gathered internally from the smart grid, including internal data and external data, as illustrated in Table 8.1. Among internal data, one critical set of data is the metering data generated by smart meters in the AMI. Metering data reveals the electricity usage of each household. Overall, metering data reveals the real‐time (or nearly real‐time) power usage of the grid from the customer side. Although utility companies already have monitored the electricity sold to the grid from the standpoint of power generators even in the traditional power grid, measurements of power usage from the customer side are more precise due to power losses during transmission and distribution [134, 135]. Other internal data (e.g. PMU data) is more important for monitoring transmission line status.
Table 8.1 Useful data in the smart grid
| Internal data | External data |
| Metering data | Weather forecast |
| PMU data | Social networks |
| Power line monitoring data | Stock markets |
| Etc. | Etc. |
Apart from internal data generated in the smart grid, external data from other sources is another important input for optimizing control over the power grid. For example, the amount electricity to be generated from conventional power generators depends not only on energy requirements of customers but also on the capability of renewable resources and storage units. The capacity of renewable resources (e.g. a solar farm) is not likely to be controllable. Nonetheless, a precise weather forecast will be helpful for capacity prediction. External data can be different in types and sources. For example, it can come from weather forecasts, social networks, location‐based tracking applications of smart devices, and many other sources.
The collected data lets the service provider optimize control over the power grid by giving the energy forecast to power generators and the price forecast to customers and smart appliances. As discussed before in chapter 6, it is critical to have schedules of appliances for demand response. With an appliance schedule determined, it is easy to have a schedule for power generation (including the electricity needed from renewable sources). As a consequence, the corresponding price can be found accordingly. Therefore, to provide price and energy forecasts, one good solution is to model the energy consumption of different appliances and (more importantly) the schedule of each appliance by the service provider. The energy consumption of each appliance may depend on its load; for example, an air conditioner (AC) uses more electricity if a lower temperature is set on its thermostat. However, the fluctuation of power is not too significant for many appliances (e.g. washing machines, coffee makers, etc.). Learning the schedules of customers can reveal much about the schedule of appliances. Without loss of generality, the following example residential customers. It has similar reasoning for other customers (i.e. industrial ones and business ones). To model the schedule of appliances in a house more precisely, one can extract useful information from the schedule of residential customers by getting answers to the following questions:
- When do they work?
- How far are they away from work?
- How do they commute?
- What do they do outside after work?
- What do they do at home?
With a model for the schedule of a customer, one may assume that the air conditioner (AC) is turned off (or set at a higher temperature) during working hours. The AC is turned on before the user returns home from work. The advance is based on the commuting time of the customer. The schedule is postponed for a few hours on Friday night if the customer schedules time for activities outside the house. The use of the AC remains steady throughout weekends. The usage patterns of many other appliances are closely related to activities of customers as well. In addition, the schedule and levels of energy consumption vary with changes in the surrounding environment, such as differences in temperature and humidity. The use of big data analytics in social networks is being widely studied [136]. A massive amount of useful information can be mined from the status posted by customers. For example, if a customer checks in at a hotel with his/her family (as seen via a post on Twitter or Facebook), then it is possible that their house will have low power usage in the coming days. A final energy forecast can be made after complex data analytics.
An overview of the data processing procedure is depicted in Figure 8.2. It includes three components: data input, big data analytics, and information output. Big data analytics is the core function of the process, which consists of four steps: 1) data collection, 2) data preprocessing, 3) data storage, and 4) data analysis [137].
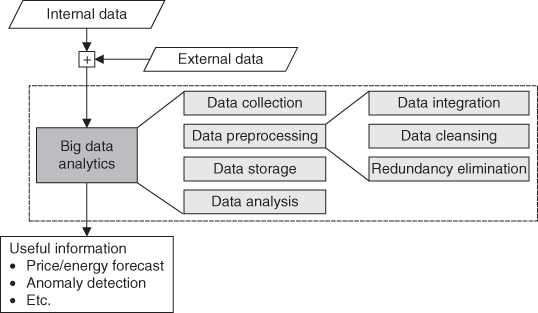
Figure 8.2 Data processing procedure.
8.2.2 A Case Study of Energy Forecasts
Machine learning is a tool for data analysis and predictions. In this section, a case study will be given to illustrate energy forecasting. The studied data set is a three‐month record of “Home B” from [138]. It includes a data set of the energy consumption of “Home B” with a sampling frequency of 1 Hz, and a data set of the surrounding environmental conditions (e.g. inside temperature, outside temperature, humidity, etc.) with a sampling frequency of more than 10 times per hour. Detailed interpretation of the data sets can be found in [139]. In this case study, only daily consumption and average daily temperature are used.
Let ![]() be the set of daily average temperatures (in Celsius). Let
be the set of daily average temperatures (in Celsius). Let ![]() be the set of daily energy consumption (in kilowatt‐hours). Figure 8.3 depicts the energy consumption (the solid line) and the average temperature (the dashed line) of each day for a month.
be the set of daily energy consumption (in kilowatt‐hours). Figure 8.3 depicts the energy consumption (the solid line) and the average temperature (the dashed line) of each day for a month.
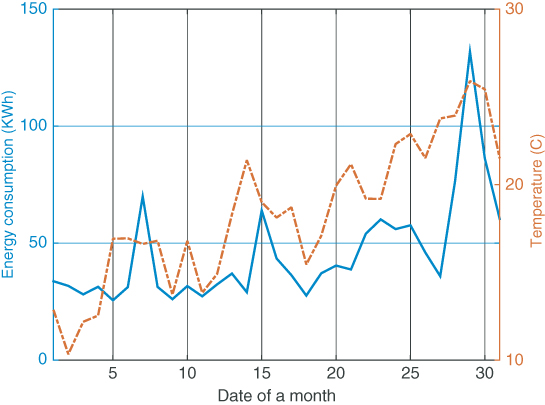
Figure 8.3 Energy consumption and temperature.
Among all the appliances monitored, the air conditioner and heater have the highest levels of energy consumption. For simplicity, we assume that the daily energy consumption is closely related to the daily average temperature. Assume that ![]() is some deterministic
is some deterministic ![]() , plus random noise, such that
, plus random noise, such that ![]() , where
, where ![]() follows a zero mean Gaussian distribution. Moreover, we assume that both
follows a zero mean Gaussian distribution. Moreover, we assume that both ![]() and
and ![]() are independent and identically distributed random variables. Therefore,
are independent and identically distributed random variables. Therefore, ![]() is a random variable that follows the distribution
is a random variable that follows the distribution
Linear regression is applied as the learning algorithm; that is, ![]() is a linear function of
is a linear function of ![]() . Then we have
. Then we have
Alternatively, we have the likelihood as follows:
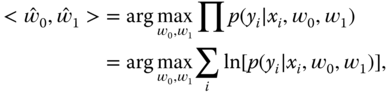
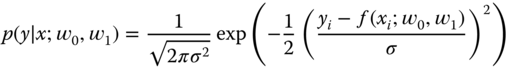
The optimal ![]() is found by applying a maximum conditional likelihood estimate:
is found by applying a maximum conditional likelihood estimate:
where
Note that the logarithmic function can be applied because the variables are independent and identically distributed. After some straightforward arithmetic steps, we have
To solve Eq. (8.7), we can derive a gradient descent rule. Or we may apply heuristic optimization algorithms such as Monte Carlo and particle swarm optimization. The solution is used for energy forecasts.
In this case study, two types of energy forecasts are made (with results illustrated in Figure 8.4). The first type of energy forecast is made by using the training data of one month and then calculating the energy forecast for the next month based on the daily average temperature. The other type of the energy forecast is provided daily. For instance, the energy forecast for day 10 is only given at the end of day 9. The training data is gathered from the previous ![]() days. Note that the real daily average temperature is used as the input of the prediction. It is reasonable to assume that a precise weather forecast can be obtained beforehand. The results of the monthly energy forecast are shown as the red solid line. As we can see, the monthly forecast gives a rough idea of energy consumption; however, it lacks accuracy. The results of the daily energy forecast are given with
days. Note that the real daily average temperature is used as the input of the prediction. It is reasonable to assume that a precise weather forecast can be obtained beforehand. The results of the monthly energy forecast are shown as the red solid line. As we can see, the monthly forecast gives a rough idea of energy consumption; however, it lacks accuracy. The results of the daily energy forecast are given with ![]() . We can clearly see that the daily energy forecast is closer to the real level of energy consumption. Although the energy forecasts are not precise due to the simplicity of the case study (only the daily average temperature is considered), it clearly shows the possibility of making precise energy forecasts with more factors considered and more advanced techniques for big data analytics.
. We can clearly see that the daily energy forecast is closer to the real level of energy consumption. Although the energy forecasts are not precise due to the simplicity of the case study (only the daily average temperature is considered), it clearly shows the possibility of making precise energy forecasts with more factors considered and more advanced techniques for big data analytics.
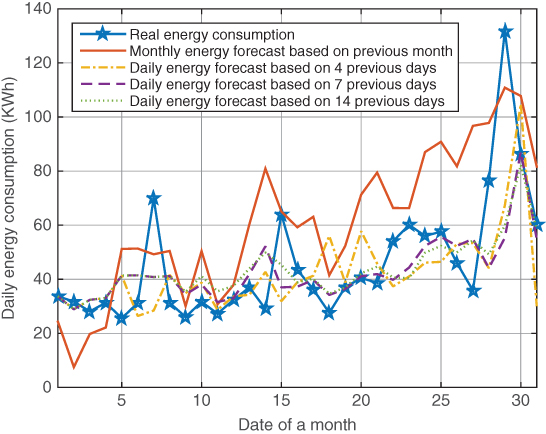
Figure 8.4 Energy forecast.
8.3 Attack Detection
8.3.1 An Overview of Attack Detection in the Smart Grid
Attacks on metering data may compromise the privacy of customers. Moreover, energy fraud can also be caused by attacks on metering data [140]. There are two types of energy fraud. In one, the customer reports less energy consumed than actually used. In the second, more energy may be used by rogue connections than is actually consumed by customers. Both types of the energy fraud will create deviations in optimal grid control, especially demand response. Specifically, if less energy is reported than is used, demand response will send a lower energy requirement to suppliers. That will in turn cause an insufficient electricity supply or a waste of fuel due to a sudden transfer from low to high levels electricity generation. If more energy usage is reported by rogue connections, the power station will overgenerate electricity, and that will increase the price unnecessarily.
Besides metering data, the control system in the smart grid also generates various monitoring data from different sensors, such as phasor measurement units (PMUs) or transmission line monitoring sensors. As mentioned above, if attacks are launched on metering data, they could jeopardize the efficiency or accuracy of demand response. More critically, attacks on sensing data may cause a system malfunction or even a blackout. Big data analytics can be applied to quickly find anomalies from sensing data. A supervisory control and data acquisition (SCADA) system is a centralized monitoring and control capability for the power grid. SCADA still plays a role in smart grid; nonetheless, it will be upgraded to distributed monitoring system to have better scalability. Other more advanced communication infrastructures and monitoring systems (e.g. the AMI and the WAMS) are being deployed to monitor and control the grid.
System monitoring may include bus voltages, bus real and reactive power injections, electrical waves, etc. These measurements are stored in a controlling system for analysis. State estimation is used in system monitoring to estimate the power grid state through analysis of the measurements. The output of state estimation reveals potential operational problems in the smart gird in real time (or near real time). Actions can be taken to avoid problems (especially cascading failures) and potential side effects of those issues. Sensing data that reveals the operational status of the power grid is generated in real time (e.g. the PMU generates data at a high frequency, e.g. 60 to 120 frames per second for 60 Hz systems) [50]. It is impractical to apply complex network security schemes to protect sensing data. Therefore, state estimation using machine learning, data mining, and other techniques that are based on observed data can be a better solution.
8.3.2 Current Problems and Techniques
State estimation in the smart grid uses power flow models [141, 142]. A power flow model is a set of equations that depict the energy flow on each transmission line of a power grid. Using the DC power flow model, one of the widely accepted models is represented by a linear regression model as follows:
where ![]() is set of state variables,
is set of state variables, ![]() is the set of of measurement variables,
is the set of of measurement variables, ![]() is the measurement Jacobian matrix, and
is the measurement Jacobian matrix, and ![]() is the measurement errors, which is assumed to have independent components.
is the measurement errors, which is assumed to have independent components.
Three statistical estimation criteria are commonly used in state estimation.
- The maximum likelihood (MLE) criterion. Assume as given a sample
 of observations that come from a distribution with an unknown probability density function. The function belongs to a certain family of distributions
  , where
  is an unknown vector. The joint density function of
  given
given  is
is  . If the observed value
  is considered to be fixed and
  is the variable, then the function is redefined as a likelihood function:
(8.9)The MLE is to find
is the variable, then the function is redefined as a likelihood function:
(8.9)The MLE is to find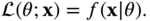
 that maximizes the likelihood function, as shown in Eq. (8.10).
- The weighted least‐square (WLS) criterion. Assume as given a set of points
 , where
  is an independent variable and
  is a dependent variable whose value is found by observation. A function
  is modeled to predict
  . In most cases, there is a difference between the predicted value and the observed value. The difference is defined as a residual, so that
  . The WLS is to find
  that minimizes the weighted square estimates.
(8.11)where
that minimizes the weighted square estimates.
(8.11)where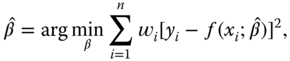
 is the weight of the
  ‐th point.
 - The minimum variance (MV) criterion. Assume as given a function
 that predicts a dependent variable based on observation
  . The MV is to minimize the variance
(8.12)
. The MV is to minimize the variance
(8.12)
In most of the research work, the error ![]() is assumed to be normally distributed with zero mean; all the three criteria mentioned above lead to an identical estimator (i.e. minimum mean square error (MMSE) estimator) with the matrix as follows [141, 142]:
is assumed to be normally distributed with zero mean; all the three criteria mentioned above lead to an identical estimator (i.e. minimum mean square error (MMSE) estimator) with the matrix as follows [141, 142]:
where ![]() is a diagonal matrix whose elements are reciprocals of the variances of errors, that is,
is a diagonal matrix whose elements are reciprocals of the variances of errors, that is, ![]() , where
, where ![]() is the variance of the
is the variance of the ![]() ‐th measurement error.
‐th measurement error.
If an attacker injects a false data vector ![]() (nonzero) into the measurements, the resulting observation model is changed as follows:
(nonzero) into the measurements, the resulting observation model is changed as follows:
To detect an attack, the measurement residual is examined in ![]() ‐norm
‐norm ![]() . Given an arbitrary threshold
. Given an arbitrary threshold ![]() , if
, if ![]() , then a measurement is declared attacked. Several detection models using statistical learning methods have been studied, including supervised and semisupervised learning methods. Nonetheless, online learning methods can be more important for practical applications because the measurements are observed in real time in the smart grid. A general online learning system uses only the given samples at each algorithm's processing time. Energy fraud detection may not need to occur online or in real‐time. Decision trees and artificial neural networks are commonly used as learning algorithms for energy fraud detection [140, 143].
, then a measurement is declared attacked. Several detection models using statistical learning methods have been studied, including supervised and semisupervised learning methods. Nonetheless, online learning methods can be more important for practical applications because the measurements are observed in real time in the smart grid. A general online learning system uses only the given samples at each algorithm's processing time. Energy fraud detection may not need to occur online or in real‐time. Decision trees and artificial neural networks are commonly used as learning algorithms for energy fraud detection [140, 143].
8.4 Cloud Computing in the Smart Grid
As discussed before, the smart grid is halfway to the big data era. However, big data anaytics requires enormous computing and storage resources to extract useful information efficiently. How can utility companies achieve price/energy forecasts, attack detection, and other controls with a reasonable budget? A feasible solution is to introduce cloud computing into the ICT infrastructure. Cloud computing is a readily available resource and relatively cheap to use compared with dedicated computing centers.
8.4.1 Basics of Cloud Computing
Cloud computing is a model for enabling ubiquitous, convenient, on‐demand network access to a shared pool of configurable computing resources that can be rapidly provisioned and released with minimal management effort or service provider interaction [144]. The cloud computing environment provides various services models such as software as a service (SaaS), platform as a service (PaaS), infrastructure as a service (IaaS), and network as a service (NaaS).
- Cloud software as a service (SaaS). In SaaS, the service provider manages and controls the underlying cloud infrastructure, including networks, servers, operating systems, storage, etc. Even the applications are provided by the service provider. A customer simply accesses the applications from client devices through a client interface (e.g. a web‐based client).
- Cloud platform as a service (PaaS). Similar to SaaS, the service provider manages and controls the underlying cloud infrastructure in PaaS. However, a customer is provided the capability to create applications using programming languages and tools that are supported by the service provider.
- Cloud infrastructure as a service (IaaS). In IaaS, the service provider manages and controls the underlying cloud physical infrastructure. A customer is provided the capability to manage and control storage, networks, and some other fundamental computing resources. A customer is also able to run arbitrary software, including operating systems and applications.
- network as a service (NaaS). In NaaS, the service provider delivers virtual network services over the Internet. A customer uses NaaS based on a pay‐per‐use or monthly subscription basis.
There are different kinds of cloud deployments, including private cloud, public cloud, community cloud, and hybrid cloud. A private cloud in the smart grid is deployed and maintained by utility companies. A public cloud is provided by a service provider, and utility companies pay for the service when needed. A hybrid cloud is a combination of private clouds and public clouds.
Although security can be insured by a private cloud communicating with private networks, the deployment and maintenance costs are high. Using a public cloud alone in the smart grid may not be acceptable due to security concerns. A hybrid could balance security/performance and cost. Thus, the smart grid should deploy a hybrid cloud for big data analytics and other necessary applications.
8.4.2 Advantages of Cloud Computing in the Smart Grid
As sensors become integrated into virtually every piece of equipment in smart grid communications infrastructure, it would not be feasible or cost‐effective to provide centralized data processing at utilities. Cloud computing brings three major advantages to the smart grid.
- First, there is no need to invest in the whole infrastructure, because only the infrastructure for the private portion of the cloud is deployed by utility companies. The resources from the public portion of the cloud can be rented at a relatively low price. In many cases, cloud computing uses a pay‐as‐you‐go pricing model. The maintenance cost is also low, because it applies only to the private portion.
- Second, it is easier to implement applications in the cloud. Public cloud computing has virtually unlimited resources. Therefore, the utility companies need not worry about upgrading capacity for a large‐scale system, which is no doubt a huge concern in the smart grid. The infrastructure in the cloud can also be rescaled according to adaptive requirements. Moreover, because of the cloud's elasticity, feature updates/upgrades can be done in a short amount of time without disturbing users or requiring them to install major updates or extra packages.
- Third, it is easier to access cloud service from a variety of smart devices. Because of that, monitoring and controlling the grid can be more flexible. Once security is provided for the transmission, a cloud service can be accessed from virtually anywhere with appropriate authorization.
Even with cloud computing, only significant data or processed data needs be communicated to the centralized data processor. In other cases, utilities may establish local data centers to serve as their private clouds. Even further, direct connections among edge nodes can be established and form fog computing to preprocess some data.
8.4.3 A Cloud Computing Architecture for the Smart Grid
In this subsection, we propose a a high‐level cloud computing architecture for the smart grid, as shown in Figure 8.5. For simplicity, the cloud is a whole picture of both the private and public portions of the hybrid cloud. The input data of the cloud includes metering data and other sensing data from the grid, as well as weather forecasts, information from social networks, and other useful data from outside. Different types of cloud services (e.g. SaaS) are provided in the cloud for different applications. The components of the cloud include data management systems, data storage systems, and processing tools.

Figure 8.5 A cloud computing architecture for the smart grid.
Much of the data management (e.g. data cleansing) is performed in the private portion of the cloud service to protect privacy of customers. The data storage system is separated in both the private and the public portions of the cloud, while the public part provides the most storage resources for big data. The processing tools for big data analytics, machine learning, and other techniques are mainly deployed in the public portion of the cloud to take advantage of the computing power available in the public cloud service.
8.5 Summary
In this chapter, we showed that big data is inevitable in smart grid communications. Applications such as demand response and modern control need the information provided by massive amounts of data. In particular, price and energy forecasts will be produced by big data analytics. Preliminary results were given to demonstrate the importance of big data analytics in energy forecasts. Besides demand response, attack detection in smart grid communications (especially monitoring networks) is critical for secure and efficient grid operations. Machine learning and data mining, as well as big data analytics, are useful tools to achieve attack detections for both metering data and sensing data. Thus, energy fraud and system failures can be prevented. Cloud computing was introduced in the chapter also as a way to accommodate big data analytics. An architecture with a hybrid cloud was proposed for that purpose.