
6.4 MPEG Surround decoder
6.4.1 Structure
The MPEG Surround decoder structure is outlined in Figure 6.8. The down-mix is first processed by a pre-gain, which is the inverse of the post-gain of the MPEG Surround encoder. Subsequently, the input signals are processed by an analysis filterbank that is identical to the filterbank described in Section 6.3.3. A spatial decoder regenerates multichannel audio by reinstating the spatial properties described by the decoded parameters. Finally, applying a set of synthesis filterbanks and post-gains (the inverse of the encoder pre-gains) results in the time domain multi-channel output signals.
6.4.2 Spatial decoder
Operation principle
The spatial decoder generates multi-channel output signals from the down-mixed input signal by reinstating the spatial cues captured by the spatial parameters. The spatial synthesis of OTT decoding blocks employs so-called decorrelators and matrix operations in a similar fashion as parametric stereo decoders [47]. In a OTT decoding block, two output signals with the correct spatial cues are generated by mixing a mono input signal with the output of a decorrelator that is fed with that mono input signal.
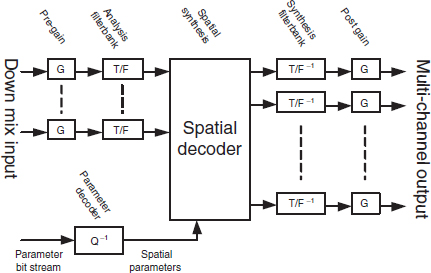
Figure 6.8 Structure of the MPEG Surround decoder. Reproduced by permission of the Audio Engineering Society, Inc, New York, USA.
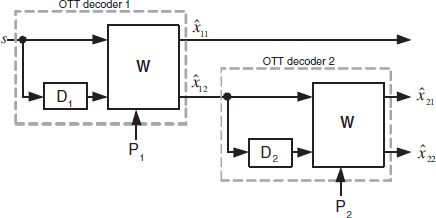
Figure 6.9 Concatenation of two OTT decoding blocks to achieve three-channel output. Reproduced by permission of the Audio Engineering Society, Inc, New York, USA.
Given the tree structures that were explained in Section 6.3.4, a first attempt for building a multi-channel decoder could be to simply concatenate OTT decoding blocks according to the tree structure at hand. An example of such a concatenation of OTT decoding blocks for three-channel output is shown in Figure 6.9. A mono input signal s is processed by a first decorrelator D1 and an up-mix matrix W(P1) to obtain two output signals ![]() 11,
11, ![]() 12 with spatial parameters P1:
12 with spatial parameters P1:

with

Signal ![]() 12 is subsequently processed by a second decorrelator D2, and mixed with
12 is subsequently processed by a second decorrelator D2, and mixed with ![]() 12 itself based on a second spatial parameter set P2 to generate two output signals
12 itself based on a second spatial parameter set P2 to generate two output signals ![]() 21,
21, ![]() 22:
22:

The up-mix matrices W ensure that their output pairs have the correct level difference as well as the correct correlation.
The correct output levels are obtained by scaling the two output signals according to the transmitted ICLD parameter, while the correct coherence is obtained by mixing the two input signals under the assumption that the output of each decorrelator gives an output that is statistically independent from its input, while having the same temporal and spectral signal envelopes. Consequently, both outputs ![]() 11,
11, ![]() 12 of up-mix matrix W(P1) will in many cases comprise signal portions of both inputs (i.e., the input signal s and the output of decorrelator D1). Output signal
12 of up-mix matrix W(P1) will in many cases comprise signal portions of both inputs (i.e., the input signal s and the output of decorrelator D1). Output signal ![]() 12 is subsequently processed by a second decorrelator D2 as input for up-mix matrix W(P2).
12 is subsequently processed by a second decorrelator D2 as input for up-mix matrix W(P2).
This scheme has the important drawback of decorrelators connected in series: the output of decorrelator D1 is (partly) fed into decorrelator D2. Given the most important requirement of decorrelators to generate output that is statistically independent from its input, its processing will result in a delay and temporal and/or spectral smearing of the input signals. In other words, the spectral and temporal envelopes of an input signal may be altered considerably, especially if the decorrelator contains reverberation-like structures. If two decorrelators are connected in series, the degradation of signal envelopes will be substantial. Moreover, since spatial parameters are temporally varying, temporal smearing and delays will cause an asynchrony between the signals and their parameters. This asynchrony will become larger if decorrelators are connected in series. Thus, concatenation of decorrelators should preferably be avoided.
Fortunately, the problem of concatenated decorrelators can be solved without consequences for spatial synthesis. Decorrelator D2 should generate a signal that is statistically independent from ![]() 12, which is a combination of s and the output of decorrelator D1. In other words, the output of D2 should be independent of both s and the output of decorrelator D1. This can be achieved by feeding decorrelator D2 with mono input signal s instead of
12, which is a combination of s and the output of decorrelator D1. In other words, the output of D2 should be independent of both s and the output of decorrelator D1. This can be achieved by feeding decorrelator D2 with mono input signal s instead of ![]() 12, if the decorrelators D1 and D2 are mutually independent. This enhancement is outlined in Figure 6.10.
12, if the decorrelators D1 and D2 are mutually independent. This enhancement is outlined in Figure 6.10.
The input of decorrelator D2 is now obtained directly from s with a gain λ2(P1) which compensates for the change in energy that would otherwise be caused by matrix W(P1):
![]()
Furthermore, it can be observed that signal ![]() 12, which is a linear combination of s and the output of decorrelator D1, is processed by matrix W(P2) without any intermediate decorrelation process. Given the linear properties of the two matrix operations, the contribution of s within
12, which is a linear combination of s and the output of decorrelator D1, is processed by matrix W(P2) without any intermediate decorrelation process. Given the linear properties of the two matrix operations, the contribution of s within ![]() 21 and
21 and ![]() 22 can be obtained by a single (combined) matrix operation by multiplication of the respective elements from W(P1) and W(P2). The statistical equivalence of both schemes can be shown by computing the covariance matrices of the output signals in both cases, which are identical. In summary, cascaded decorrelators can be shifted through preceding OTT decoding blocks without changing statistical properties such as signal levels and mutual correlations, under the assumption that the different decorrelators are mutually independent.
22 can be obtained by a single (combined) matrix operation by multiplication of the respective elements from W(P1) and W(P2). The statistical equivalence of both schemes can be shown by computing the covariance matrices of the output signals in both cases, which are identical. In summary, cascaded decorrelators can be shifted through preceding OTT decoding blocks without changing statistical properties such as signal levels and mutual correlations, under the assumption that the different decorrelators are mutually independent.
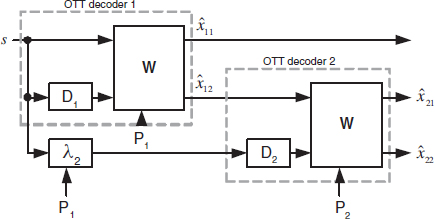
Figure 6.10 Enhanced concatenation of two OTT decoding blocks to achieve three-channel output with decorrelators in parallel. Reproduced by permission of the Audio Engineering Society, Inc, New York, USA.
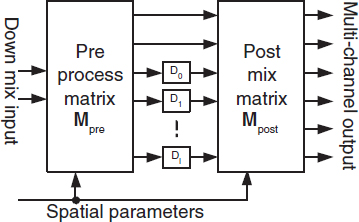
Figure 6.11 Generic spatial decoder. Reproduced by permission of the Audio Engineering Society, Inc, New York, USA.
The process of transforming spatial parameterization trees from cascaded decorrelator structures to decorrelators in parallel, extended with combined matrix multiplications leads to the generalized spatial decoder structure as shown in Figure 6.11. Any encoder tree configuration can be mapped to this generalized decoder structure. The input signals are first processed by a pre-process matrix Mpre, which applies decorrelator input gains as outlined in Figure 6.10, TTT-type decoding (in case of a stereo down-mix), as well as any decoder-side inversion processes that should be applied on the down-mix (see Section 6.2.2). The outputs of the pre-matrix are fed to a decorrelation stage with one or more mutually independent decorrelators. Finally a post-mix matrix Mpost generates the multi-channel output signals. In this scheme, both the pre-process matrix as well as the post-mix matrix are dependent on the transmitted spatial parameters.
Decorrelators
In all tree configurations some outputs of the mix-matrix Mpre are fed into decorrelators. These decorrelators create an output that is uncorrelated with their input. Moreover, in the case multiple decorrelators are used, they are conditioned such that their outputs will also be mutually uncorrelated (see Section 6.4.2). Figure 6.12 shows a diagram of the decorrelator processing that is performed on the hybrid domain signals.
The decorrelators comprise a delay (that varies in different frequency bands), a lattice all-pass filter, and an energy adjustment stage. The configuration for the delay and all-pass filter are controlled by the encoder using decorrelator configuration data. The all-pass coefficients of the different decorrelators were selected such that their output are mutually independent (even if the same signal is used as input).
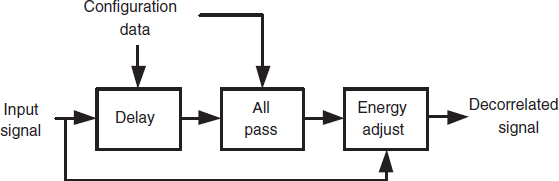
Figure 6.12 Diagram of decorrelator processing on hybrid QMF domain signals. Reproduced by permission of the Audio Engineering Society, Inc, New York, USA.
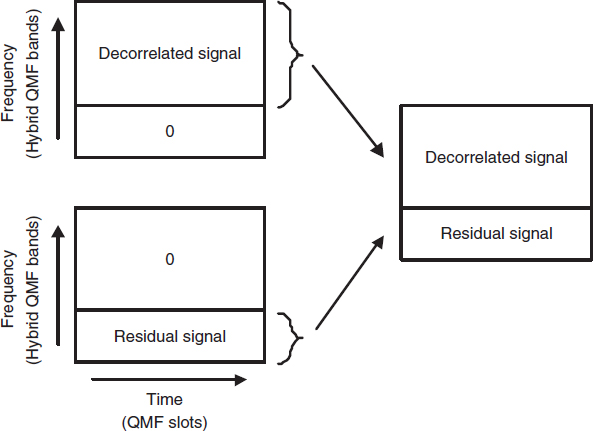
Figure 6.13 The decoder can generate a decorrelated signal with similar properties to those of the residual signal in frequency bands for which no residual is transmitted.
In order to avoid audible reverberation in the case of transients, an energy adjustment stage scales the output of the decorrelator to match the energy level of the input signal in all frequency (processing) bands.
If residual signals are transmitted for certain OTT or TTT decoding blocks, the outputs of the corresponding decorrelators are replaced by the decoded residual signals. This replacement is only applied for the frequency range of the transmitted residual signal. For the remaining bandwidth, the decorrelator output is maintained. This process is visualized in Figure 6.13.
OTT decoding block
The up-mix matrix W for an OTT decoding block is determined by the following constraints:
- The correlation of the two output signals must obey the transmitted ICC parameter.
- The power ratio of the two output signals must obey the transmitted ICLD parameter.
- The sum of the energies of the output signals must be equal to the energy of the input signal. Note that this constraint is slightly different from parametric stereo, where the mean of the energies of the output signals is equal to the energy of the input signal.
Given these three constraints, the 2 × 2 matrix W has one degree of freedom. One interpretation of this degree of freedom is a common rotation angle of the two output signals in a two-dimensional space spanned by the two input signals, in a similar way to that outlined in Section 5.5.2. The mix matrix W can be expressed using a common rotation angle β, a differential rotation angle α and two vector lengths λ1 and λ2:

Minimization of w12 +w22 leads to the following solution for β:

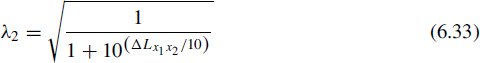
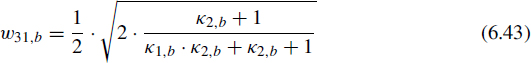
with α depending on the ICC parameter as outlined in Section 5.5.2, Equation 5.25. The variables λ1 and λ2, representing the relative amplitudes of the two output signals with respect to the input, are given by:
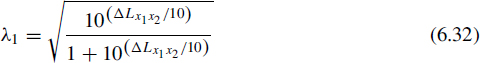
The solution for β implies that w12,i = −w22,i. In other words, the synthesis matrix can also be written for each parameter band b as:

Stated differently, the decorrelation signal level is identical in both output signals but the contribution to both output channels is in anti phase. Hence, this decoder synthesis matrix employs the same decomposition that was used at the encoder side (see Section 6.3.4), with the exception that the common out-of-phase component is now synthetically generated by decorrelation and scaling (with λ1 sin(α + β)).
OTT decoding block using residual coding
If for a certain parameter band a residual signal d1,m is transmitted, the decorrelator output is replaced by the transmitted residual signal and the corresponding matrix elements are set to +1 and −1, respectively, according to the corresponding signal decomposition at the encoder (see Section 6.3.4):

The fixed matrix weights for the residual signal of +1 and −1 (instead of the dynamic, parameter-dependent weights for the decorrelator outputs) make the system more robust against signal-reconstruction errors due to interpolation of mixing matrices (see Section 6.4.2). At the same time, the replacement strategy of residual signal and decorrelator output make the system scalable on a bitstream level. Due to the fact that the matrix elements for the down-mix remain the same (with or without residual signal), stripping of the residual signal from an encoded parameter stream results in a decoder output that is identical to the output that would have been obtained if encoding was performed without residual signals.
TTT decoding block using prediction mode
Three output signals ![]() l,
l, ![]() r,
r, ![]() c are synthesized according to the inverse encoder-side downmix matrix using an estimated signal ŝc:
c are synthesized according to the inverse encoder-side downmix matrix using an estimated signal ŝc:
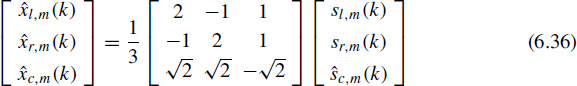
with
![]()
m the filter band index, b the processing band index and d1,m the residual signal. The resulting up-mix matrix W is then given by:
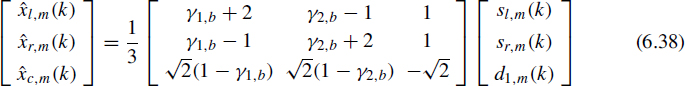
If no residual signal was transmitted, the resulting energy loss can be compensated for in two ways, depending on the complexity of the decoder. The first, low-complexity solution is to apply a gain to the three output signals according to the prediction loss. In that case, the up-mix matrix is given by:
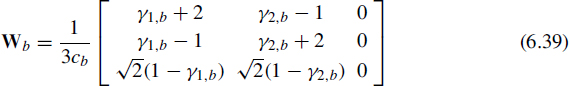
This method does ensure correct overall power, but the relative powers of the three output signals, as well as their mutual correlations, may be different from those of the original input signals.
Alternatively, the prediction loss can be compensated for by means of a decorrelator signal. In that case, the (synthetic) residual signal d1,m of Equation (6.38) is generated by decorrelators fed by the two down-mix signals (only for those frequency bands for which no transmitted residual signal is available). This more complex method reconstructs the full covariance structure of the three output signals.
TTT decoding block based on energy reconstruction
TTT decoding based on energy reconstruction (henceforth called energy mode) supports two methods. These methods are characterized by the way the up-mix matrix is derived, using the same (transmitted) parameters. The bitstream header signals which method should be used.
In the energy mode without center subtraction, the left and right output signal are calculated from the left and right down-mix signal, respectively. In other words, the left output signal is generated independently from the right input channel and vice versa. The center signal is a linear combination of both down-mix signals. This method should be used if at least a certain frequency range the legacy stereo coder does not have waveform-preserving properties (for example when using SBR). The up-mix process is given by:
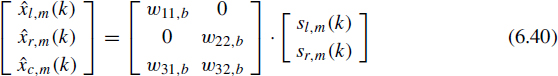
The matrix elements are given by:


with
![]()
The energy mode with center subtraction, on the other hand, tries to improve the reconstruction of the left and right signals by utilizing cross-terms. This method is especially beneficial if the core coder is at least partly preserving the waveforms of its input. More details on this method are given in [126].
MTX inversion block
If the transmitted down-mix is encoded using a matrixed surround conversion block (see Section 6.3.4), the stereo input signal is processed by a matrixed surround inversion matrix W which is the inverse of the encoder-side conversion matrix V:
![]()
External down-mix inversion block
If an external down mix was provided, the external down-mix inverter aims at reconstructing the (discarded) automated down-mix from the transmitted external down-mix. The reconstructed down-mix signal ŝi,m for channel i is given by:

with κi,b dependent on the external down-mix gain parameter ΔLsiei,b according to Equation (6.45) for parameter band b and down-mix channel i, ei,m the transmitted external down mix, di,m the external down-mix residual for channel i (if available) and η is computed using the decision regarding absolute or relative coding of the residual signals (if available).
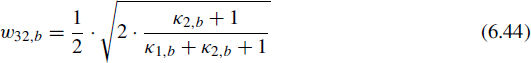
Matrix elements for a mono down-mix
The construction of pre- and post-mix matrices for the mono-based tree as outlined in the left panel of Figure 6.5 is outlined in Figure 6.14. The gain compensation factors for decorrelator inputs resulting from cascaded OTT blocks are applied in the pre-mix matrix Mpre. The LFE signal is not subject to decorrelation and hence its output signal is solely constructed using gain factors resulting from all respective OTT blocks. If an external down-mix was provided, the external down-mix inversion block is combined with Mpre as well (not shown in Figure 6.14).
The mixing matrices W for each OTT decoding block are combined in a single postmix matrix Mpost. This process can be performed for any OTT tree structure, including trees with more than six input or output channels.
Matrix elements for a stereo down-mix
The construction of the pre- and post-mix matrices for a stereo-based tree is shown in Figure 6.15. The pre-mix matrix comprises the combined effect of matrixed surround inversion (MTX) or external-down mix inversion (EXT) and the TTT decoding process. The left and right outputs of the TTT output signals are subsequently fed to parallel decorrelators. The post-mix matrix is then composed of three parallel OTT blocks. The OTT decoding block for the center and the LFE channel does not have a decorrelator input since no correlation synthesis between center and LFE is applied (i.e., the respective ICC values are set to +1).
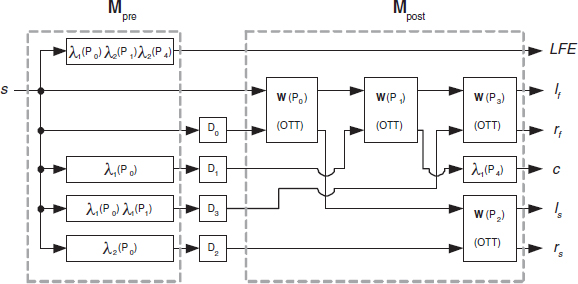
Figure 6.14 Pre- and post-matrix construction for a mono-based tree configuration. Reproduced by permission of the Audio Engineering Society, Inc, New York, USA.
Figure 6.15 Pre- and post-matrix construction for a stereo-based tree configuration. Reproduced by permission of the Audio Engineering Society, Inc, New York, USA.
Parameter positions and interpolation
For each transmitted parameter set the mixing matrices are determined as described previously. Similar to the approach pursued in Parametric Stereo (see Chapter 5), these matrices correspond in most cases to a single time instance, which depends on the segmentation and windowing procedure of the encoder. For QMF sample indices (k) in between parameter positions, the mixing matrices Mpre and Mpost are interpolated linearly (i.e. its real and imaginary parts are interpolated individually). This interpolation of mixing matrices has the advantage that the decoder can process each ‘slot’ of hybrid QMF samples (i.e. one sample from each sub-band) one by one, without the need of storing a whole frame of sub-band samples in memory. This results in a significant memory reduction compared to frame-based synthesis methods.
6.4.3 Enhanced matrix mode
MPEG Surround features an analysis element that is capable of estimating spatial parameters based on a conventional or matrixed surround compatible down-mix. This element enables MPEG Surround to work in a mode that is similar to matrixed surround systems, i.e., by means of a matrixed surround compatible down-mix without transmission of additional parameters, or alternatively, to generate multi-channel representations from legacy stereo material. For such a mode, the MPEG Surround decoder analyzes the transmitted (stereo) down-mix and generates spatial parameters that are fed to the spatial decoder to up-mix the stereo input to multi-channel output. Alternatively, this analysis stage can be employed already in the encoder to enable multi-channel audio transmission in MPEG Surround format based on conventional stereo source material.
A spatial decoder using this enhanced matrix mode is shown in Figure 6.16. The spatial parameters required to compute the matrix elements of the pre- and post-mix matrix are generated by an analysis module A. The analysis module measures two parameters of the received down-mix for each parameter band. These parameters are the down-mix level difference ΔLs1s2,b and the down-mix cross-correlation cs1s2,b. To avoid analysis delays, these parameters are estimated using first-order filtering involving data from the past.
Three (parameter-band dependent) states are updated whenever a new slot of downmix signals is received. These states comprise the signal power psi,b of each down-mix channel:
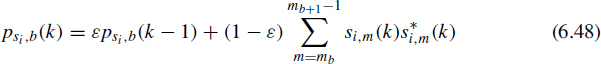
as well as the cross-spectrum χ2s1s2b(k):
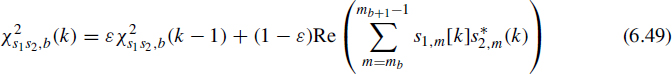
The coefficient ε determines the adaptation speed, which is based on a time constant of T = 60 ms:
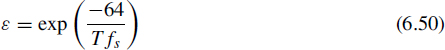
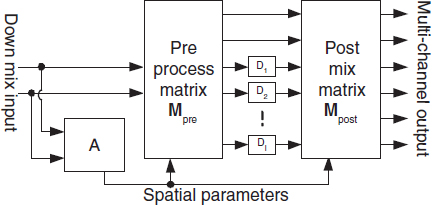
Figure 6.16 MPEG Surround spatial decoder using the enhanced matrix mode. Reproduced by permission of the Audio Engineering Society, Inc, New York, USA.
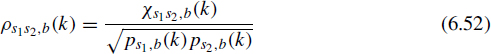
Every fourth slot, the current states psi,b and χ2s1s2,b are converted to a level difference ΔLs1s2,b and a normalized cross-correlation coefficient ρs1s2,b:

These down-mix parameters are subsequently converted to indices for a table lookup of the spatial parameters (i.e., for the matrixed surround inversion stage, and the subsequent TTT and OTT decoding elements) required for multi-channel reconstruction. The parameter position for this newly generated parameter set equals the current analysis position plus four slots (i.e., k + 4).
The lookup tables resulted from a ‘training process’ in which a very large set of multi-channel material was encoded using an MPEG Surround encoder using the MTX conversion block. Subsequently, the spatial parameters that resulted from the encoding process, as well as the down-mix parameters ΔLs1s2,b and ρs1s2,b were analysed and stored in a database. From this database, histograms were constructed for the distribution for each MPEG Surround parameter given a specific combination of the down-mix parameters of a certain time–frequency tile. Such a histogram (normalized to obtain an estimate of the probability distribution function, or PDF) is shown in Figure 6.17. All values for the CLD and ICC between the left front and left surround channels were selected in case the down-mix CLD (ΔLs1s2,b) was between −0.5 and +0.5 dB, and the down-mix correlation (ρs1s2,b) was between −0.05 and +0.05. The observations were pooled across frequency bands and analysis frames and across all encoded audio excerpts. The resulting PDF for the front-surround CLD is shown in the top panel of Figure 6.17, while the PDF for the front-surround ICC is shown in the lower panel.
Interestingly, both the CLD and ICC between lf and ls have a distribution with a clearly identifiable peak value. In other words, given ΔLs1s2,b = 0 and ρs1s2,b = 0, certain spatial parameter values between lf and ls seem to occur more often than others. Thus, if spatial parameters are unknown, a best guess for the CLD and ICC between lf and ls in this case would comprise a certain metric to describe the most probable value given the PDFs shown in Figure 6.17, such as their mean or mode. This best guess can then be obtained for a wide range of down-mix parameters, and for each MPEG Surround parameter individually. The result of such a procedure is outlined in Figure 6.18. The CLD between lf and ls (represented by different grey shades) is given as a function of the down-mix parameters. Only positive values for the down-mix CLD are shown.
Figure 6.18 has several interesting properties. For example, if the down-mix has a correlation close to −1, and both down-mix channels have approximately equal power (represented by the top left corner of the figure), the front-surround CLD is in most cases between −15 and −25 dB. In other words, the surround channels contained considerable more energy than the front channels. This is in line with what one would expect from a matrixed surround encoder (and thus the MTX conversion stage): the surround channels are mixed in anti-phase in the down-mix, hence resulting in a negative correlation if the surround channels are dominant in terms of energy.
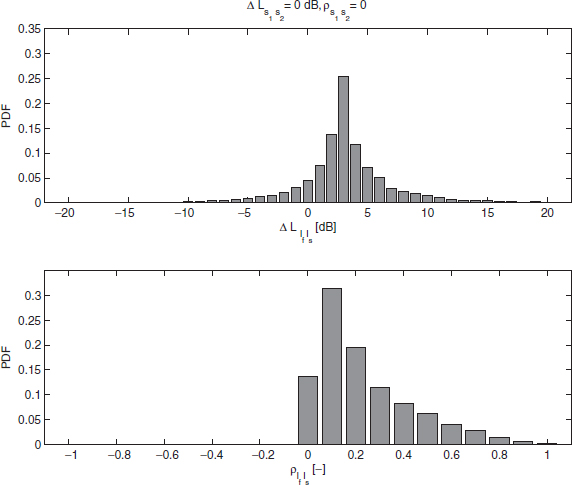
Figure 6.17 Probability distribution function for the CLD (top panel) and ICC (lower panel) between lf and ls in case the down-mix parameters amount to ΔLs1s2,b = 0 and ρs1s2,b = 0.
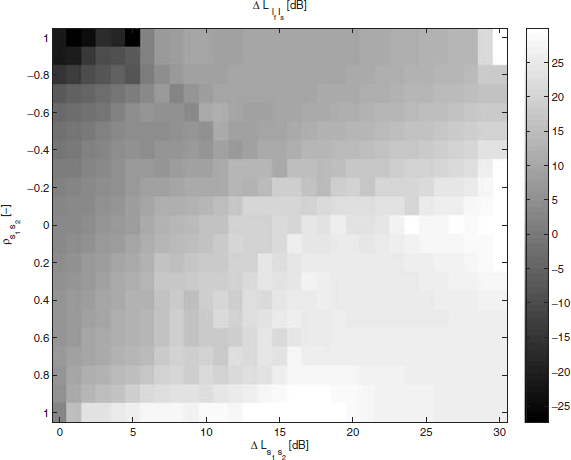
Figure 6.18 Value for the CLD between lf and ls as a function of the down-mix parameters ΔLs1s2,b and ρs1s2,b.
On the other hand, if the down-mix correlation is close to +1 and there exists a strong level difference between the down-mix channels (lower-right corner), the CLD between front and surround channels is positive, indicating that the surround channels are virtually inactive. For down-mix parameters in between, there exists a gradual change between front-only and surround-only activity, with an exception of the top-right corner, which indicates front-only activity.