
With Graphite and Grafana up and running, we are now ready to start configuring our application in order to send the metrics to the Graphite listener on port 2003. To do this, we will use the Codahale/Dropwizard metrics library, which is fully supported by Spring Boot and thus requires a minimum amount of configuration:
- The first thing on our list is to add the necessary library dependencies. Extend the dependencies block in the build.gradle file with the following content:
compile("io.micrometer:micrometer-registry-graphite:latest.release")
- Create a file named MonitoringConfiguration.java in the src/main/java/com/example/bookpub directory at the root of our project with the following content:
@Configuration
@ConditionalOnClass(GraphiteMeterRegistry.class)
public class MonitoringConfiguration {

    private static final Pattern blacklistedChars =
                         Pattern.compile("[{}(),=[]/]");

    @Bean
    public MeterRegistryCustomizer<GraphiteMeterRegistry>
                              meterRegistryCustomizer() {
        return registry -> {
           registry.config()
             .namingConvention(namingConvention());
        };
    }

    @Bean
    public HierarchicalNameMapper hierarchicalNameMapper(){
        return (id, convention) -> {
            String prefix = "bookpub.app.";
            String tags = "";

            if (id.getTags().iterator().hasNext()) {
                tags = "."
                        + id.getConventionTags(convention)
                        .stream()
                        .map(t -> t.getKey() + "."
                                                + t.getValue()
                        )
                        .map(nameSegment ->
                                 nameSegment.replace(" ", "_")
                        )
                        .collect(Collectors.joining("."));
            }

            return prefix
                   + id.getConventionName(convention)
                   + tags;
        };
    }

    @Bean
    public NamingConvention namingConvention() {
        return new NamingConvention() {
            @Override
            public String name(String name,
                               Meter.Type type,
                               String baseUnit) {
                return format(name);
            }

            @Override
            public String tagKey(String key) {
                return format(key);
            }

            @Override
            public String tagValue(String value) {
                return format(value);
            }

            private String format(String name) {
                String sanitized =
                   Normalizer.normalize(name,
                                    Normalizer.Form.NFKD);
                // Changes to the original
                // GraphiteNamingConvention to use "dot"
                // instead of "camelCase"
                sanitized =
                   NamingConvention.dot.tagKey(sanitized);

                return blacklistedChars
                           .matcher(sanitized)
                           .replaceAll("_");
            }
        };
    }
}
- We will also need to add the configuration property settings for our Graphite instance to the application.properties file in the src/main/resources directory at the root of our project:
management.metrics.export.graphite.enabled=true
management.metrics.export.graphite.host=localhost
management.metrics.export.graphite.port=2003
management.metrics.export.graphite.protocol=plaintext
management.metrics.export.graphite.rate-units=seconds
management.metrics.export.graphite.duration-units=milliseconds
management.metrics.export.graphite.step=1m
- Now, let's build and run our application by executing ./gradlew clean bootRun and if we have configured everything correctly, it should start without any issues.
- With the application up and running, we should start seeing some data that is in the Graphite and bookpub data nodes getting added to the tree under metrics. To add some more realism, let's open our browser and load a book URL, http://localhost:8080/books/978-1-78528-415-1/, a few dozen times to generate some metrics.
- Let's go ahead and look at some of the metrics in Graphite and set the data time range to 15 minutes in order to get some close-look graphs, which will look similar to the following screenshot:

- We can also create some fancy looking dashboards using this data in Grafana by creating a new dashboard and adding a Graph panel, as shown in the following screenshot:

- The newly created Graph panel will look like this:
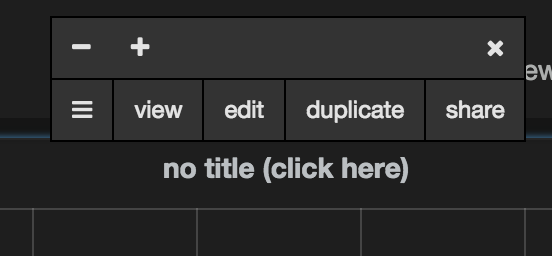
- Click on the no title (click here) label, choose edit, and enter the metric name bookpub.app.http.server.requests.exception.None.method.GET.status.200.uri._books__isbn_.count in the text field as shown in the following screenshot:

- Clicking on Dashboard will take you out of the edit mode.
For a more detailed tutorial, visit http://docs.grafana.org/guides/gettingstarted/.