C.7. From Chapter 12

t Test of Two Sample Averages 1, and 2, Variables Data


1 and 2 are two sample averages.

s1 and s2 are the sigmas on the two samples.

n1 and n2 are the two sample sizes.

|1 - 2| is the absolute difference between the averages, ignoring a minus sign in the difference.

We then compare this calculated t-test value against the value in the simplified t distribution table (Figure 12-2). If our calculated t-test number is greater than the value in the table, then we are 95% confident that the sample averages are significantly different.


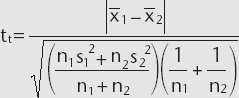
C.7.1. Use on Problem Type

Use this formula on variables data when you want to test if two sample averages are significantly different. We compare the calculated result from the above formula with the values in the simplified t distribution table (Figure 12-2) to determine if there is a statistically significant difference between the two.

This formula is normally used after we have already compared the plots of data from both of the samples and are satisfied that the shapes of the two distributions of data are not dramatically different and after an F test of sigma did not show a significant difference.

..................Content has been hidden....................

You can't read the all page of ebook, please click here login for view all page.
Reset
18.219.103.183