
12.3. CHECKING FOR A CHANGE BETWEEN TWO SAMPLES
We sometimes want to compare samples from two similar processes or from one process at different times. As in comparing a sample with a population, we do three steps in checking for a change between two samples.
Check the distributions to see if they are substantially different.
If the distribution shapes are not substantially different, then see if the sigmas are significantly different.
If neither of the above tests shows a difference, then check if the averages are significantly different.
If we see a difference at any of the above steps, it is important to know, since it affects costs, quality, etc.
1. Checking the Distributions
First, it may be necessary to plot a large number of individual measurements to verify that the sample distribution shapes are similar. Although a process distribution will normally be similar over time, it is important to verify this, especially when running a test after a policy change, machine wreck, personnel change, etc. We are concerned only about gross differences, like one plot being very strongly skewed or bimodal versus the other. If plotting is required, it will need a sample size of at least 36. If there is a substantial change in the distribution, we know the process has changed and we should be trying to understand the change cause and ramifications.
2. Checking the Sigmas
If the sample distributions have not changed qualitatively (looking at the plots), then you can do some quantitative tests. The first thing to check is if the sigma has changed significantly. The sigma on a process does not normally change unless a substantial basic change in the process has occurred. To see if the sigma has changed, we do an F test.
NOTE
F Test Comparing Two Sample's Sigma s
![]() (put the larger s on top, as the numerator)
(put the larger s on top, as the numerator)
s1 = sample with the larger sigma
s2 = sample with the smaller sigma
The sample sizes n should be within 20% of each other. There are tables and programs that allow for greater differences, but since you control sample sizes and get more reliable results with similar sample sizes, these other tables and programs are generally not needed.
Compare this Ft with the value in the following simplified F table (Figure 12-3). If the Ft value exceeds the table F value, then the sigmas are significantly different.
Simplified F table (95% confidence) for comparing sigma from two samples (sizes = n1 and n2) (sample sizes equal within 20%)
If the calculated Ft value exceeds the table value, assume a difference.
Problem #7
Suppose that in our now-familiar shaft example we take two samples. (They could be from one lathe, or from two different lathes doing the same job.) We have already plotted the samples and found that the shape of the distributions were not substantially different. We now want to know if the sample sigmas are significantly different with a 95% confidence.
| Sample 1 | Sample 2 |
|---|---|
| s1 = 0.00273" | s2 = 0.00162" |
| n1 = 21 | n2 = 19 |
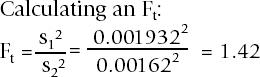
As before, we must first check the sigma to see if the two processes are significantly different. We therefore calculate the F test value and compare this with the value in the simplified F table (Figure 12-3).
Since our sample sizes are within 20% of each other, we can use the previous formula.
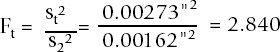
We now compare 2.840 with the value in the simplified F table (Figure 12-3). Use the average n = 20 to find the table value, which is 2.17. Since our calculated value is greater than the table value, we can say with a 95% confidence that the two processes' sigmas are different. We must now decide what the cause and ramifications are of this change in the sigma.
Problem #8
Suppose that in our shaft example we take two samples. (They could be from one lathe or from two different lathes doing the same job.)
We have already plotted samples and found that the distributions are not substantially different. We now want to know if the sample sigmas are significantly different with a 95% confidence.
| Sample 1 | Sample 2 |
|---|---|
| s1= 0.00193" | s2 = 0.00162" |
| n1 = 21 | n2 = 19 |
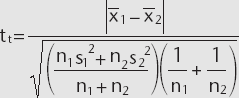
We now compare 1.42 to the value in the Simplified F Table (Figure 12-3). Use the average n = 20 to find the table value, which is 2.17. Since 1.42 is less than the table value of 2.17, we can't say with a 95% confidence that the processes are different (with regard to their sigmas).
We now test to see if the two sample averages are significantly different.
3. Checking the Averages
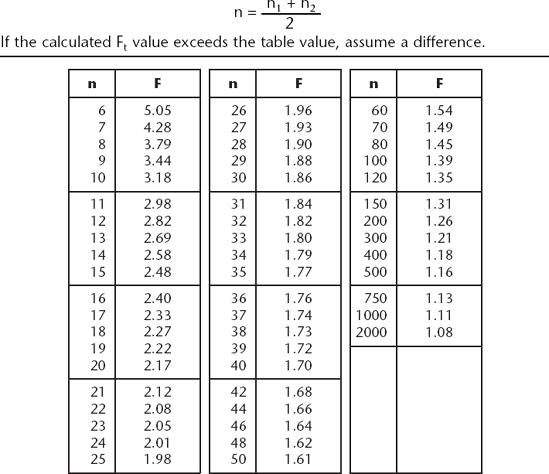
Since we did not find that either the distribution shape or sigma had changed, we now test whether the two sample averages are significantly different. We calculate a t-test value (tt) to compare with a value in the Simplified t Distribution Table (Figure 12-2).
NOTE
![]() 1 and
1 and ![]() 2 are two sample averages.
2 are two sample averages.
s1 and s2 are the sigmas on the two samples.
n1 and n2 are the two sample sizes.
![]() is the absolute difference between the averages, ignoring a minus sign in the difference.
is the absolute difference between the averages, ignoring a minus sign in the difference.
We then compare this calculated t-test value against the value in the simplified t distribution table (Figure 12-2). If our calculated t-test number is greater than the value in the table, then we are 95% confident that the sample averages are significantly different.
Returning to problem #8, we must calculate our test tt:
| s1 = 0.00193" | s2 = 0.00162" |
| n1 = 21 | n2 = 19 |


We now compare this 4.24 with the value from the simplified t distribution table (Figure 12-2). (Use n = n1 + n2 – 1 = 39.) Since the calculated 4.24 is greater than the table value of 2.024, we can conclude with a 95% confidence that the two process means are significantly different.
We would normally want to find out why and decide what we are going to do with this knowledge.
|
