
7.10. Conclusion
7.10.1. Overview of Policy Structure
The model diagrams presented earlier in the chapter (Figure 7.14, Figures 7.15 and 7.18) are quite detailed and show all the concepts used in the equations. As mentioned in Chapter 5, sometimes it is useful to stand back from the formulation detail and compress all the symbols contained within a given policy (the grey regions in Figure 7.14, Figures 7.15 and 7.18) into a single macro policy function. This overview of policy structure gives a feel for how dominant information flows (arising from bounded rationality and characteristic traits of decision making in the organisation) translate into feedback structure.
Figure 7.31. Overview of policy structure driving growth
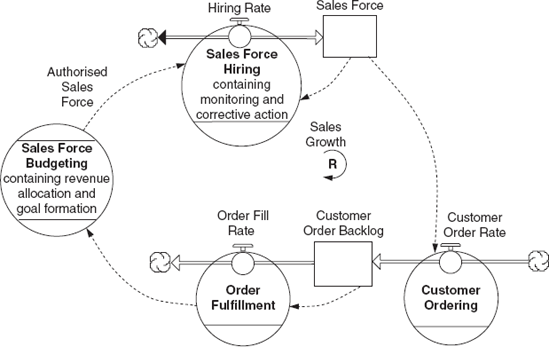
Figure 7.31 is an overview of policy structure driving growth. It shows four main policies: sales force hiring, sales force budgeting, order fulfilment and customer ordering. The management team of any manufacturing company employing a professional sales force will recognise these processes of decision making individually and be able to discuss them in depth without the need to think algebraically. What the management team and the modeller need to discover is how these processes fit together, without losing sight of the processes themselves. This particular diagram shows clearly how the reinforcing sales growth loop arises because sales force hiring is driven by a revenue budget and customer orders are driven by sales force.
Figure 7.32 is important because it extends across the functional boundary between sales and manufacturing, covering territory that is rarely seen in a unified way. Here a useful structural insight is simply that customer ordering is linked to order fulfilment, production capacity and capacity utilisation. Orders that cannot be filled immediately accumulate in a customer order backlog. In itself that statement is just common sense, but backlog sits at the strategic interface between the customer and the factory. In the diagram it is centre stage, but in practice it is virtually invisible, stored somewhere in a database and not even appearing on the balance sheet (where it might attract critical attention). This shadowy variable is the invisible hand responsible for balancing supply and demand in the medium to long term. The diagram shows its mediating role clearly. On the demand side it feeds back through delivery delay to influence customer ordering, creating the balancing loop labelled limits to sales growth. On the supply side it influences order fulfilment by exerting exerts pressure on factory managers to increase capacity utilisation.
Figure 7.32. Overview of policy structure constraining growth
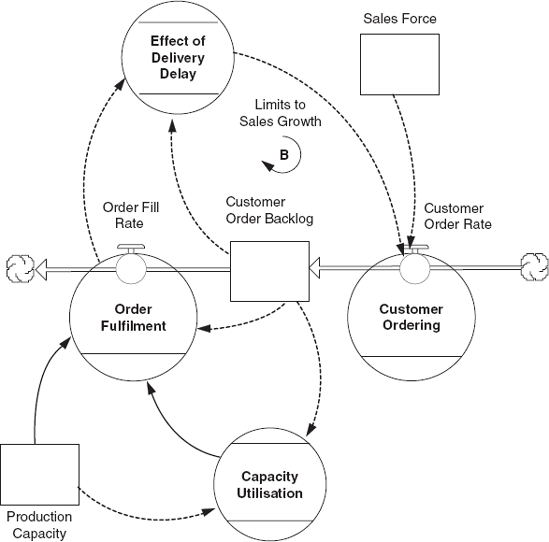
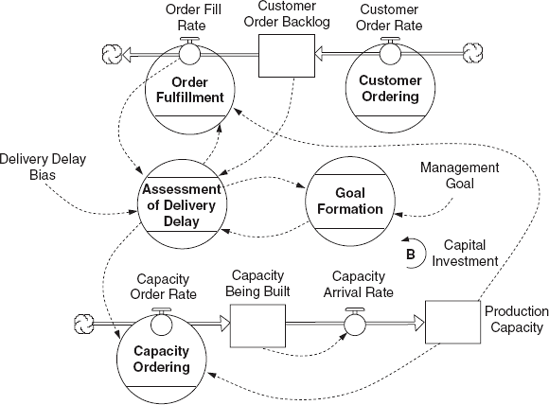
Figure 7.33 is an overview of policy structure for reactive capital investment. This picture takes us to the core of the coordination problem in the market growth model. It shows five operating policies: capacity ordering, assessment of delivery delay, goal formation, order fulfilment, and customer ordering. In some form or another all factories use policies like these to adjust capacity to customer demand. In a normal healthy and profitable business if demand grows then firms recognize the increase and build more capacity. This economic logic applies equally to manufacturing and service firms. But how is the demand signal transmitted from customers to the group of top executives who approve investment and hold the purse strings? The overview diagram addresses this question. It says that all firms define for themselves some metric for recognising a capacity shortage. This metric involves assessment of the supply–demand balance and goal formation to set an appropriate standard for this balance. From the assessment comes the information to drive capacity ordering. In this particular case, delivery delay is the metric for recognising a capacity shortage and, by comparing delivery delay with an operating goal, management is able to take corrective action leading to investment or disinvestment. What is particularly interesting in this diagram is to contemplate alternative information sources for accomplishing the same corrective action and to reflect on why the company has adopted its particular investment approach. For example, it is quite easy to imagine capacity utilisation (rather than delivery delay) as the metric for recognising a capacity shortage. Why not this metric? What is so important about delivery delay for this company that it grabs managerial attention? What difference would it make if utilisation were the metric? What would be the goal formation process for 'target' utilisation? An entirely different approach is to use sales force as a proxy for potential demand and to gear up capacity accordingly? In this case the goal formation process might define target capacity in terms of sales force size. An assessment of the supply–demand balance would be a matter of comparing target capacity with existing capacity and investing to correct any perceived gap. Would the top management team believe in a speculative estimate of demand arising from sales force size? What form would their conservative investment bias take if presented with such information?
Figure 7.33. Overview of policy structure for reactive capital investment
These overviews of policy structure conclude the chapter on the market growth model. By composing models in terms of operating policies, modellers can harness a great deal of practical managerial knowledge in their quest for realistic feedback structure.
7.10.2. Growth and Underinvestment at People Express?
This has been a long chapter with new and abstract concepts like bounded rationality, behavioural decision making and information filters. These concepts help modellers to identify, from the overwhelming flux of information in business and society, those few information channels that shape decision making and action in real world situations. The more finely modellers can discriminate between attention-grabbing information flows (that are truly influential in real-world decision making and action) and those information flows that managers and business leaders ignore, then the more plausible will be the information feedback structures they discover and the better the resulting models. The abstract material in this chapter is important. I always say to MBA and Executive MBA students at London Business School that if they really understand the structure, formulations and simulations of the market growth model they are well on their way to becoming a good system dynamics modeller and an effective conceptualiser of complex situations in business and society (a valuable skill in its own right).
But simply reading about these abstract concepts and experimenting with a pre-built model is not enough. It is important to practise and use the concepts in real world situations. Here I suggest readers set aside a chunk of time to return to the People Express case mentioned at the end of Chapter 6. The rise and fall of People Express can be viewed as a growth coordination problem, not unlike the situation in the market growth model. Which strategic resources get out of balance and why? If the fate of People Express is an example of growth and underinvestment then where, in the company's operating policies, is the locus of underinvestment? How did People Express achieve such spectacular growth over five years only to collapse? We can be sure that CEO Don Burr and his management team did not deliberately underinvest in any aspect of the business to cause its collapse. The company's officers wanted profitable growth, particularly the CEO. To probe this paradox, I suggest that readers first review the original Harvard Business School case study (cited in the references for Chapter 6) to formulate a dynamic hypothesis. Then use the materials and airline model components in the CD folder for Chapter 6 to develop a personalised People Express model that is capable of explaining the company's rise and fall.
7.10.3. More Examples of Growth Strategies that Failed or Faltered
Other models in the system dynamics literature also probe strategic coordination problems that lie behind failures of companies to grow as quickly as intended.[] Two I am most familiar with come from practical applications projects. One project (reported in Morecroft, 1986) investigated periodic downturns facing a high technology materials handling company located in Salt Lake City, Utah and traced them to overexpansion of rookie rivals who undermined the industry's reputation. The feedback loops believed responsible for the company's varying fortunes were outlined in Chapter 2, Figure 2.12. The other project (reported in Morecroft, Lane & Viita, 1991) examined the faltering growth strategy of a biotechnology start-up firm located to the west of London and owned by Royal Dutch/Shell. This tiny company belonged in Shell's portfolio of promising non-traditional businesses (i.e. not in oil) that Shell managers were nurturing to learn about new technologies and markets. Many they would sell-on as seedlings, but they hoped a few would grow in ways that would fit the Shell Group. Hence, the project was an effort to understand the drivers and limits to growth. The biotechnology start-up firm (codenamed Bio-Industrial Products (BIP)) seemed to present a clear case of capital underinvestment (the same as the market growth model) but intriguingly the collective reluctance of senior management to invest stemmed from inherent uncertainty about the true operating capacity of the company's fermentation vessels (in which microbes were cultivated for use in the company's grease-eating products). Even the scientists and technologists operating the vessels did not know the factory output capacity to an accuracy any better than an order of magnitude; which is like Ford of Europe saying it does not know if the potential output of an assembly plant is 10 000 or 100 000 cars per year! This technological uncertainty made it difficult for BIP executives to mount a convincing case at Shell headquarters for capital investment funding.
[] Growth coordination during corporate diversification also presents important strategic management challenges that can be interpreted as variations on growth and underinvestment in a single business. This topic is explored in Gary (2000, 2005).