
3.2. The Coordinating Network
Feedback loops are formed when stock and flow networks interact through causal links, in other words when the inflows and outflows of one asset stock depend, directly or indirectly, on the state or size of other asset stocks. In principle, all the stocks and flows in an organisation are mutually dependent because conditions in one area or function may cause or require changes elsewhere. For example, in BBC World Service the more staff employed, the more hours are available for programme making. This extra staff effort results in a gradual increase in programme quality. Better programmes eventually attract more listeners. In this case, the stock of staff affects the inflow to programme quality (an intangible asset) that in turn affects the inflow to the stock of listeners. Coordination is achieved through a network that relays the effect, direct or indirect, of particular stocks on a given flow. The symbols used for the coordinating network are shown on the left of Figure 3.6. A causal link is drawn as an arrow with a solid line, exactly the same as in a causal loop diagram. An information flow is drawn as an arrow with a dotted line. It too depicts an influence of one variable on another, though in a subtly different way.
A converter represents a process that converts inputs into an output and is depicted as a circle. Converters receive causal links or information flows and transform them according to whatever rules, physical laws or operating policies apply. In a simulator there is an equation behind each converter that specifies the rules. For example, a converter to represent water temperature in a shower model receives, as inputs, flows of hot and cold water. The converter combines these inputs to yield the water temperature. The process can be expressed quantitatively in an equation, derived from physical laws, that computes water temperature as a function of the flows of hot and cold water. Another example is a converter to represent the relative price of two competing products, say well-known brands of beer. In this case the converter receives information about the shelf price of each beer and then computes the ratio.
Figure 3.6. Symbols in the coordinating network that connects stocks and flows
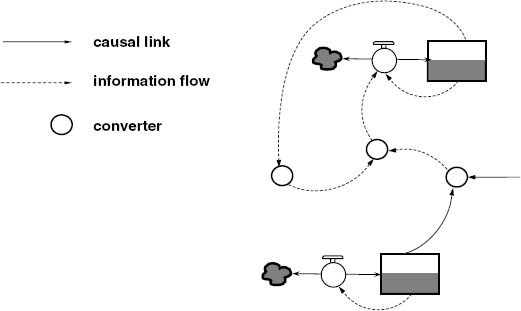
The diagram on the right of Figure 3.6 shows how all the symbols fit together. There are two stock and flow networks joined by a coordinating network containing three converters. This is a feedback representation because the two flow rates not only accumulate into the two stocks but are themselves regulated by the magnitude of the stocks. The picture can readily be extended from two to 20 stocks or more depending on the complexity of the situation at hand. No matter how large the picture, it captures an elaborate process of bootstrapping that arises from nothing more than cause, effect, influence and accumulation found in all organisations.