3.4. Equation Formulations
The final step in developing a simulator is to write algebraic equations. Diagrams are a good starting point because they show all the variables that must appear in the equations. Nevertheless, there is skill in writing good algebra in a way that properly captures the meaning of the relationships depicted.
3.4.1. Drug-related Crime
Consider the formulation of drug-related crime. We know from the diagram that drug-related crime depends on the funds required (by addicts) to satisfy their addiction and on the average yield per crime incident. These two influences are reproduced in Figure 3.12, but how are they combined in an equation? Should they be added, subtracted, multiplied or divided? The top half of Figure 3.12 is a plausible formulation where drug-related crime is equal to funds required divided by average yield. This ratio makes sense. We would expect that if addicts require more funds they will either commit more crimes or else operate in a neighbourhood where the yield from each crime is greater. Hence, funds required appears in the numerator and average yield in the denominator. The ratio expresses precisely and mathematically what we have in mind.
An alternative formulation, such as the product of 'funds required' and 'average yield', contradicts common sense and logic. A simple numerical example shows just how ludicrous such a multiplicative formulation would be. Let's suppose there are 10 addicts in a neighbourhood and collectively they require £1000 per month to satisfy their addiction. On average, each crime incident yields £100. A multiplicative formulation would imply that drug-related crime in the neighbourhood is (1 000 * 100), in other words one hundred thousand – which is numerically implausible and wrong. The correct formulation results in (1 000/100), or 10 incidents per month.
There are numerous guidelines for equation formulation to help modellers write good algebra that means what they intend. One of the most useful is to ensure dimensional consistency among the units of measure in an equation. This guideline is always useful in situations like the one above where the main formulation challenge is to pick the right arithmetical operation. Dimensional consistency requires that the units of measure on left and right of an equation match. In this case, 'drug-related crime' on the left is measured in incidents per month. So the operation on the right must combine 'funds required' and 'average yield' in such a way as to create incidents per month. Taking the ratio of funds required [£/month] to average yield [£/incident] achieves this outcome, as shown in the inset of Figure 3.12. No other simple arithmetic operator such as +, −, or * leads to this result. For example, the units of measure for a multiplicative formulation would be £2 per month per incident, a bizarre and meaningless metric that reveals a fatal formulation error.
Figure 3.12. Equation formulation for drug-related crime
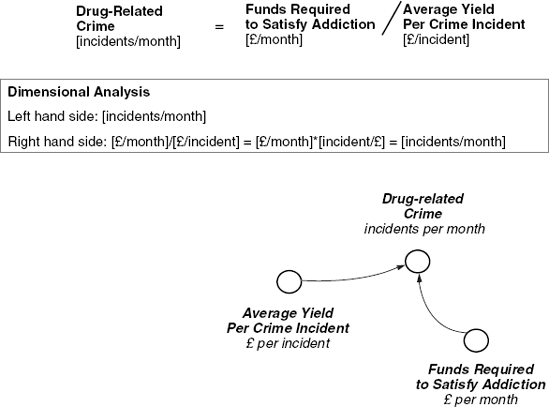
Figure 3.13. Formulation of funds required

3.4.2. Funds Required to Satisfy Addiction
The formulation for funds required is shown in Figure 3.13. We know from the diagram that 'funds required' depends on demand for drugs and the street price. The greater the demand, or the higher the street price, the more funds required. Moreover, a combination of greater demand and higher street price calls for even more funds and therefore suggests a multiplicative formulation. Thus, the equation for 'funds required' is expressed as the product of demand for drugs and the street price. A dimensional analysis shows the units of measure are consistent in this formulation.
3.4.3. Street Price and Price Change
The street price of drugs is a stock that accumulates price changes. The change in street price is a function of street price itself and 'pressure for price change'. This pressure depends on the drug supply gap, in other words whether there is an adequate supply of drugs on the street. The diagram and corresponding equations are shown in Figure 3.14. The first equation is a standard formulation for a stock accumulation. The street price this month is equal to the price last month plus the change in price during the month. The change in street price arises from informal, covert trading of illegal drugs on street corners. It is an important formulation that depends both on street price itself and the pressure for price change. This pressure is itself a function of the drug supply gap, a graphical function whose shape is sketched in the lower left of Figure 3.14. To understand the price change formulation, first imagine the drug supply gap is zero – there is just enough volume of drugs being supplied by dealers to satisfy demand. Under this special condition the pressure for price change is logically zero and so too is the change in street price itself. The multiplicative formulation ensures no price change when the pressure for price change is zero. Now suppose there is a shortage of drugs on the street. The drug supply gap is positive and, through the graph, the pressure for price change is also positive. Moreover, as the gap grows the pressure rises more quickly than a simple linear proportion. The relationship is non-linear, with increasing gradient. A mirror image applies when there is a surplus of drugs and the drug supply gap is negative. Pressure for price change is expressed as a fraction per month, so the resulting change in price is the street price itself multiplied by this fraction per month. The units of price change are £/kilogram/month and an inspection of the price change equation shows the required dimensional balance.
Figure 3.14. Formulation of street price and price change

Notice that the price itself feeds back to influence price change. This is quite a subtle dynamic formulation and has the curious, though realistic, implication that there is no pre-determined market price or cost-plus anchor toward which price adjusts. The only meaningful anchor is the current price. Hence, if there is a chronic undersupply the price will relentlessly escalate, and conversely if there is a chronic oversupply the price will steadily fall. Price settles at whatever level it attains when supply and demand are balanced, no matter how high or low.
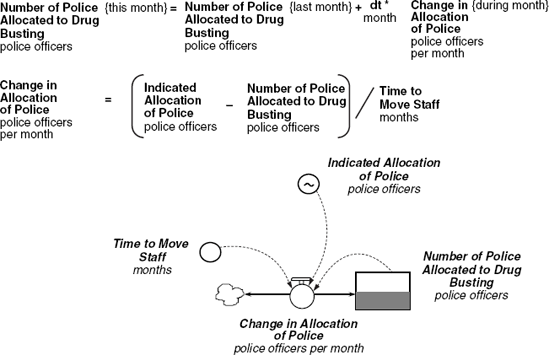
3.4.4. Allocation of Police
The formulation for the allocation of police is shown in Figure 3.15. It is a classic example of an asset stock adjustment process. At the heart of the formulation is a stock accumulation of police officers guided by an operating policy for adjusting the allocation of police. The first equation is a standard stock accumulation in which the number of police allocated to drug busting this month is equal to the number allocated last month plus the change in allocation during the month. The second equation represents the policy for redeploying police to drug busting. The change in allocation of police depends on the gap between the indicated allocation of police and the current number of police allocated to drug busting. If there is pressure on the police department from the community to deal with crime then this gap will be positive and measures how many more police officers are really needed. However, officers are redeployed gradually with a sense of urgency captured in the concept 'time to move staff '. The greater this time constant, the slower the rate of redeployment for any given shortfall of police officers. The formulation divides the shortfall by the time to move staff, resulting in a dimensionally balanced equation with appropriate units of police officers per month.
Figure 3.15. Formulation for the allocation of police