Main purpose: Comprehend what qualities in a report make it credible in the eyes of the stakeholders.
Objectives: After reading this chapter, you should be able to do the following:
- • Comprehend why companies and their sustainability reports are sometimes considered untrustworthy.
- • Compare sustainability characteristics to financial reporting characteristics.
- • Identify characteristics that support the credibility of sustainability reporting.
- • Identify characteristics that detract from the credibility of sustainability reporting.
Trust is the intangible asset that can help assure the long-term sustainability of any organization or enterprise.
—William G. Parrett
In Chapter 3, we learned the importance of stakeholder engagement to connect an organization’s policy to the needs and desires of stakeholders, ensuring the right sustainability direction for the organization. In Chapter 4, we comprehended how the policy links to performance through the management system that the organization develops. A policy is only a plan until committed and capable employees implement the plan through the management systems. Employees’ activities at all levels (strategic, tactical, and operational) provide sustainable results. In Chapter 5, we determined that these results are then reported to the organization’s stakeholders through various forms of sustainability reporting using a performance measurement system with a set of indicators. The most common reporting is either a stand-alone sustainability report or an integrated report, which includes results of the organization’s performance in the dimensions of economic, environmental, and social. We also learned that organizations receive requests for more detailed information on certain aspects of sustainability (such as water, forestry, carbon, conflict minerals, to name a few) from governments, regulators, institutions, and others.
If an organization puts forth great effort to provide sustainability reporting, its disclosure should be believable and trustworthy, but many organizations make mistakes that undermine credibility. Common mistakes occur when organizations communicate in the wrong tone, include too many photos unrelated to operations, or create too rosy of a story. Consequently, stakeholders sometimes question the credibility of sustainability reports. In this chapter, we learn how to make sustainability reporting credible (Figure 6.1). The focus of this chapter is on the linkage between performance and stakeholder needs and desires.
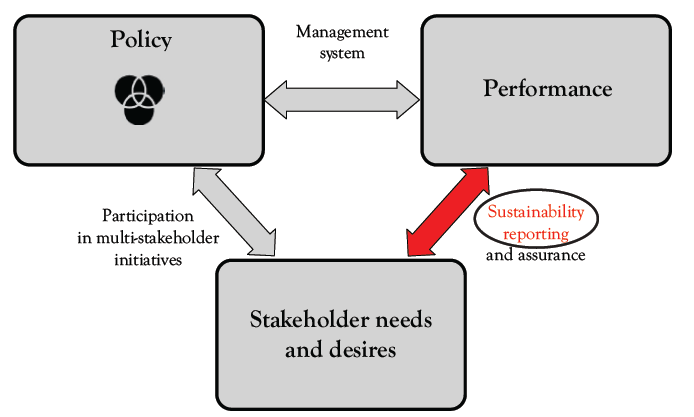
Figure 6.1 Sustainability reporting
Source: Based on Zenisek 1979
Trust in Reporting
Trust in business over the past years has generally been quite low; therefore, a lack of trust carries over to companies’ sustainability reporting. From where does this lack of trust come? Because corporate mistakes, corruption, and social and environmental disasters are frequently in the headlines of the news and social media, society perceives the misgivings of one company to exist in all companies. According to the latest 2019 Edelman Trust Barometer, over 73 percent of respondents felt that focusing on sustainability does not have to be at the expense of profits. Unfortunately, the respondents also felt that many companies have not taken up this focus to the extent that they should (Edelman Trust Barometer 2019). When society feels that companies should act in a certain manner and they make promises through their policies to do so, but they are not upheld through their performance, it creates distrust.
Consequently, companies need to prepare sustainability reports carefully, incorporating characteristics that make them credible. Readers need to watch for characteristics that signify that the organization has carried through on its policy and objectives. Therefore, we learn in this chapter how to make sustainability reporting credible.
Critics of sustainability reports often use the terms “greenwash” and “spin” with reference to companies’ sustainability performance or reporting. These words are commonly used to describe information that is perceived to be inaccurate, misleading, or unreliable. Think of a wall painted green and then use a knife to scrape away the green paint. Likely, it will be very thin and another color or bare surface will show. This is what is meant by greenwashing. It is a facade or cover-up of the company’s true performance. Greenwashing more specifically refers to environmental performance that portrays an organization in a favorable manner or has the appearance of being green, when it really has done little to lessen its impact on the environment. Spin is a more general term that could apply to either environmental, social, or economic aspects of sustainability or even the financial reporting of an organization.
Sustainability in Action: Detecting Spin and Greenwash
We have to be careful that we are not spinning. It is hard to detect it yourself. Having an external party read the report helps.
—Anonymous Reporting Company
Originally, companies used the public relations function to communicate an organization’s mission statement and values to the public. The purpose was to develop honest relationships with stakeholders, but more recently the word public relations seems to leave a negative impression and might suggest “spin.” Spin means that circumstances or the reporting of the circumstances have any of the following characteristics:
- • presented in a biased, not a balanced manner;
- • has certain material or important details missing;
- • promotes a misleading perception; or
- • conveyed in a manner that draws attention to the positive and minimizes the negative aspect.
Reflection: Spin and Resumes
Robin is preparing a resume for a job interview. Of course, Robin wants to emphasize her strengths and de-emphasize her weaknesses. Robin has a bad habit of frequently being late for appointments. She will not include that information on her resume. Is she spinning?
Some critics believe that companies intentionally set out to mislead readers, whereas others attribute the lack of credibility to inexperience. Whatever the reason, as a reader or a preparer of a sustainability report, it is important to be aware of different procedures and practices that organizations can use to instill confidence in the reader that the report is as honest and accurate as possible. A company incurs considerable cost to publish a sustainability report, but if the report is not believable, the company will not maximize the potential benefits.
Characteristics of Credible Reporting
Similar to financial accounting, sustainability reporting has a set of qualitative characteristics in its conceptual framework that provides guidance to report in a credible manner. Also similar to financial statements, sustainability reports will contain many estimates to provide relevant and useful information to the reader, which sometimes gives the impression of inaccuracy. Companies would like their reports to possess positive characteristics, but due to lack of extensive experience in reporting, different value sets, and the sophistication of companies’ information systems, not all reports give a credible impression.
Figure 6.2 briefly compares financial reporting to sustainability reporting characteristics. Table 6.1 provides more detail on the characteristics.

Figure 6.2 Reporting characteristics
Table 6.1 Comparison of sustainability and financial reporting characteristics
|
Sustainability Reporting: GRI/IR |
Financial Reporting IFRS/FASB |
|
Stakeholder Inclusiveness and Sustainability Content: stakeholder feedback on material topics and the sustainability process based on the organization’s operations. |
Relevance: financial information capable of making a difference in decision making. |
|
Materiality: aspects that substantively influence assessments and decisions of stakeholders regarding the economic, environmental, and social activities. |
Materiality: information that could influence decisions about a specific reporting entity. |
|
Completeness and Accuracy: sufficiently accurate and detailed to assess performance with measurement techniques, estimates, and underlying assumptions disclosed. Balance: reflect both favorable and unfavorable performance aspects, results, and trends. |
Faithful Representation: information is as complete, neutral, and free from error as possible. |
|
Comparability: presents information consistently to analyze changes over time and to allow comparisons to other organizations directly or through the use of benchmarks. |
Comparability: identification and understanding of similarities and differences among items; consistency helps to achieve that goal. |
|
Reliability: subject to an examination that establishes the quality and materiality of the information within acceptable margins of error. |
Verifiability: different knowledgeable and independent observers would come to the same results (within a certain range). |
|
Timeliness: on a regular schedule and available when needed to influence decision making. |
Timeliness: available in a period of time to influence decisions. |
|
Clarity: understandable to stakeholders who have a reasonable understanding of the organization and its activities. |
Understandability: presented clearly and concisely for someone with a reasonable knowledge of business and economic activities. |
Sources: GRI (2018), IIRC (2013), IASB (2010), and FASB (2010).
GRI distinguishes between characteristics to define report content (stakeholder inclusiveness, sustainability context, materiality, and completeness) and to ensure report quality (balance, comparability, accuracy, timeliness, and clarity and reliability). IFRS/IASB distinguishes between fundamental qualitative characteristics (relevance with materiality as a subpart and faithful representation including complete, neutral, and free from error) and enhancing qualitative characteristics (comparability, verifiability, timeliness, understandability).
Characteristics that Support Credibility
We discussed stakeholder inclusiveness, context, and materiality thoroughly (Chapter 3); therefore, they are covered only briefly here. Other characteristics that support credibility are completeness, balance, accuracy, reliability, and comparability, which are discussed more thoroughly.
Stakeholder Inclusiveness, Stakeholder Context, and Materiality. Recall that Teck identifies topics that are material to its company: topics that rate high on both (a) significance to its stakeholders and (b) impact on the company. The topics rating high on both significance and impact should be integrated into the management system and the reporting. Therefore, note in Figure 6.3 how Teck links its reporting to the material topics identified by stakeholders (Teck’s materiality matrix provided in Figure 3.5).

Figure 6.3 Teck: Linking indicators to material topics
Source: Teck 2017
Materiality affects all the following decisions:
- • which indicators to present individually and which indicators to aggregate with others;
- • which indicators to have checked for accuracy; and
- • where to place information that is material to some stakeholders but not others.
Completeness. If a report is complete, it contains all the information that is necessary to make good decisions about an organization’s sustainability performance; therefore, it is also related to materiality. However, stakeholders’ information needs may differ. That is why companies often provide the topics that are relevant to different stakeholder groups in their stakeholder engagement section of the report. It is difficult to provide a complete report that is also brief and concise and does not overwhelm readers with too much information. Sustainability reports can often contain over 100 pages, especially for the more impacting companies in the resource extractive industries. What can companies do to satisfy the completeness requirements but also keep the length of the document within reason? If the report has been prepared according to GRI, there should be a GRI Index. Notations often appear in the index or some place in the report that additional information can be found elsewhere and where it can be found. For example, governance information is located in the Proxy Statement for the Annual General Meeting and therefore companies refer readers to this document for the information or to their website. Figure 6.4 provides an example of part of Alma Media’s GRI Index. Alma Media is a media company.

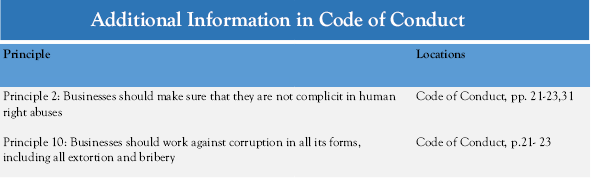
Figure 6.4 Alma media’s GRI index
Source: Alma Media 2018
For our purposes, a report that is complete will have the following characteristics:
- • Materiality: includes all topics that are significant to stakeholders and have a high impact on the company;
- • Balance: contains both accomplishments and challenges; and
- • Comparability: allows assessment of performance against similar organizations and operations.
We can see that these characteristics are interdependent. Fulfilling one characteristic often helps to fulfill another. We discuss both balance and comparability next.
Balance. Balance means reporting the accomplishments along with the challenges. You might ask why organizations do not report more information about their challenges or what they did not accomplish. There are likely several reasons, but regardless of whether an individual or an entity, no one likes to discuss perceived failures. In addition, the media tend to focus on negative information about organizations; therefore, managers sometimes rationalize that their sustainability reports provide them with an opportunity to tell the other side. As well, some legal departments fear that providing information on what the company should have done, but did not accomplish, might lead to legal suits against the company.
Nevertheless, providing an unbalanced narrative would surely lead to the perception of greenwashing and distrust of the company’s performance. Consequently, the report should provide both negative and positive aspects, and the negative aspects should not be hidden in the report or difficult to find. However, rarely will the reader see a section in the report titled BAD NEWS. Often times the reader can detect negative aspects when a company indicates it did not make sufficient progress on an initiative, when the numbers show a trend in the wrong direction, or when the company discusses challenges that it faces. Be alert to negative aspects in the sustainability report in various sections throughout the report. The examples from Domtar and Marks and Spencer (M&S) show different approaches to providing balance in their reports. M&S is straightforward in showing that many of its initiatives toward its goals have not been implemented yet (Figures 6.5 and 6.6).

Figure 6.5 M&S performance summary (Balance)
Source: Marks & Spencer (M&S) 2018

Figure 6.6 Domtar’s priorities, challenges, and progress
Source: Domtar 2017
In comparison, view Figure 6.6 and how Domtar provides its Priorities, Challenges, and Progress.
Balancing favorable with unfavorable performance has been found to be one of the characteristics most important for credibility in a report. After all, just as we are all human and make mistakes, so do organizations. Therefore, it is important that an organization admits its failings and indicates how it will turn the situation around.
Sustainability in Action: What Companies Say About Balance
If you read a report and it shows a balance of performance—both good and bad—then I take that report at face value. However, if it shows performance that is all good, I would seriously question that report. Well, finding the right balance [positive and negative] is very important for our report to be credible.
—Quotes from Reporting Companies
Accuracy and Reliability. Accuracy and reliability are related, as accurate information is also reliable information. If two different individuals do an analysis separately and they come up with the same result, it is assumed to be reliable. (Chapter 7 on assurances provides more information on this topic.) In general, companies do not intentionally put inaccurate information in their reports, but in an effort to meet the timeliness characteristic (release the report by its targeted delivery date), sometimes errors do occur. Some of the reasons might be the following:
- • human error due to inexperience, carelessness, or fatigue;
- • a change or improvement in the method of recording information;
- • information systems with insufficient controls to ensure accuracy.
Sustainability in Action: Systems and Accuracy
Because our systems are pretty well developed, the quality of reporting is much higher. We are much more accurate now than we were about our impacts in the beginning.
—Anonymous Reporting Company
To ensure accuracy in their sustainability reporting is one of the reasons that organizations often have their internal auditor, external auditor, and a stakeholder advisory panel to review the report before it is published. In some companies, the board of directors also reviews the reporting.
Comparability. We discuss two procedures in this section that organizations use to make reports comparable: benchmarks and standards. Benchmarks can be used in several ways for comparison:
- • year-to-year,
- • progress with a target, and
- • other companies in a similar line of business.
Year-to-year comparisons and reporting progress against a target are quite common in sustainability reports but comparing against peers is not. Nevertheless, readers often want to know how an individual company performed compared to its peers. Therefore, rating organizations have come into existence to benchmark peer companies against each other (discussed in Chapter 2). However, both M&S and Samsung provide good benchmarks in their reports. M&S shows its injury rate against several benchmarks, and Samsung has developed its own internal benchmark with the help of an externally accepted standard (Tables 6.2 and 6.3).
Table 6.2 M&S’s health and safety benchmark
|
RIDDOR injury rate per 100,000 employees |
Fatal |
Specified |
Over 3 or 7 days |
Total |
|
M&S UK retail |
0 |
25 |
130(7) |
155 |
|
2016/2017 HSE UK retail bench mark |
0.11 |
48 |
172(7) |
220 |
|
M&S warehouse |
0 |
52 |
262(7) |
314 |
|
2016/17 HSE UK warehouse benchmark |
1.42 |
325 |
1252(7) |
1577 |
Source: Marks & Spencer (M&S) 2018
Table 6.3 Samsung working hours benchmark
Working Hour Management1
|
|
2015 |
2106 |
2017 |
|
Workweek average compliance2 |
89 |
83 |
87 |
|
Average weekly work hours |
48 |
53 |
52 |
|
Maximum average weekly work hours |
52 |
57 |
54 |
|
Average work hours of those who work 40 hours or more per week |
52 |
55 |
54 |
|
Compliance with the guarantee of one-day off per week |
89 |
94 |
97 |
Source: Samsung Electronics 2018
Until organizations report a performance metric, such as toxic spills, using the same protocol or guideline and in the same units, the benchmark is useless. Not only must all organizations count the same items in the metric, but they must also be clear on its definition: For example, these questions arise regarding reporting of spills of a contaminated substance:
- • Were spills measured by volume, number, or both?
- • If by volume, how big was the spill before including it in the spill count?
- • Which chemicals were considered toxic?
Sustainability in Action: Comparability in Different Jurisdictions
Volume in Reportable Spills: Jurisdiction A requires reporting incidents of spilled substances over 100 milliliters. Jurisdiction B requires reporting incidents of spilled substances over 1,000 milliliters. A company in Jurisdiction B could have 1,000 or more spills less than 1,000 milliliters, and none of them would be reported.
Reportable Substances: Company A reports the volume of all spills (oil and water) in a single metric, with 99 percent of the volume spilled consisting of water. Company B excluded water spills from the reportable substances. Company A’s spill record appears extremely poor compared to Company B.
GRI Reporting Standards generally suggest to “use the definitions of the jurisdiction you’re operating in …” meaning that thresholds and definitions of their sustainability metrics may differ due to different regulations.
Guidelines and standards help to make benchmarks reliable, helping with comparability. XBRL (eXtensible Business Reporting Language) is a global standard for exchanging business information. However, it is in the early stages of development. XBRL is used for some forms of financial reporting. Eventually, information found in sustainability reports will be XBRL enabled, which will standardize information and make it easier for the reader to compare organizational performance.
Sustainability in Action: Comparability
So there is a real challenge to having consistent reporting so that it is absolutely comparable between organizations, like financial information. It will take some time to have completely standardized reports from all companies because they are all tuned into their own “corporate culture,” quite rightly.
—Anonymous Reporting Company
Other guidelines or standards that we discussed under reporting (Chapter 2) and management systems (Chapter 4) help to make reports comparable, such as CDP, GRI, SASB, and ISO. Even though the content and format of reports are becoming more standardized, lots of variation still exists. Sustainability reporters need more time and experience to become more comparable.
Reflection: Protocols for Accounting for GHG Emissions
Companies who report to the CDP provide the protocol (accounting method) that they are using to account for greenhouse gas (GHG) emissions. The CDP lists more than 60 protocols that are acceptable (CDP n.d.). Many organizations use several protocols to report emissions from different activities. A few are listed below and all of these are acceptable standards for reporting carbon or GHG emissions.
- • IPCC Guidelines for National GHG Inventories, 2006
- • The GHG Protocol: A Corporate Accounting and Reporting Standard (Revised Edition)
- • United States Environmental Protection Agency (EPA) Mandatory GHG Reporting Rule
- • Canadian Association of Petroleum Producers
- • American Petroleum Institute Compendium of Greenhouse Gas Emissions
- • ISO 14064-1
- • The Climate Registry: General Reporting Protocol
- • European Union Emission Trading System (EU ETS): The Monitoring and Reporting Regulation (MMR)—General guidance for installations
What does this mean for comparison?
Characteristics that Detract from Credibility
There are certain characteristics that are not inaccurate per se, but lead the reader to believe that the organization is dishonest and untrustworthy. Three are discussed here: careless illustrations, aggregated data, and imprecise/vague disclosure. You might be able to find others in sustainability reporting.
Careless Illustrations. Companies sometimes present graphs and charts in a confusing manner or with missing data. Compare the two graphs. Notice how compressed (first graph) or spread the intervals (second graph) are on the vertical axis, which gives the appearance that a greater change in waste occurred. On the horizontal axis of the first graph, the intervals (spread of the numbers) are not consistently spaced throughout the entire axis, creating a misleading picture, especially for the larger amounts (Figure 6.7).
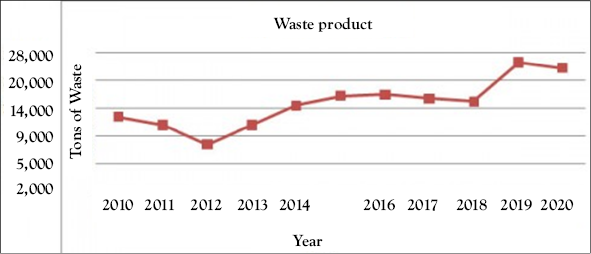
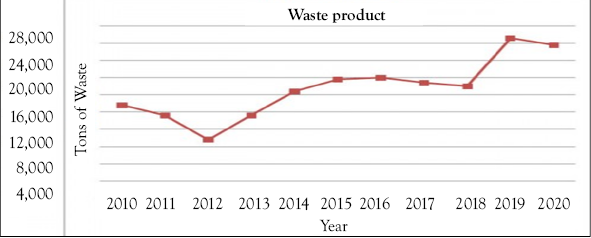
Figure 6.7 Careless illustrations
Aggregated Data. This process is similar to financial statement presentation. Often the results of operations statement (income statement) contains one line called “selling general and administrative expenses.” This one line is a total of many, many expenses. Generally, more detail on these aggregated numbers can be found in the notes to the financial statements. Similarly, when reading a sustainability report, the reader might notice that the organization does not discuss a favorite topic or environmental condition and feels that the organization is attempting to hide something. Even though this indeed could be the situation, an alternative explanation is that management decided, due to space limitations, to aggregate the data with other numbers or place the data on the organization’s website.
For example, some companies will aggregate contractor and employee safety rates. Contractors often have higher injury occurrences because riskier tasks are often contracted out to specialists, and the company has less control over contractors. To mitigate the problem, some companies require contractors to undergo the same training as employees. Therefore, isolating contractor and employee injury rates adds additional information. Figure 6.8 illustrates how Suncor’s injury rates are disaggregated.

Figure 6.8 Suncor: contractor and employee injury rates
Imprecise and Vague Disclosure. Sometimes sustainability disclosure is not sufficiently detailed to understand the company’s actions or the writing is too technical for the average reader to understand. Compare the excerpts that are vague and imprecise to those that are clear and specific and indicate which ones you feel are more credible.
Table 6.4 Disclosure: vague/imprecise or clear/specific
|
Vague and Imprecise |
Clear and Specific |
|
We have a hazardous waste avoidance plan and investigate how to decrease hazardous waste in the future. |
We track hazardous waste on a daily basis. In the past year, our hazardous waste decreased by 10 percent. We have a hazardous waste team that reports options to decrease hazardous waste on a monthly basis. |
|
All of our facilities are ISO 14001 |
All of our facilities have ISO 14001 certified environmental management systems. Our internal auditors check each facility’s compliance on a two-year rotating basis. Facilities must report progress on eliminating any deficiencies within three months of the audit. |
|
We have training programs for all of our staff, management, and field personnel. |
Safety training hours averaged 2.5 hours for staff, 2.0 hours for managers, and 5.4 hours for field personnel. Ninety percent of the employees in these categories received training. Training appears to have reduced our injury rate by three percent this past year. |
Key Takeaways
- • Sustainability reports need to embody certain qualities to make them credible, including engagement with stakeholders (stakeholder inclusiveness) to determine which topics are most important to them (materiality) and which topics have the greatest impact on the company (sustainability context).
- • When there appears to be a gap between a company’s promises and their delivery, credibility is questioned, unless the company explains why the difference has occurred.
- • The characteristics that make financial reporting credible and useful are similar to the characteristics that make sustainability reports credible and useful.
- • Many of the characteristics are interdependent; for example, complete reports contain topics that are material, balanced, and comparable.
- • Comparability allows for assessment of performance against similar organizations and operations; reporting results from year-to-year, against targets, and against benchmarks supports comparability.
- • Using standards or guidelines help with comparability; however, different jurisdictions provide different protocols, regulations, or units for reporting aspects of sustainability, which makes certain indicators less comparable.
- • Companies should provide reports on a regular basis; many companies that do not provide an integrated report (social and environment integrated in the financial report) will attempt to release their sustainability report at the same time as their financial report.
- • Assurances help to make reports reliable, which means two independent individuals will come to the same conclusion.
- • Some characteristics that detract from credibility are careless illustrations, information that is too aggregated, or disclosure that is imprecise and vague.
The most essential quality for leadership is not perfection but credibility. People must be able to trust you.
—Rick Warren (2012, p. 253)