Chapter 9
Assessing a Company’s Stock: Six Tried-and-True Steps
IN THIS CHAPTER
![]() Getting familiar with the company you want to swing trade
Getting familiar with the company you want to swing trade
![]() Examining its financial stability and earnings and sales data for clues to the bigger picture
Examining its financial stability and earnings and sales data for clues to the bigger picture
![]() Seeing how the competition’s share prices measure up — relatively speaking
Seeing how the competition’s share prices measure up — relatively speaking
Analyzing a company is kind of like going grocery shopping without a shopping list. You can go to the store and look around for what you want, but without having something in mind, you spend a great deal of time walking through aisles trying to think whether you need more of this or more of that. Taking a list along is much more efficient. You know what you need to get and are less likely to be swayed by impulse buys scattered throughout the store.
In this chapter, I clue you in to the Six Step Dance. Consider it your grocery list of what to look for when analyzing a stock you want to buy or sell. These six efficient, reliable steps aren’t set in stone. I didn’t pick them up from some secret society that holds the keys to the “right” way to evaluate companies. Instead, I offer you the process I use when looking at a potential investment and how to tell whether this method of analysis is right for you.
The Six Step Dance: Analyzing a Company
Forget the salsa or polka. The Six Step Dance isn’t a real dance. It’s actually a way to look at a company’s fundamentals to quickly determine whether shares are over- or undervalued. Table 9-1 shows you how the Six Step Dance compares to three other analysis methods — no fundamental analysis, analyzing stocks via EPS ranking, and using extensive modeling in Microsoft Excel — in terms of time efficiency, accuracy, and appropriateness for swing trading.
TABLE 9-1 Comparing Fundamental Analysis Tactics
Analysis Method |
Time Efficiency |
Accuracy Level |
Appropriate for |
No fundamental analysis |
Very time-efficient |
No accuracy |
Day traders |
EPS ranking |
Very time-efficient |
Average |
Day and swing traders |
Six Step Dance |
Time-efficient |
Above average |
Swing traders |
Extensive modeling |
Not time-efficient |
Most accurate |
Long-term investors |
Note: Time isn’t a luxury for a swing trader. Hence, the list in Table 9-1 isn’t exhaustive. You’re not going to have to call a company’s suppliers or customers and inquire about their business operations. (I’m not even sure how much outperformance such an exercise would really add to an investment portfolio in the long run!)
If fundamental analysis isn’t your cup of tea, you can forgo it at your own peril. Skipping fundamental analysis entirely is time-efficient because it requires no time on your part with regard to studying what makes a company tick. But because you have no yardstick to measure with, you’ve no idea whether the shares of a company you buy are expensive or cheap. This approach is most appropriate for day traders. Day traders trade on news, volume, and momentum. They pay little attention to a company’s earnings, balance sheet, or competitive position in the industry.
Earnings per share (EPS) ranking is also time-efficient but with the added benefit of being somewhat accurate when it comes to selecting securities. Day and swing traders can benefit from incorporating EPS ranks into their trading.
Extensive modeling is what Wall Street analysts do. They spend hours poring over 10Ks, 10Qs, and other SEC filings and use Microsoft Excel to forecast financial statements three to five years into the future. They call competitors, suppliers, and end customers to understand how a company’s products are selling in the marketplace. They even visit the company and speak with management. The accuracy level’s high here. But as I show you in Chapter 7, that doesn’t mean analysts draw the right conclusions in their recommendations.
The Six Step Dance falls somewhere in the middle of the bunch shown in Table 9-1. It’s time-efficient after you get up to speed on how to do it. The analysis of your first few companies using this method is a slow process, but you should be able to quickly review a company by using the Six Step Dance before too long.
 You don’t need to run through all six steps for every company that crosses your desk. Many companies will fail one or two of the steps and be thrown out of your trading idea box. You’re not an analyst with a deadline to meet for your portfolio manager; you are the portfolio manager. Use your time wisely and address all the key points before you enter a trade, and you’ll be able to quickly go through a list of companies and exclude those that just don’t have promising fundamentals.
Step 1: Taking a Company’s Industry into Account
A company’s potential profits depend on the nature of its industry. For example, some companies require significant start-up costs to launch. Think about how expensive it’d be to enter the commercial airline market. Today, Boeing and Airbus make nearly all commercial aircraft. To launch your own commercial airplane business, you’d have to have billions of dollars to research, design, produce, and market planes. The costs of entering the tech industry with some app for smartphones, on the other hand, are much lower. That’s why Tommy who is in college and living on a tight budget can have a tech business. These cost considerations play into the economics of a sector, which determine how much profit potential companies within that sector have.
The first step in your stock analysis is to understand the nature of the industry in which a company operates. Peter Lynch, the legendary Fidelity fund manager, quips in one of his books that he’d never invest in a company that can’t be explained by a child with crayons. Similarly, Warren Buffett never invests in a company he can’t understand, which is one reason he didn’t participate in the technology boom of the 1990s. (Then again, he didn’t participate in the crash of 2000, either. In fact, Buffett’s company, Berkshire Hathaway, actually bottomed the same month the Nasdaq peaked in March of 2000.)
Swing traders don’t have to be so strict. I’m not asking you to buy crayon kits or swear off technology investments. But understanding or having insight into an industry can help you better trade stocks in that market.
The bottom line in analyzing the nature of a company’s industry is to follow four steps:
Understand how the company makes profits.
Does it profit by selling a commodity or by selling business services? The former is tied to the economy, whereas the latter may be growth-oriented.
Determine whether the industry is growth- or value-oriented.
This way, you have an idea of whether valuations are average, above average, or below average.
- Find out what rate of earnings growth is expected for the industry as a whole in the coming three to five years.
- Determine which stage the economy is in.
Economic cycles affect sector performance, so recognizing the relative strength or weakness of the economy at any given time is essential.
Scoping out markets you’re familiar with
Swing trading companies in industries you know can pay off handsomely. In 2005 and 2006, for example, many parents were scouting retailers for the Nintendo Wii console. It was a hot commodity, and if you were interested in video games, you would have known it. Shares of Nintendo rose 500 percent between 2006 and 2007 on the success of that console.
Before smartphones, portable music players were hot. Apple scored an early success with the iPod. These puppies flew off the shelves from 2003 through 2007. As a result, shares of Apple rose 1,700 percent between 2004 and 2007.
 Don’t think that just because your time horizon’s measured in days or weeks that you can’t benefit from trends that last years. A savvy swing trader buys the dips of shares of super-successful companies like Nintendo or Apple and sells the mania.
Identifying what type of sector a company is in
Every company caters to a specific market sector. As part of the Six Step Dance, you want to first identify whether the company you’re looking at falls into the growth sector (characterized by above-average valuations and growth rates relative to the overall market) or the value sector (characterized by below-average valuations and growth rates relative to the overall market). Following are the industries I classify as growth industries:
- Consumer cyclical: This sector includes retailers, homebuilders, auto and clothing manufacturers, cable companies, and other businesses that cater to the general consumer.
- Healthcare: Pharmaceutical and biotech companies, HMOs, and medical instrument manufacturers are just some of the businesses that fall within this niche sector.
- Information technology: This market area is composed of software developers and computer and semiconductor manufacturers, among others.
- Telecommunications: Wireless service companies, broadband information services, and communications equipment providers are just some of the telecom companies you may encounter.
And here are the industries that I group into the value sector:
- Consumer staples: This category is made up of businesses such as grocery stores, food producers, beverage manufacturers, and cosmetic companies.
- Energy: Drilling companies, integrated energy firms, explorers and producers, and equipment manufacturers all work within the energy industry.
- Financials: This market area includes banking companies, investment banks, insurance companies, and so on.
- Capital goods: Aerospace and defense companies, railroad businesses, farming product and heavy equipment manufacturers, and others meet the needs of this category.
- Basic materials: This industry involves chemical specialty companies, paper and steel manufacturers, and related businesses.
- Utilities: The electric and gas utilities you use daily belong in this group.
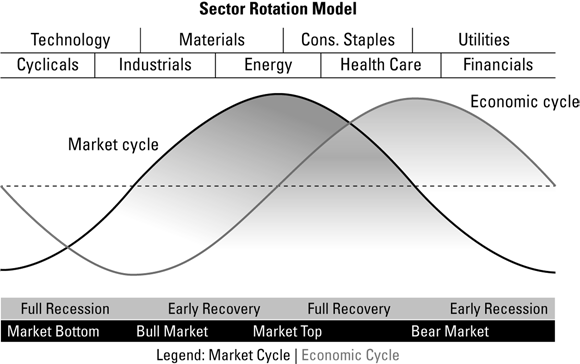
Sectors perform differently depending on the economic cycle. Figure 9-1 shows the sectors that tend to perform best depending on the stage the economy is in.
Source: StockCharts.com
FIGURE 9-1: Market sectors perform differently depending on the stage of the economic cycle.
Companies in growth sectors usually earn higher price to earnings ratios — the security’s price divided by the earnings per share (covered in Chapter 8) — than companies in value sectors. Value sectors often feature companies that pay higher dividend yields than companies in growth sectors. There’s no right sector to be in. If anything, different sectors are right to be in at different times.
 Be aware that market sectors determine firms’ valuations. For example, electric utilities aren’t known for their earnings growth potential. Analyze companies on a curve based on their industry. Otherwise, you may be comparing apples and oranges. A 15 percent growth rate for a technology firm can look amazing when compared to a grocery store chain, but such a comparison isn’t fair.
Just because a sector is a value sector doesn’t necessarily mean that sector can’t grow earnings at eye-popping rates. Consider the energy sector. For much of the ’90s, the energy sector was a classic value sector with companies priced at below-average P/E ratios when compared to the market index. But when energy prices began a magnificent climb early in the 21st century, the energy sector transformed — temporarily — into a growth sector. So seeing energy companies trading at 25 times earnings (a P/E ratio usually reserved for high-growth technology companies) isn’t unreasonable, because earnings growth rates are up significantly. But in the long term, the energy sector is a value sector.
Just because a sector is marked as value doesn’t mean profits in that sector will be less than profits in a growth sector. When growth is out of favor, value sectors shine.
Step 2: Determining a Company’s Financial Stability
A financially stable company generates cash from its operations, which it can use to fund its own growth. This type of company has little or no debt on its balance sheet and pays little interest to creditors. Without the burden of debt on its shoulders, a fiscally sound company can seize investment opportunities more readily than a company dealing with massive debt.
A company with significant debt runs into trouble when good times turn bad. Such companies struggle to meet debt payments and may only make profits a few times what their debt payments are for the period. For example, Struggling Inc. may have such a major debt burden that its debt payments make up 25 to 50 percent of its total profits. If it makes $5 million in operating profit, it may pay out $2.5 million in debt payments. This is the type of company most likely to fail if the economy turns sour.
Therefore, financial stability plays an important role in selecting investment candidates. In the next few sections, I break down the three ratios that can give you a quick feel for whether a company is financially stable.
Current ratio
The current ratio tells how well a company can meet its near-term liabilities with its near-term assets. This commonly used ratio helps answer the question, “Will this company have any difficulty surviving over the next 12 months?” Just because a company has more near-term liabilities than near-term assets doesn’t mean it has to file for bankruptcy. It can instead take out a long-term loan to meet its near-term obligations, for example, or try and delay payments.
Financially sound companies have current ratios of 1.5 or higher. You can’t draw any significance from a very large number, say 5 or 6. So, make sure companies you are interested in buying sport healthy current ratios of 1.5 times or better.
For those of you who know how to read financial statements, remember that not all current ratios are created equal. A current ratio of 2 for a company with significant inventories and little cash is less impressive than a current ratio of 1.5 with significant cash and little inventories. In other words, the makeup of the current ratio shows important information as well.
But for simplicity, I recommend using a minimum current ratio of 1.5 for swing traders.
Debt to shareholders’ equity ratio
The debt to shareholders’ equity ratio (or debt to equity ratio for short) gives you insight on how a company finances assets via equity and debt — referred to as capital structure. The higher the debt to equity ratio, the more leveraged the company is. Two firms generating identical profits have different efficiency ratios (such as return on equity, covered in Chapter 8) if they use different amounts of debt.
Think of the matter this way: Two traders, Susan and Allen, begin the year with a $50,000 swing-trading account. Susan trades throughout the year and earns a 20 percent return on her account to end the year with $60,000. Allen, on the other hand, decides to borrow $50,000 and invest a total $100,000 ($50,000 in borrowed funds, $50,000 in his own capital). He too earns 20 percent on his account of his capital and the money he has borrowed. However, he ends the year at $70,000 rather than $60,000 for a net return of 40 percent ($100,000 grows to $120,000, but he must pay back $50,000 so he is left with a net of $70,000). A 20 percent return on $100,000 yields him $10,000 more than Susan’s 20 percent return on her $50,000 account.
Such a benefit can turn into danger because leverage, the amount of debt a company uses, can distort financial ratios. When all’s well, one company may look more efficient than another. But when the situation turns sour, your sunshine-filled day can turn cloudy fast. Had that 20 percent return in the preceding example been a 20 percent loss, Susan would be at $40,000 at year-end. Allen, on the other hand, would be staring at a $30,000 account, a $20,000 loss from his initial investment. Instead of losing 20 percent of his account value, like Susan did, Allen lost 40 percent.
When you swing trade, look for companies that aren’t highly leveraged. I prefer to see a debt to equity ratio no more than 30 percent. Some swing traders disagree with my viewpoint; they see highly leveraged companies as having high profit potential. Although that may be true, such traders are also exposing themselves to bigger potential losers. As one successful investor said, “You only find who is swimming naked when the tide goes out.” In other words, that leveraged company can look great when things are hunky dory. But when things go south, those companies taking the greatest risks are exposed.
Whichever view you take, realize that restricting yourself to low-leverage companies may exclude some industries from investment. For example, homebuilders are typically highly leveraged. I personally forgo such industries so I can sleep better at night.
Interest coverage ratio
The interest coverage ratio measures how well a company covers the interest payments on its outstanding debt. The quickest way to bankruptcy is to stop meeting the terms of your outstanding debts, and the interest coverage ratio tells you whether a company is in danger of falling behind on its interest payments by comparing two figures:
- A company’s earnings before interest and taxes (EBIT)
- A company’s interest expense
You compare EBIT because interest expense is viewed as part of the cost of doing business. Hence, a company can use pretax money to make interest payments. Check out the formula for the interest coverage ratio:

Financially healthy companies should have an interest coverage ratio of 5 or higher. Again, the exact “healthy” figure depends on the industry. But requiring a high ratio protects you if conditions turn sour. Financially unhealthy companies have an interest coverage ratio of 2 or less.
You can pull both items in the interest coverage ratio from a company’s income statement, but more often than not, you can obtain the ratio for free from your broker or the Internet. I recommend the finance section of Reuters for a summary of key ratios on thousands of publicly traded stocks (see www.reuters.com/finance/markets/indices). This site also compares the financial ratios of one company to its industry’s ratios to help you determine whether a company’s interest coverage or debt levels are in line with its industry.
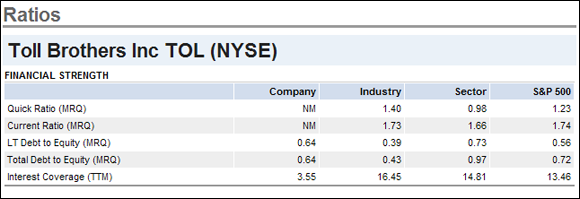
Want an example of how you can use the interest coverage ratio? As you can see in Figure 9-2, Toll Brothers, a homebuilder, has an interest coverage ratio of 3.55, below my threshold of 5. Notice also that Toll Brothers’ interest coverage ratio is well below its industry and sector. These factors reinforce the view that the company is experiencing near-term difficulties. If you were looking to swing trade Toll Brothers, this info should convince you to consider other companies.
Source: Reuters Finance
FIGURE 9-2: A low interest coverage ratio is a red flag for Toll Brothers.
Step 3: Looking Back at Historical Earnings and Sales Growth
You’ve heard it a dozen times: Past performance isn’t indicative of future results. But don’t tell that to Patrick Henry, the American revolutionary remembered for crying, “Give me liberty or give me death!” As far as I know, Patrick Henry wasn’t a swing trader. But he did say something that can apply to analyzing companies’ fundamentals: “I have no way of judging the future but by the past.”
Analyzing a company’s historical sales and earnings is the third part of the Six Step Dance. You must look at a company’s historical record in order to determine a trend. If a company is losing market share or suffering from competition, that weakness shows up in sales and/or earnings. If a company is gaining market share and ramping up production, that also appears in sales.
Here’s how to conduct a good analysis of historical earnings and sales growth:
- Examine a company’s sales and earnings growth over the last several years.
- Get a feel for whether the company is mature (growing sales and earnings at a low rate) or growing (increasing both sales and earnings at double digit rates).
Compare growth rates across the industry so you know whether the company deserves to be awarded a higher multiple than its competition.
Avoid buying companies with negative sales or earnings growth.
Fortunately, this analysis can be done visually (after all, a picture’s worth a thousand words) or quantitatively. Relax, you don’t have to acquaint yourself with another formula on what constitutes good or poor results. Regardless of the direction of growth, a company may be over- or undervalued depending on what market multiple it trades at or what cash flow it generates.
If a company’s experiencing growth, you need to figure out whether that growth is accelerating, slowing down, or holding steady. A company undergoing accelerated growth is often awarded a market multiple above its industry average — as long as that growth outpaces the industry average. On the other hand, a company facing declining earnings or sales — at a time when the industry is growing — is often awarded a market multiple below its industry average.
Be sure to review at least three years’ worth of sales and earnings growth. William J. O’Neil of Investor’s Business Daily recommends looking for companies with an earnings growth rate of at least 25 percent in the previous two quarters (when compared to the year-ago periods) and an annual earnings growth rate of 25 percent throughout the last three years.
I certainly like to see such growth in the companies I’m looking to swing trade. But I don’t exclude a company solely because it doesn’t have that minimum 25 percent earnings growth rate. My yardstick is to find companies growing earnings at a faster pace than the industry.
Earnings growth can’t continue indefinitely if sales remain constant. The type of sales growth I look for depends on a company’s size. The larger the company, the more I allow for lower levels of sales growth. Growing sales 25 percent when total sales are $10 million is much easier to do than growing sales 25 percent when total sales are $10 billion.
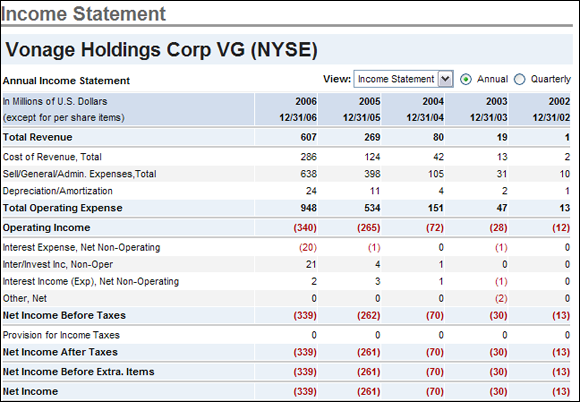
Examining both sales and earnings pays off. Consider the income statement of Vonage (symbol: VG) from 2002 through 2006. During that period, Vonage grew sales from $1 million to $607 million — now that’s remarkable growth! So surely Vonage was a steal to buy, right? Not when you look at the bottom line: net income. During that same period, Vonage’s losses increased from $13 million to $339 million, and the company’s stock price fell from $17 per share when the stock was issued in 2006 to $2 per share by the end of 2007, as shown in Figure 9-3.
Source: Reuters Finance
FIGURE 9-3: Snapshot of VG’s income statement from 2002 through 2006.
Step 4: Understanding Earnings and Sales Expectations
Wall Street values companies based on future income projections, not past income results. So another critical step in your stock analysis is examining what a company is likely to earn in the future.
The good news is that a “right” figure for future growth simply doesn’t exist. A company can report an earnings growth rate of 100 percent during a quarter versus the year-ago period and still see its stock price tumble like there’s no tomorrow — if Wall Street expected 150 percent earnings growth.
For better or worse, Wall Street analysts estimate a company’s future earnings and sales by meeting with management, talking to competitors, building elaborate models only they can understand, and flipping a coin. (I’m only half joking.) Analysts often estimate earnings in the same range to avoid the embarrassment that comes if an estimate’s far off the market. After all, if they’re wrong together, they have an excuse. But if one analyst is way off and everyone else is on target, that analyst may have some explaining to do. But you don’t have to go through all that trouble. Instead, you can let the analysts do the heavy lifting to give you a ballpark figure from which you can work. Talk about a home run!
Whenever you use analysts’ estimates, you want to know whether they can give you an idea of a company’s sales or earnings trend. (Is it rising or falling?) That’s why I recommend using these so-called expert estimates in conjunction with the history of a company’s earnings surprises.
The earnings surprise history helps you determine whether the analysts anchored their expectations. Anchoring is a behavioral finance term that refers to an individual’s tendency to anchor beliefs on some reference point. For example, analyst Martha may believe that Samsung is the undisputed smartphone seller in the world. But when Samsung announces a lousy quarter and Apple — a chief rival to Samsung — reports an excellent one, analyst Martha may be tempted to retain her old belief that Samsung is still the leader and may have just stumbled temporarily. It may take three or four quarters of results before analyst Martha finally catches onto the trend and adjusts her models to reflect the new reality — perhaps just before the trend changes again!
An earnings surprise history table compares a firm’s actual reported earnings to the consensus (or average) estimate of Wall Street. A company that reports earnings of $1.10 per share when Wall Street expected earnings of $1.00 per share surprises Wall Street by 10 cents per share, or 10 percent. Some Websites (like the finance section of Reuters) report the absolute difference between the actual results and the estimates, whereas others (like Yahoo! Finance) report the actual and percentage difference.
Earnings surprise histories are extremely important in swing trading. Because earnings estimates represent Wall Street’s consensus estimates on sales and earnings going forward, the consistent over- or underestimating of sales or earnings is very telling.
When analyzing Wall Street’s estimates of earnings and sales, practice the following:
Determine the trend and the slope of the trend.
For example, is the slope increasing or decreasing?
Examine the earnings surprise history.
You want to see whether analysts are consistently underestimating (positive surprises) or overestimating (negative surprises) a company’s sales and earnings.
Although seeing increasing surprises is great, don’t place that requirement on the earnings surprise history, because doing so is somewhat burdensome.
Figure 9-4 shows the earnings and sales surprise history of Merck Company (symbol: MRK) over five quarters: September 2006 through September 2007. Notice how analysts consistently underestimated sales (and earnings, to a lesser extent) throughout the five quarters. This consistent underestimation is a clue that shares of Merck are probably mispriced. Shares of Merck returned more than 32 percent in 2007.

Source: Reuters Finance
FIGURE 9-4: A quarterly earnings and sales surprise history of MRK.
Step 5: Checking Out the Competition
No company is an island. It competes with other firms in its industry. Understanding who the other players are and their fundamentals gives you insight on whether shares you’re trading are cheap or dear. That’s why you always want to examine a company’s competitors and understand how they differ from it.
Companies in the same industry tend to benefit and suffer together, because the forces that affect all firms in an industry are usually the same. The key is understanding how the firms within the industry differ.
This essential part of the Six Step Dance is all about classifying the way in which the company you’re swing trading is distinguishing itself. You can generally sort a company’s stand-out-from-the-pack strategy into one of these four bins:
- Cost-leadership strategy: The cost-leadership company strives to be the lowest-cost producer in the industry. Often, it achieves this status by employing economies of scale or by being large enough to spread costs across a broad number of items in order to lower prices. Of course, the cost leader’s products must be similar to higher-priced products in the market. No cost leader can simply offer cheap items that are clearly inferior to what consumers can purchase elsewhere. Good examples of cost leaders are Wal-Mart and Southwest Airlines.
- Differentiator strategy: A differentiator strives to offer a better product than others in its industry and usually charges a premium price for that product. Tiffany & Co. is a classic differentiator company.
- Cost-focus strategy: A company pursuing a cost-focus strategy tries to offer the lowest prices on a narrow part of the industry. A company that manufactures inexpensive men’s ties, for example, practices cost focus.
- Differentiator-focus strategy: A company pursuing a differentiator focus attempts to offer a superior product in some aspect of quality for a narrow subset of the market. NVIDIA, a premium graphics chip maker, employs the differentiator-focus strategy by offering graphics cards aimed at gamers, graphic designers, and cryptocurrency miners.
You can sometimes tell which strategy a company is pursuing by examining three key profit margins: gross profit margins, operating margins, and net profit margins. If a company can charge a premium price for its products, it tends to earn higher margins (on all three measures) than its competitors. (Flip to Chapter 7 for a refresher on profit margins.)
Figure 9-5 shows profitability ratios for American Eagle (symbol: AEO), a popular clothing retailer. This table, taken from Reuters.com, shows American Eagle’s ratios versus its industry and sector (that is, consumer discretionary). The following are some conclusions:
- Gross margins: American Eagle’s gross margins are 36 percent, which are below its industry group but above the sector. This is one sign that American Eagle’s shares might trade at a discount to its peers (holding all else constant; obviously if American Eagle were growing faster than its industry, that may argue for a valuation above its industry).
- Operating margins: American Eagle’s operating margins (on a trailing 12-month basis, TTM) are in line with its industry at 7.68 percent. Reuters also shows the 5-year average operating margins, which aren’t much different from the margins over the last 12 months. Had you seen the operating margins over the last 12 months higher than the 5-year average, it may be a sign that American Eagle’s operations were improving.
- Net profit margins: The net profit margin of American Eagle is 4.85 percent, above its industry average of 3.42 percent. (Remember: Net profit margins are equal to net income divided by sales. Of the three margins listed here, net profit margins are the most important.) Notice that net profit margins are low single digits — a sign of how competitive the clothing retail business is. Companies with low net profit margins tend to signal a cost focus or cost leadership strategy.
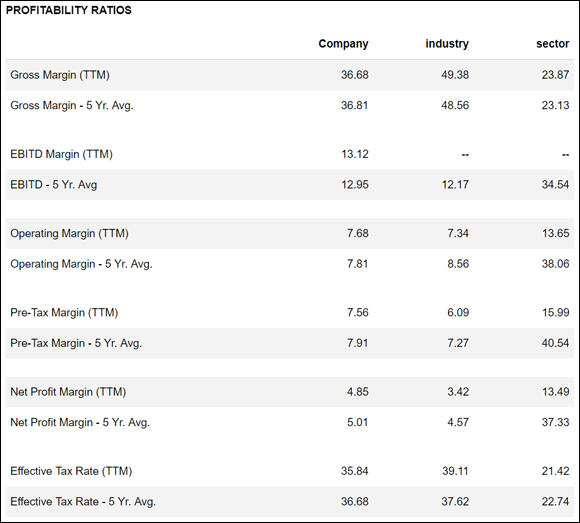
Source: Reuters Finance
FIGURE 9-5: Snapshot of the fundamentals of American Eagle (symbol: AEO).
Pay close attention to profit margins, especially relative profit margins. The Motley Fool (www.fool.com) recommends buying stocks of companies with net profit margins of 10 percent or more. I agree with this rule as a generality, but recognize that different industries have different forces that may inhibit a company from realizing such high margins.
Step 6: Estimating a Company’s Value
Valuing a company’s shares may be the single most important part of the Six Step Dance. Although you can value a company in several extensive ways, this step focuses on relative valuation models, which are the poor man’s valuation choice (perhaps that’s a poor choice of words — oops! that too). A relative model doesn’t answer the question, “How much is this company worth to the penny?” Instead, it answers the question, “Relative to its competitors, are shares of this company properly valued?”
So to end your stock analysis dance with high marks (and a wealth of knowledge to make the right decision for your swing trading), here’s what to do:
- Gauge whether shares of the company you want to swing trade are cheap or expensive relative to that company’s competitors.
- Analyze whether the relative cheapness or expensiveness is justified by reviewing expected earnings growth rates, expected sales growth rates, profitability ratios (such as return on equity or net profit margin), and financial strength ratios (such as current ratio or debt to equity).
I break down the nitty-gritty of these two essential steps in the next couple sections.
Gauging shares’ relative cheapness or expensiveness
Determining whether the shares of a company you’re looking to swing trade are cheap or expensive relative to its competitors is essential. Realize that this question is different from asking what the market capitalization of the company is. Just because a company’s worth $10 billion doesn’t mean it’s more expensive, on a relative basis, than a company worth $1 billion. The $10 billion company may be cheaper, for example, when earnings are compared at market value.
So how do you go about figuring out this relative value? By using the most accessible valuation metric — the price to earnings ratio (P/E) — in combination with other popular ratio metrics such as price to sales (P/S), price to cash flow, and PEG (P/E divided by the expected earnings growth rate). Each ratio has its pros and cons, which is why you need to use more than one when valuing a company.
Time to meet the ratio tools in your valuation toolbox:
P/E: Calculate P/E by dividing a firm’s share price by the trailing 12 months of earnings per share. A forward P/E is a firm’s share price divided by the expected earnings per share in the coming 12 months. P/E is a popular metric because earnings drive market prices.
P/E can easily be distorted on the positive or negative side. For example, a company may take a large one-time charge, which lowers its earnings per share temporarily. If you don’t back that charge out, you may value shares of the company incorrectly. That’s why you should always try multiple valuation techniques. When one adjusts earnings for one time gains or losses, the earnings are normalized.- Price to cash flow: I consider this ratio the most important one after P/E. Cash flow, like sales, is difficult to manipulate through accounting shenanigans. This ratio divides the market capitalization of a company by trailing 12 month cash flows (taken from the cash flow statement, which I cover in Chapter 7).
- PEG: Also known as the price/earnings to growth ratio, this is the only ratio that incorporates a firm’s growth rate into its calculation. I rank PEG closely behind the price to cash flow measure. You can calculate it by dividing a firm’s P/E by its annual EPS growth rate. A company trading at 20 times earnings but growing earnings at 30 percent per year would sport a PEG of 0.67.
- P/S: The P/S helps you value a company that doesn’t have earnings. This ratio is equal to a company’s market capitalization divided by total sales. Like P/E, P/S is widely reported. Sales are more difficult to manipulate than earnings (U.S. accounting rules notwithstanding), but they aren’t a helpful metric if a company’s unable to translate them into earnings. For example, Vonage Holdings (look back at Figure 9-3) had a superb P/S that kept on getting better because the company grew sales while it bled losses.
Use P/S sparingly and always within a single industry and not across industries.
For all four ratios, know that the lower the number, the cheaper the stock.
Figuring out whether the comparative share-price difference is justified
After you know how cheap or expensive a company’s stock is based on the four common valuation metrics (see the preceding section for details), you’re ready to determine whether that relative cheapness or expensiveness is justified. Peter Lynch, the legendary fund manager, posits that a company’s P/E ratio should be similar to its earnings growth rate. A company growing earnings 15 percent, for example, deserves to trade at 15 times earnings.
I agree with this postulation. You can determine a company’s growth rate by examining expected earnings growth rates. Just consider the case of a fast-growing company called Paycom Software (symbol: PAYC). Paycom is a payroll and HR software company that is disrupting its industry and growing like wildfire. But the stock is also super expensive.
At the end of 2018, shares of Paycom were changing hands around $120 per share with a P/E ratio of 83 times. Meanwhile, the industry group of Paycom had a P/E ratio around 35. With such a premium, shares of Paycom must be overvalued, right?
Not necessarily. Figure 9-6 provides a snapshot of Paycom’s fundamentals at the end of 2018. Although Paycom’s P/E is 137 percent higher than the industry’s P/E, Paycom’s five-year historical sales growth rate is 314 percent higher than the industry’s. Also, Paycom’s five-year historical EPS growth rate is 643 percent higher than its industry. By those measures, Paycom doesn’t look expensive relative to its industry.
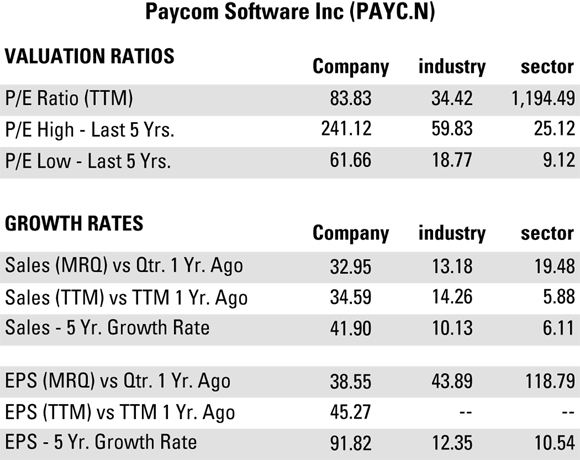
Source: Reuters Finance
FIGURE 9-6: Snapshot of Paycom’s fundamentals at the end of 2018.
Of course, what is most important is the future sales and earnings growth rates, not the past. But historical rates give us guideposts we can use. I prefer to use 3-year or 5-year historical annualized growth rates since one quarter or one-year historical growth rates can be fleeting or heavily influenced by one off events.
When looking at the future, it may be difficult to find long-term expected earnings or sales growth rates for stocks you want to swing trade. Therefore, look at what the growth rate in earnings is over the next few quarters and/or year.
Although sales and earnings growth drive differences in valuations between companies, profit margins and return on equity are also major factors that determine valuation differences. A low-growth company with high return on equity (anything above 20 percent) will often trade at a premium to its industry (assuming its return on equity is above its industry’s return on equity).
Here are two general rules:
- A company with higher profit margins or higher returns on equity than its industry usually deserves to trade at a premium to its industry, all else equal.
- A company with lower profit margins or lower returns on equity than its industry usually deserves to trade at a discount to its industry, all else equal.
Always keep relativity in mind when comparing the share prices of a company you want to swing trade with the prices of its competitors. You want to buy shares of a company that are relatively undervalued, meaning the company’s earnings growth rates and/or return on equity are superior to its industry, while on a valuation basis shares trade at a discount or in line with their industry.