Chapter 7
Understanding a Company, Inside and Out
IN THIS CHAPTER
![]() Conducting fundamental analysis through financial statements
Conducting fundamental analysis through financial statements
![]() Breaking down the key elements of financial statements
Breaking down the key elements of financial statements
![]() Considering qualitative data
Considering qualitative data
![]() Comparing a company to its peers with relative valuation
Comparing a company to its peers with relative valuation
In the roaring 1920s, stocks skyrocketed through the stratosphere and investors paid astronomical values for companies with borrowed money. The ensuring crash wiped out fortunes for many. From the dust of the crash came a seminal work that offered investors a methodology of valuing companies to help prevent a speculative fever from overtaking Wall Street again (but alas, human nature never changes). Benjamin Graham and David Dodd — professors at the time at Columbia Business School — published a seminal work in 1934 on corporate valuation called Security Analysis. They implored investors to focus on a company’s intrinsic worth, examine a company’s balance sheet, and only invest when there is a sufficient “margin of safety.”
In 1938, John Burr Williams wrote The Theory of Investment Value, which argues for determining a company’s worth by discounting future dividends, or simply putting a future value in today’s dollars. For example, $200,000 one year from now may be worth $181,818 today, assuming the “discount rate” is 10 percent (that is, investing $181,818 today and earning a 10 percent return yields $200,000 after one year).
Today’s investment models incorporate concepts from both these works to assess corporate value. Valuation nowadays is the process of using data from financial statements or comparable firms to assign a value for a company. This chapter introduces you to the important concepts in equity valuation — namely, what to look for in the companies you buy to determine if shares are undervalued. I believe that it’s possible to estimate a company’s value within a reasonable range of its actual value without spending countless hours working on a spreadsheet. The extra hours that Wall Street analysts put into forecasting is largely to improve the precision of their estimates. As a swing trader, it’s sufficient to know whether shares have 30 percent plus upside or not. You care less if the upside is 35 or 45 percent — only whether there’s enough upside to warrant buying shares.
 Whether you’re analyzing equities or another market, remember that you don’t need an advanced degree to intelligently use fundamental analysis. Following some general rules and taking some time to understand a company can go a long way toward improving your swing trading profits. That’s what this chapter discusses.
Getting Your Hands on a Company’s Financial Statements
Financial statements can be pretty daunting documents. They don’t have any pictures, and they’re written in pretty boring language (not like the hilarity of this book). Financial statements really should carry some type of warning label that says, “Do not operate heavy machinery while reading these statements.”
To help you avoid the pain of reading minutiae that you’re unlikely to ever need, I’ve broken down the financial statement puzzle into three broad categories:
- What to look for
- When to look
- Where to look
What to look for
Public companies are required by law to file reports with the U.S. Securities and Exchange Commission (SEC) — a government agency that enforces securities laws — at least on a quarterly basis and sometimes more frequently.
The SEC filings you should be aware of, including filings that cover a firm’s financial statements, are listed here. Even if you never visit the SEC website (www.sec.gov) in your life — and that may not be such a bad thing — you should be familiar with the nomenclature (fancy word for “words”) of the industry:
- 10-K: Yes, at first glance the 10-K sounds like a marathon or perhaps $10,000. But in fact, the 10-K in this context refers to an annual report companies must file with the SEC that contains a wealth of information. The 10K contains audited financial statements, information on a company’s history, lines of business, competitive information, management’s expectations, and more. Most publicly traded companies in the United States must file the Form 10-K 60 or 90 days after the end of their fiscal year. (A fiscal year usually begins January 1 and ends December 31, but some companies have fiscal years ending in June, September, or other months.)
- 10-Q: The 10-Q is a quarterly report companies must file with the SEC. It’s shorter than the 10-K and contains, most importantly, a firm’s financial statements. Firms also may break out details on quarterly performance and the reasons for an increase or decrease in earnings or sales. Most publicly traded companies in the United States must file the Form 10-Q 40 days after the end of their quarter.
- 8-K: Companies file 8-K forms after some material event occurs in their business that they must alert shareholders to. These events can be positive or negative, such as being acquired, entering bankruptcy, acquiring another company, or failing to meet an exchange’s listing requirements. Form 8-K filings are very timely because public companies must file them within four business days after the event occurs.
Concurrent with the release of earnings, companies conduct conference calls to discuss the prior quarter. These conference calls also provide the opportunity for listeners to ask questions of the CEO, CFO, and other executives. If you’ve never listened to this kind of conference call, don’t worry. You’re not missing out on much. It isn’t a party, the jokes are dry, and the executives are anxious to wrap it up. Listening to these calls is a necessity for long-term investors, but not for swing traders (though it is useful). The time commitment required to listen to several companies’ conference calls makes doing so impractical. Fortunately, many research services now offer transcripts of conference calls that can be digested in 15 minutes or so.
When to look
As a swing trader, you must know when a company is slated to release its earnings. You can contact the company directly to find out its earnings release date, but many brokers and research providers now provide the earnings announcement dates.
 If you’re considering trading shares of a company, wait until after it releases its earnings report because earnings announcements can cause major movements in a stock price — up or down. Consequently, predicting whether a company’s results will please Wall Street is difficult. Often a company may report robust earnings with an unimpressive outlook that sends shares spiraling downward. (Don’t forget that stocks tend to fall much faster than they appreciate. Commodities, on the other hand, tend to rise much faster than they fall.)
Fundamental data, unlike technical data, doesn’t change on a day-to-day basis. Financial statements are at least one month stale, meaning a lag exists between when a company releases its statements and the end of the period. So some financial statements may be two or three months old, depending on when you view the data. Corporate press releases come out on a more frequent basis but are often immaterial. The big fundamental news days are when a company releases its quarterly earnings.
Quarterly earnings provide traders with an update on the company’s operations. Often they include selected information from financial statements (full financial data often isn’t disclosed until the company files its Form 10-Q with the SEC; see the preceding section). Quarterly earnings reports also update traders on whether management feels comfortable with its sales or earnings targets (assuming the company sets such targets; they are under no obligation to forecast their results in the United States).
Where to look
Many moons ago, getting a company’s financial statements was a hassle that involved finding the number for the company’s investor relations department, calling to request an investor’s packet, and waiting for it to arrive via snail mail. People often had to do a lot of legwork to get the information they needed, so imagine how much work went into analyzing just ten potential prospects! Back in those days, swing trading wasn’t really popular because of steep commissions. Waiting days to receive financial information was yet another barrier.
Fortunately, the Internet has changed all that. With the click of a mouse, you have access to thousands of companies’ financial statements. The time it takes to bring up a new firm’s financial statements depends only on how long it takes you to type in that firm’s ticker symbol.
You can access a company’s financial statements by visiting the SEC website at www.sec.gov/edgar/searchedgar/companysearch.html, but it’s not especially user friendly. A better option is to visit websites that provide the information for free — and plenty of them are out there. For instance, Yahoo! Finance (https://finance.yahoo.com/) provides financial statements in an easy to read format. You can get quotes, charts, corporate information, analyst coverage, ownership, and financials on most any publicly traded company.
Assessing a Company’s Financial Statements
So what should you be looking for when a company reports earnings? The most common question to ask yourself is: “Did the company meet, beat, or disappoint expectations?” This guideline applies to both sales and earnings for the previous period as well as any future guidance provided. The larger the percentage beat, the better.
Expectations drive Wall Street. A big surprise can be a signal that analysts aren’t accurately projecting a company’s earnings. A company that shows a trend of rising earnings surprises (for example, a 10 percent earnings surprise, followed by a 15 percent earnings surprise and a 20 percent earnings surprise) often has superior price performance relative to the market. Conversely, companies with negative earnings surprises have poor price performance. Consider the case of a2 Milk Company, a publicly listed company in New Zealand. a2 Milk reported a string of positive earnings surprises of 10.2 percent for the period ending December 2016, 19.2 percent for the period ending June 2017, and 24.0 percent for the period ending December 2017 (unlike U.S. listed companies, New Zealand companies report earnings semi-annually instead of quarterly). Between December 2016 and December March 2018, shares of a2 Milk rose 482.2 percent in New Zealand dollar terms (not a typo) or 505.6 percent in U.S. dollar terms. The earnings surprise momentum wasn’t the sole reason for the rise, but it provided a clue that something positive was brewing.
 Read over the quarterly earnings reports for hints on future performance. Management may hint at problematic times ahead with words such as “challenging” and “competitive environment.” These are signals that earnings may not meet consensus expectations, and therefore you should carefully examine major changes in debt levels, cash levels, cash flows (if disclosed), and inventory levels.
The first step in analyzing financial statements is to understand their components. Granted, financial statements may seem frightening, not to mention boring. In my opinion, watching paint dry is more exciting than looking at a financial statement. And that’s why this section isn’t an academic lesson in accounting. Rather, I give you a basic understanding of what makes up financial statements and, even better, how you can view summaries on the Internet. Wall Street analysts read through hundreds of pages of financial statements before writing up reports on companies (or at least they are supposed to). Fortunately, you don’t need to do anything close to that to be a profitable swing trader.
Public companies must issue four main financial statements each quarter. As a swing trader, you need concern yourself with only three of them.
Balance sheet
A balance sheet is a snapshot of a firm’s financial health. Does the company have a lot of debt? Does it have a lot of cash on hand? You can answer these questions and more by viewing its balance sheet.
The balance sheet breakdown
The balance sheet is separated into assets (usually the first half of the balance sheet) and liabilities and shareholders’ equity (usually the second half). These two sides must equal each other. Academic textbooks often present assets on the left-hand side of a page and liabilities and shareholders’ equity on the right-hand side. In real life, expect to see liabilities and shareholders’ equity below the assets section.
Assets are items a company owns that provide some future benefits — like cash, inventory, or plant and equipment. They’re further divided into current and long-term assets:
- Current assets are those assets that are expected to be converted into cash within one year. Items you’ll find in the current assets section of a balance sheet include cash, inventory, and accounts receivable (credit the company is expecting to convert into cash). You want to see that a company has a good amount of current assets relative to its current liabilities (which I get to shortly).
- Long-term assets refer to items that are expected to be used for more than one year. Expect to see items such as land, plants and equipment, and long-term investments. There’s no good absolute number you want to see in this arena. Some industries are capital intensive and require lots of long-term assets. Others, like technology companies, have few long-term assets (except for perhaps patents). Within the same industry, a firm that achieves more profits per total assets is often valued higher than a firm that achieves fewer profits per total assets.
On the liabilities portion of the balance sheet, you find items the company owes others. Like assets, liabilities are divided into two categories: current and long-term.
- Current liabilities are expenses the company is expected to pay over the next year (short-term debt, salaries, expenses, and the like). You want a firm’s current assets to be at least 1.5 times its current liabilities when you buy shares in a company, generally, to remove major risk that the company may face a liquidity problem in the coming year.
- Long-term liabilities are those debts due beyond one year. Long-term debt is usually the most important long-term liability. Compare long-term debt to shareholders’ equity. Ideally, a company should have little long-term debt relative to equity — say less than 30 percent. The more debt a company has, the riskier the company is.
Finally, shareholders’ equity (sometimes presented as owners’ equity) is the difference between total assets and total liabilities. This is what’s left over for equity/stock shareholders after meeting the obligations of debt holders. Shareholders’ equity includes share capital and the amount of earnings the company has accumulated over time.
How to properly assess a balance sheet
You can develop a feel for a company’s financial health by looking at balance sheets and surmising whether the company is in good, average, or poor shape. Use these guidelines to help you:
- Cash is king. The more cash a company has relative to its debts, the better. The less cash a company has relative to its debts, the worse off it is.
- Compare current assets to current liabilities. A ratio of 1.5 or higher is usually a sign that the company isn’t going bankrupt in the next 12 months. A ratio below 1 may signal real problems ahead.
- Compare long-term debt to shareholders’ equity. The higher the percentage, the more leveraged a company is. Stick to buying companies with debt levels below 30 percent.
- Large increases in accounts receivable are a red flag. If a company’s accounts receivable grow faster than sales, it may mean the company is extending loose credit terms to increase sales. And that can spell trouble if the company is unable to recover all amounts owed to it.
- Large increases in inventory levels are a red flag. If inventories rise faster than sales, the company may be on the cusp of a slowdown as it works to sell off inventory. This problem is more pronounced in the technology sector where inventory values quickly decline due to technology advancements.
Figure 7-1 brings these concepts to life with the balance sheet of a publicly traded company, Amazon.com (symbol: AMZN). Identify the key parts of the balance sheet: current assets, long-term assets, current liabilities, and long-term liabilities. (You won’t know every line item that appears in this example. Further research can help you understand those items that I don’t cover.)

Source: www.sec.gov
FIGURE 7-1: The balance sheet of Amazon.
Glancing quickly over the balance sheet, you should notice that Amazon has more current assets than current liabilities as of September 30, 2018: $59.9 billion versus $55.3 billion. The current ratio is therefore 1.08. I prefer to see a current ratio above 1.50. However, I’m not overly concerned because I see that $6 billion of current liabilities are marked as unearned revenue. Unearned revenue refers to revenues you receive cash payments for without having provided the product or service. In that sense, it’s a liability to Amazon until it delivers the goods. Unearned revenues are a good liability unlike an account payable or debt. If you remove this $6 billion from Amazon’s current liabilities and recalculate the current ratio, the current ratio rises to a more respectable 1.21.
Something else that should jump out at you is the leverage Amazon employs. Long-term debt ($24.68 billion) relative to shareholders’ equity ($39.12 billion) is a high 63 percent. Companies with high leverage can face difficulties when the economic cycle turns. I’m not worried about Amazon given its ample cash reserves ($20.43 billion), which could pay the majority of the company’s debt.
The amount of research you conduct beyond the cursory examination presented here depends on the type of swing trader you are. More work can help you make better decisions, but there isn’t enough time in one day to closely examine several companies. One shortcut is to look for balance sheet ratios (provided, for example, on Reuters finance website), which can quickly tell you a company’s debt and liquidity position. Figure 7-2 shows an example for American Eagle (symbol: AEO).

Source: www.reuters.com
FIGURE 7-2: The financial strength ratios of American Eagle (symbol: AEO).
Remember that as a swing trader, you have to allocate your time in the most efficient way possible. Spending half of your time on a single company isn’t going to be appropriate when your time horizon is measured in days or weeks. You can’t pore over hundreds of pages of SEC filings to discover details that may, or may not, influence your decision to swing trade the stock. Instead, make sure you understand the basics and use resources that can reduce the amount of time you spend on each candidate, allowing you to quickly reject the stock (which should happen most often) or put it into a bucket for further consideration.
Income statement
The income statement shows a company’s profit and losses over a period of time. That time is usually reported as 3 months and 12 months. The main parts of the income statement are the revenues, gross profit, operating income, and net income.
The income statement breakdown
Revenues is a fancy way of saying sales. In Europe, revenues are often called turnover. Whatever term you use, this financial statement represents a company’s lifeline. Without sales, you can’t make profits. Growth-oriented companies can grow sales at double (and even triple) digit rates in times of economic expansion.
After revenues, an income statement lists a firm’s gross profit (the amount of profit left over after a company subtracts all direct costs related to making a product or providing a service — called cost of goods sold). An example best illustrates these terms: If Dummies Corporation reports sales of $10 million in 2019 (due, no doubt, to the success of Swing Trading For Dummies), the firm’s cost of goods sold would include the cost of printing the book, hiring yours truly to write it, paying editors to proofread it, and more. These are all direct costs. You wouldn’t include any indirect costs, like the salary of the CEO, in the calculation of the cost of goods sold because they aren’t directly attributable to the cost of the book.
Gross profit is often calculated as a percentage of sales. The higher the ratio, the more profitable the firm. Often companies receive higher valuations because of higher gross profit margins.
After gross profit, the next main heading in the income statement is the operating income. Operating income is what’s left over after taking out all indirect costs from the gross profit figure. Indirect costs include selling, general, and administrative costs. Marketing, for example, is considered an indirect cost. The costs of electricity and office desks are also indirect. Subtracting these items from gross profit yields operating income.
Finally, a few more subtractions are made from operating income to arrive at net income — the bottom line. Subtract interest expense (like interest payments on debt) and taxes and you get net income. Net income is usually presented in dollars and as a per share figure. That is, companies divide net profit by the number of shares the company has outstanding in order to calculate income per share.
How to properly assess an income statement
Keep these suggestions in mind to stay on your game and spot strength and weakness in income statements:
- Compare sales growth rates (year over year) to net income growth rates (year over year). Ideally, you want to see net income rise at a faster pace than sales.
- Keep an eye on the trend of gross profit as a percentage of sales. A rising ratio is a healthy sign, whereas a declining ratio is a red flag.
- Keep an eye on the trend of operating income as a percentage of sales. Again, a rising ratio is a healthy sign and a declining ratio is a red flag.
- Compare sales and earnings to year-ago periods. Comparing either figure to prior quarters rather than the prior year may lead you to incorrect conclusions regarding the company’s health.
- Track net profit margins over time. Determine whether net profit margin (net income divided by sales) is increasing, decreasing, or stable over time. Net profit margin expansion is often coupled with P/E ratio expansion (meaning investors will pay a higher price or higher multiple for a company with rising or high net profit margins than for one with low or falling net profit margins).
- Watch for growth in outstanding shares. This growth can be a red flag that the company is issuing more shares and thereby diluting existing ones.
Figure 7-3 shows the income statement of Apple for the 12 months ending in 2018, 2017, and 2016. Identify the key parts of the income statement: revenues, gross profit, operating income, net profit, and net income per share (earnings per share, or EPS).

Source: www.sec.gov
FIGURE 7-3: Apple’s annual income statement for three years.
Apple posted revenues of $265.595 billion in the year ending September 30, 2018. Looking at annual figures, you can compare Apple’s revenues over time, which wouldn’t be possible if you were looking at a quarterly income statement and compared, say, Apple’s fourth quarter with its third quarter. Why? Because in many businesses, seasonality exists. For example, a toy manufacturer will experience a steep drop in sales after the holiday shopping season. Therefore when you compare quarters, make sure you compare one quarter to the year-ago period and not to the previous quarter.
In Apple’s case, you can see that revenues grew by 15.9 percent in 2018 versus 2017. That’s impressive — especially for a company Apple’s size. Of course, investors care most about the future, not the past. So Apple’s expected performance will drive shares.
Gross profit as a percentage of sales basically remained unchanged from 2017 (at 38.5 percent) to the 2018 (38.3 percent). (Comparing items that are a percentage of sales across quarters isn’t as problematic as comparing sales or earnings across quarters.) You would want to be alert if gross profit margins rose or dropped considerably; although you want to see growth, you also want to understand what’s causing that growth.
Operating income as a percentage of sales fell from 27.8 percent in 2016 to 26.70 percent in 2018. This decline isn’t concerning for two reasons (1) the absolute number of the decline is small, and more importantly, (2) the reason for the decline isn’t a bad reason: Apple increased its spending on research and development (from 4.66 percent of sales in 2016 to 5.36 percent of sales in 2018). Research and development is an investment in the future, and therefore the small decline in profit margins isn’t overly concerning because Apple is investing for its future.
Finally, you can see that Apple’s net income profit margin rose from 21.2 percent in 2016 to 22.4 percent in 2018. The increase isn’t significant, but it’s a positive sign that Apple has maintained its pricing power and cost discipline. Apple’s shares outstanding declined from $5.47 billion in 2016 to $4.96 billion in 2018. This is a positive trend and reflects Apple using its cash to buyback shares.
Cash flow statement
Accounting statement are accrual based, meaning that sales, expenses, and other items are recorded when they’re earned or incurred, not when cash is actually received or paid. For that reason, swing traders and investors need an important bridge to determine how much cash actually came into the company and how much cash went out.
The cash flow statement solves the problem. It tells you how much cash the company generated (cash flows from operating activities), what it did with its cash (cash flows used in/generated from investing activities), and whether it borrowed money or paid out cash (cash flows from financing activities).
The cash flow statement breakdown
The first section of this financial statement details cash flows used in or generated from operating activities. It starts with net income and makes various adjustments to tally up how much cash was generated or used during the period — ending with cash flow from operating activities. What kinds of adjustments are made? An increase in inventories reflects a use of cash and therefore should be subtracted from net income. On the other hand, a company adds back non-cash expenses taken out of net income in the income statement. Non-cash expenses are costs a company recognizes on its income statement that aren’t actually paid out. For example, if a company owns a car used for business, it may recognize a $5,000 non-cash expense in one year to reflect the car’s loss of value. That expense lowers net income but doesn’t actually reflect a $5,000 cash payment. For that reason, depreciation expenses are added back to the net income in the cash flow statement.
As a swing trader, don’t get too caught up in the details. The most important item of this section is cash flow from operating activities — the bottom line. This shows whether the company actually generated cash from its business during the period. A company can report strong net income and have negative cash flow if a majority of sales are on credit, for example. Look for cash flow from operations to be consistent with net income (that is, they should rise together and fall together).
The second section of the cash flow statement is the cash flow from investing section. The most important item here is usually capital expenditures, or the costs incurred to maintain, upgrade, or acquire physical assets. Generally, the smaller the level of capital expenditures relative to sales, the better.
The third and final section of the cash flow statement is the cash flow from financing activities section. This part of the statement shows any dividends paid and any issuance or payment of debt or stock. Ideally, a company can sustain its operations from the cash it generates internally, but sometimes a company looks outside itself to fund growth. It may borrow money or issues shares of stock. Issuing stock dilutes the value of other shareholders’ equity, and borrowing money may saddle the company with a debt burden that’s difficult to bear.
How to properly assess a cash flow statement
Always look at a cash flow statement with these points in mind so you can more easily spot a company’s strengths and weaknesses:
- Compare cash flow from operations to net income. Net income rising with cash flows declining is a negative sign. Falling net income with rising cash flows may reflect a high level of non-cash expenses.
- Keep an eye on capital expenditures (in the cash flows from investing activities) relative to sales. The higher the ratio, the less cash is available for dividends, share buybacks, research and development, and so on. Some capital expenditures are necessary for any business, but firms with low capital expenditures can generate higher growth rates and returns for shareholders.
- Look at the methods the company depends on for its cash. Does it generate its own cash from operations and not need to borrow money? Or is the company issuing stock and heavily borrowing to make ends meet? Answering “yes” to the first question is a good thing; “yes” to the second question is not.
- Look for major changes in the cash flow from the financing activities section. A large amount of debt issuance may be a red flag. Payment of debt, on the other hand, is a good sign that a company is deleveraging itself.
- Watch for large items or breaks in historical levels of cash flows. Both can signal major events like an acquisition or payment of debt. Paying down debt is generally a good thing, whereas acquisitions can be good or bad. Unless acquisitions are a part of a firm’s strategy, I’m often weary of them. A recent KPMG study found that 70 percent of mergers and acquisitions actually reduce shareholder value.
Check out Figure 7-4, the cash flow statement of Twitter.
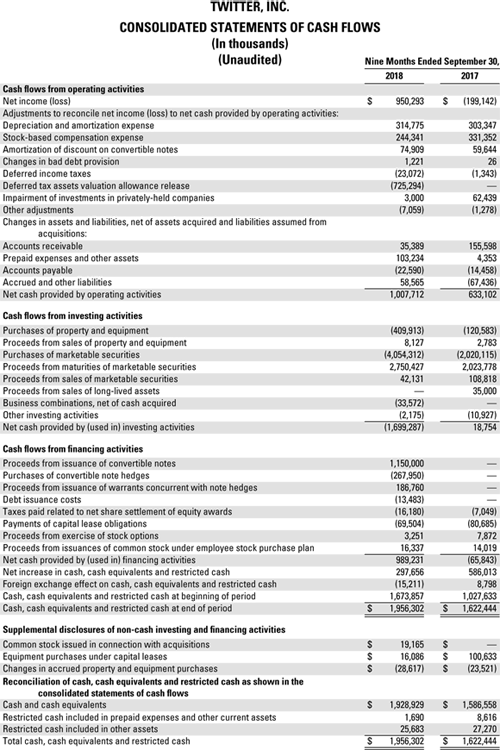
Source: www.sec.gov
FIGURE 7-4: The cash flow statement of Twitter for the nine months ending 2017 and 2018.
Notice that Twitter reported net income of $950.293 million in the nine months ending September 30, 2018, but generated cash from operations of $1.0 billion. Capital expenditures were $409.9 million during the nine months, consuming 40 percent of the cash generated from operations. The main drag on cash flows from investing activities is a large investment in “marketable securities” of $4 billion. Because of the gap between cash flow generated from operations and cash flows used in investing activities, Twitter borrowed $1.15 billion (listed as “proceeds from issuance of convertible notes”); the net cash flows provided by financing activities for the nine-month period ending September 30, 2018, was $989.23 million.
Analyzing More Than Just Numbers: Qualitative Data
Fundamental analysis isn’t just based on numbers. A company is more than its earnings, sales, and so on. Would you value a company led by a well-known investor the same as a company led by your neighbor? Qualitative factors also determine whether a company’s stock is a value or not.
Some qualitative factors that great performing stocks often share are
- High management ownership: Insider ownership is a sign that the executives who run the company are putting their money where their mouths are. The financial ownership also aligns shareholder interests with management’s interests. A CEO is likely to think twice about taking an action that may depress the stock price if he or she owns a good chunk of company stock in a 401(k) plan. The rule of thumb here is that insider ownership of at least 10 percent of outstanding shares is a bullish sign.
A wide moat: Hundreds of years ago, castles often used moats as a defense mechanism to prevent would-be attackers from successfully penetrating the castle walls. An economic moat is similar: It’s the degree of competitive advantage a company has that prevents competition from taking market share.
Warren Buffett, a well-respected investor and CEO of Berkshire Hathaway, is a major proponent of the idea of economic moats. He looks for companies that would be difficult to displace because of brand loyalty or cost advantages. Moats are often established in the pharmaceutical business because of drug patents that ensure the developer of a new drug will be the sole provider of that drug for a number of years.
You can see the world, to some extent, as consisting of companies with wide moats and those with more narrow moats (often commodities) — a product you can buy from anywhere and don’t care much about who manufactures it is a commodity. Think of things like scissors, sugar, screens (monitors), and many kitchen items. Contrast the businesses that provide these products with companies that have wide moats and are difficult to displace. Starbucks — which Jerry Seinfeld jokingly calls “Five Bucks” — is able to charge premium pricing for cups of coffee. Sometimes the moat may be a result of some technological advantage. Google, for example, was a tiny technology company in 1996 but developed a search technology that dwarfed the behemoths at Microsoft and Yahoo! In a short time, Google gained a major foothold in the search engine field and was able to translate that market share into advertising dollars.
Ask yourself when reviewing companies how difficult it would be for a company to displace the firm you’re examining. The more difficult it is to displace, the wider the moat.Positive catalysts: Catalysts help investors revalue shares upward. Successful products (like Apple’s iPhone) and new management are both catalysts that cause investors to revalue shares.
A catalyst can also originate from outside the company. When one company is acquired or bought out in an industry, competitors of that company often see share price increases as investors revalue shares based on the purchase price multiple used in the acquisition. Investors also often hope that another buyout will occur in the industry.
Negative catalysts that may propel shares of a firm downward can include an earnings miss, a competitor’s introduction of a new product, and the resignation of key management.
Valuing a Company Based on Data You’ve Gathered
You may feel like you can charge people for advice on analyzing financial statements, reviewing earnings reports, and evaluating qualitative data, but just how much is this darn company worth? There’s no line on the financial statements that says, “This company is worth $5 billion. Please do not pay more than this amount. Thank you.”
If you get ten different analysts in one room and ask them to analyze one company, you’re likely to get 11 different answers (ideally they’re at least close to one another). So there are differences in how investors value firms.
Understanding the two main methods of valuation
The two main ways stocks are valued today are relative valuation models and absolute valuation models:
A relative valuation model is likely the model you’ll use most often as a swing trader. Relative valuation is estimating a company’s value based on what its peers in the marketplace are trading at. The model may be based on earnings (using the price to earnings ratio, for example), sales (price to sales ratio), book value (price to book value), or a dozen other ratios.
By far, the price to earnings ratio (P/E) is the most common method of relative valuation. For example, if Macy’s and Dillard’s trade for 12 times earnings, then gosh darn it, maybe Kohl’s should too. Maybe it even deserves to trade at a premium to Macy’s because its earnings are expected to grow faster in coming years than its competitors. Or perhaps Kohl’s deserves to trade at a discount to its competitors because it has a lower net profit margin (net income divided by sales) than its competitors. You get the idea.
- An absolute valuation model is calculated independently of the valuations of a company’s peers. Instead of drawing conclusions based on what Macy’s or Dillard’s are trading, an analyst valuing shares of Kohl’s determines a value based on the company’s earnings, cash flows, or dividends. Corporate valuation differences arise primarily out of disagreements over expectations of future earnings. If it were possible to know with certainty how much a company would make in the next ten years, there would be little disagreement on the value of the company today.
Relative valuation models are easier and faster to calculate than absolute valuation models. Swing traders usually rely on relative valuation models because of the complexity and time commitment inherent in absolute valuation models. I address both here so you know that two basic methods of analysis exist, but because this book is targeted to swing traders, I don’t go into more detail on how to construct an absolute valuation model.
Implementing the swing trader’s preferred model
Using the relative valuation model is the quick and dirty way of getting you close to the actual value of a company you’re considering. All it takes are two easy steps:
Choose your price multiple.
This metric can be P/E, price to sales ratio (P/S), or Enterprise Value to Earnings before Interest and taxes (EV/EBIT).
Figure out what multiple your security should trade at for that multiple.
Determining what’s a “correct” P/E ratio (or any ratio) is no easy task. The best way to start is to look at the average P/E of the industry. Then, decide whether the company you’re assessing deserves to trade at a premium or discount to the industry. A company that can grow earnings faster than its industry is generally awarded a higher P/E than its competitors. A company with a higher profitability ratio (such as a higher return on equity, which is net income divided by average shareholder’s equity) is also generally awarded with a higher P/E ratio.
Figure 7-5 shows financial statistics of major drug manufacturers and the average statistics for the entire industry. Merck (symbol: MRK) trades at a premium to its industry on a P/E basis (24.58 times versus 21.31 times). But that may be justified given Merck’s operating margins (operating income/sales) of 25.22 percent versus the industry average of 14.53 percent. In addition to Merck, this figure shows statistics for Bristol-Myers Squibb (symbol: BMY), Pfizer (symbol: PFE), and Sanofi (symbol: SNY). Note: The acronym TTM stands for “trailing twelve months.”
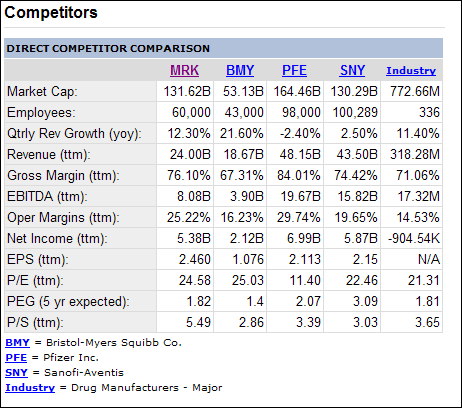
Source: Yahoo! Finance
FIGURE 7-5: Key statistics of several large drug manufacturers relative to the industry.
A swing trader looking at Merck may determine that a premium valuation is justified given the strength of operating margins and the recent quarterly revenues growth versus the average industry. Coming up with an appropriate multiple is more art than science. First determine whether the company should trade at a premium, discount, or in-line multiple versus its industry. If the company should trade at a premium or discount (because earnings growth or operating margins or return on equity are higher or lower than the industry average), determine an approximate size to the premium or discount by measuring how much higher or lower the company’s growth or margins are versus the industry. For example, a company growing twice the rate of its industry may be worth a price multiple twice its industry average. Alternatively, a company that’s growing at half the rate of its industry may deserve to trade at a discount that’s half the industry average.
Use the knowledge in this chapter to help you determine what an appropriate multiple is for a company you’re interested in buying (for example, a company with high cash balances and little debt may deserve to trade for a higher multiple than a company with low cash and a heavy debt burden). But if you come across an opportunity where the valuation doesn’t make sense, don’t buy shares in the stock. You may find a company growing sales and earnings at a 40 percent annual rate trading for a P/E of 75 or 100. Don’t let the growth rate lull you into accepting outrageously priced shares.
You can use other financial ratios to estimate the value of a company relative to its peers. Remember to make higher or lower allowances for things like profit margins, earnings growth rates, and efficiency ratios. Chapter 9 provides more details on how to determine a fair multiple. You may need to award a company (with a higher multiple and, hence, higher valuation) if it has strong earnings growth rates. Alternatively, a company with poor growth rates or poor efficiency ratios may need to trade at a discount to its peers.