Chapter 8: Data Science in Tableau Prep Builder
In this chapter, you'll learn how to go beyond the built-in capabilities in Tableau Prep Builder by extending it with R and Python code. R and Python are two of the world's most popular programming languages and can perform numerous data science functions. Tableau Prep allows you to pass your data to an R or Python script at any stage during your flow, with the exception of the input data step. When you insert a script, Tableau Prep will pass the data to R or Python using an API. The script will execute in the R or Python environment and then output the results back to Tableau Prep and your flow continues. The ability to embed scripts allows you to greatly improve the functionality of Tableau Prep and perform advanced functions that are not otherwise possible.
In this chapter, we're going to cover the following main topics:
- Preparing Tableau Prep to work with R
- Embedding R code in a Tableau Prep flow
- Forecasting time series using R
- Preparing Tableau Prep to work with Python
- Embedding Python code in a Tableau Prep flow
Technical requirements
To follow along with the recipes in this chapter, you will need Tableau Prep Builder, an internet connection, and administrative rights to install software.
The recipes in this chapter use sample data files that you can download from the book's GitHub repository: https://github.com/PacktPublishing/Tableau-Prep-Cookbook.
Preparing Tableau Prep to work with R
R is a statistical programming language favored by many data scientists. It is available free of charge and benefits from a vast online community for ideation and support. To find out more about R, visit https://www.r-project.org/about.html. R by itself does not support interaction with other applications such as Tableau Prep. In order to extend R with that functionality, we need to install Rserve in addition to R itself.
Important note
The R programming language and the R and RStudio application interfaces are not part of Tableau Prep; they are separate technologies. An in-depth look at R is beyond the scope of this book. However, every system is slightly different, and you may run into unexpected challenges. For help, please refer to the R website: https://cran.r-project.org.
In this recipe, we will provide general guidance for configuring your system successfully.
Getting ready
To follow along with this recipe, download the Sample Files 8.1 folder from this book's GitHub repository.
How to do it…
Start by opening your browser, then follow these steps to configure your machine:
- Browse to https://cran.r-project.org/mirrors.html. Select any of the sites listed, nearest to your physical location. For example, in the US, you may select https://mirror.las.iastate.edu/CRAN/:

Figure 8.1 – Select a mirror link for your country or nearest physical location
- Select the download link for your operating system at the top of the page in the Precompiled binary distributions section:
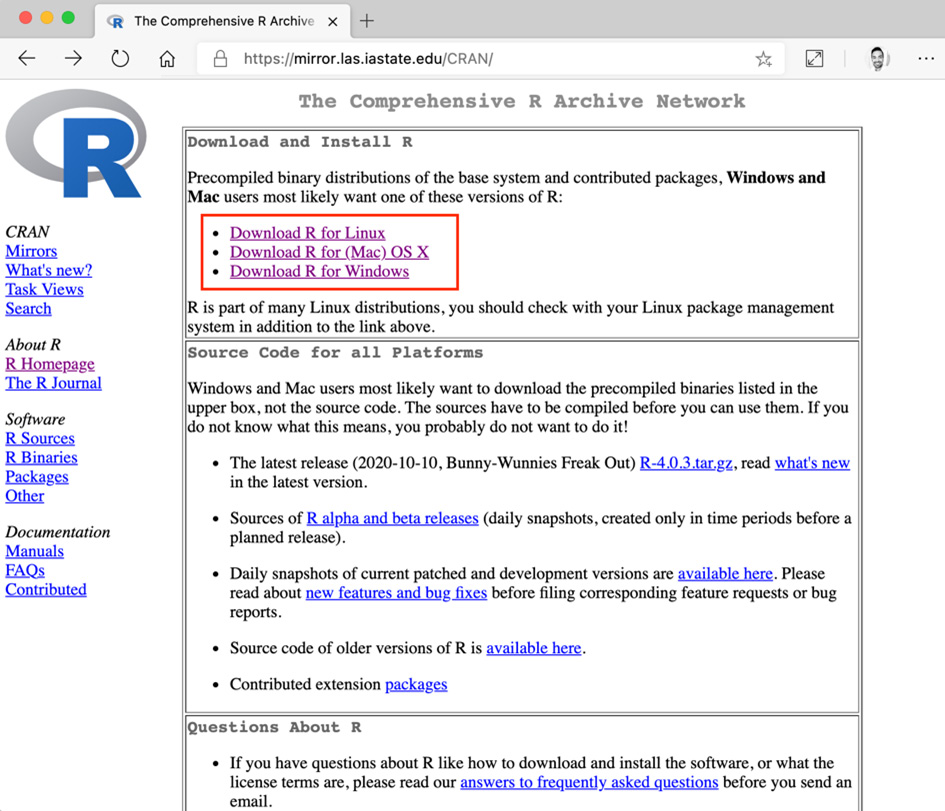
Figure 8.2 – Selecting a precompiled binary makes for an easier installation process than using the source code
- If you're on a Mac, select the latest .PKG file, which indicates notarized and signed to commence the download. If you've selected Windows, select base, then click the download link.
- Open up the downloaded installer and proceed through the installation, accepting all the default settings:

Figure 8.3 – Install R using all the default settings
- In addition to R itself, we are going to install RStudio Desktop. RStudio is an IDE for R. An IDE gives you an interface that allows you to interact with R a little easier. Browse to https://rstudio.com/products/rstudio/download/ and select the installer for your operating system in order to commence the download:
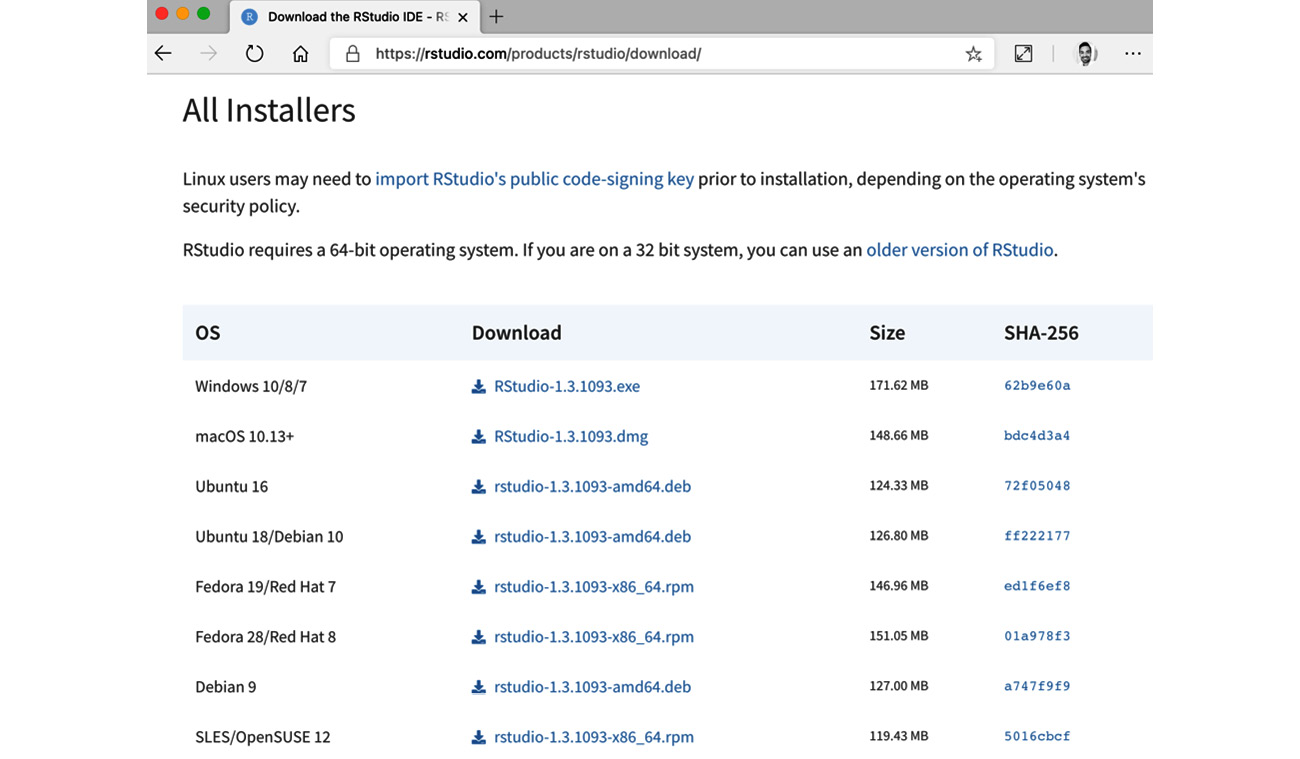
Figure 8.4 – Download RStudio Desktop
- When the download has completed, install RStudio Desktop. Accept any default options during the installation process.
- Next, we need to download the Rserve package. Rserve is a package that allows Tableau Prep to communicate with R. Go to https://www.rforge.net/Rserve/files/ and download the most recent snapshot.
Important note
Depending on your system configuration, not all versions may work for you. At the time of writing, we found that version 1.8.7 works for our intended purposes on both macOS and Windows. If you are familiar with RStudio, note that we are downloading the latest snapshot manually rather than using the built-in package manager, as the package manager may install an earlier version that has compatibility challenges.
The following screenshot shows the Rserve download page on the RForge website:

Figure 8.5 – Download the Rserve package
- Launch the RStudio application. From the toolbar, select Tools then Install Packages to bring up the package installer dialog. There, set the Install from dropdown to Package Archive File (.zip; .tar.gz). Doing so will bring up a file selector dialog where you can select the Rserve package file you just downloaded in Step 7:

Figure 8.6 – Install the Rserve package
- Click the Install button to install the Rserve package. The Console tab in RStudio will give you installation notes as it installs the package, which may take a few minutes. When the console displays DONE (Rserve), the installation has completed. You can also confirm the package is installed by searching for rserve in the Packages tab at the bottom right:

Figure 8.7 – Confirm package installation by searching for rserve
- Next, we need to start up Rserve, which will allow Tableau Prep to talk to R. To do this, enter the library(Rserve) command in the RStudio console and press the Return key. This will give the command line access to the Rserve package. Then, run the Rserve(args=" --no-save --RS-conf ~/Documents/Rserv.cfg") command to start up Rserve. The console will state Rserv started in daemon mode once Rserve is running:

Figure 8.8 – Finalize the R setup by starting Rserve
Important note
If you ever need to start Rserve again, for example, after your computer reboots, simply issue these two commands again.
- Now that Rserve is running, we need to tell Tableau Prep how to connect to it. To do this, open up Tableau Prep and from the Help menu, select Settings and Performance, followed by Manage Analytics Extension Connection:
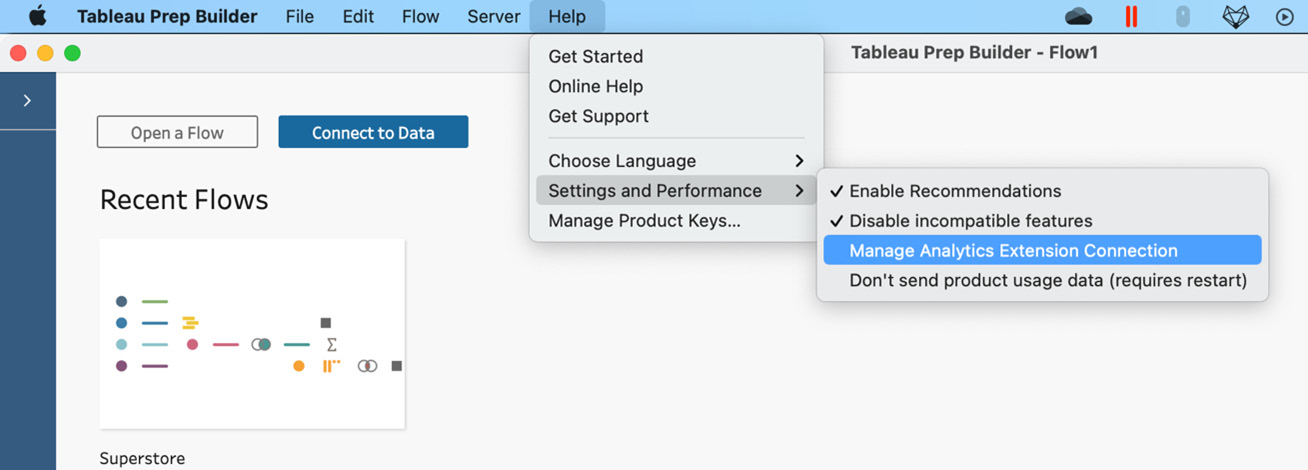
Figure 8.9 – Tableau Prep Manage Analytics Extension Connection
- Select Rserve from the dropdown, then set the server to localhost and the port to 6311, which are the defaults. Since we're using defaults, there is no username or password to set and so we can leave these fields blank. Click Sign In to complete the connection setup. Note that Tableau Prep will simply close the dialog without giving you a saved confirmation:
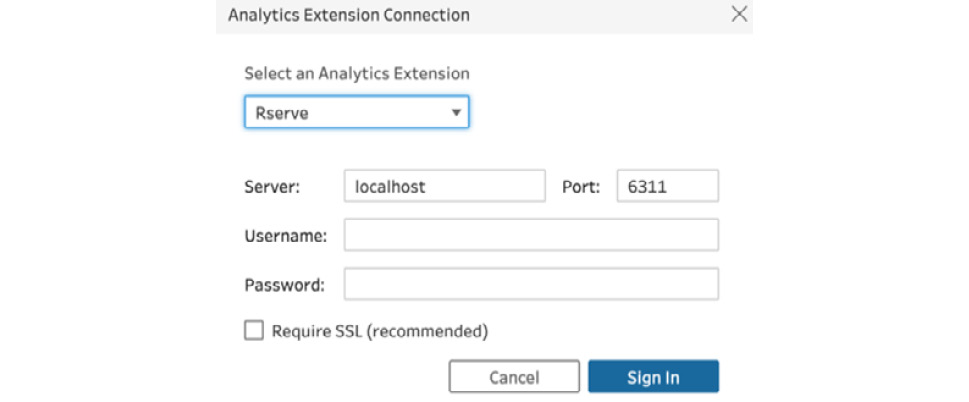
Figure 8.10 – Set up your connection to Rserve
This completes setting up R, Rserve, and Tableau Prep to talk to each other. From now on, you can start leveraging R scripts in your flows. In the next recipe, Embedding R code in a Tableau Prep flow, we'll do exactly that.
How it works…
In this recipe, we learned how to configure your Mac or Windows PC with R, RStudio, and Rserve. This will allow Tableau Prep to pass data to R for R to run a script against that data and return the results to Tableau Prep. Since R is a programming language, you can write virtually any function you desire, greatly expanding the functionality of Tableau Prep.
Embedding R code in a Tableau Prep flow
In the previous recipe, you learned how to configure your machine with R. You also set up a connection from Tableau Prep to R, using the Rserve package. In this recipe, we'll leverage that foundational setup to run an R script using Tableau Prep. We'll learn how to embed a script in our flow and understand how R sends the data back to our Tableau Prep data flow. The examples used are simple but form a solid foundation. Once you have mastered the basics, you'll be able to implement more advanced scripts, such as the script in the recipe titled Forecasting time series using R.
Getting ready
To follow along with this recipe, download the Sample Files 8.2 folder from this book's GitHub repository.
Important note
R is a programming language of its own, not covered by this book. We'll look at R code in this recipe at a very high level only, so you will gain sufficient knowledge to integrate R with Tableau Prep. However, a look at the R language itself is beyond the scope of this book.
How to do it…
Start by opening up Tableau Prep and connecting to the Transaction Amount by Date.xlsx Excel file included in the sample files for this recipe, then follow these steps:
- Click the + icon on the input step, then select Script to add an analytic script step:
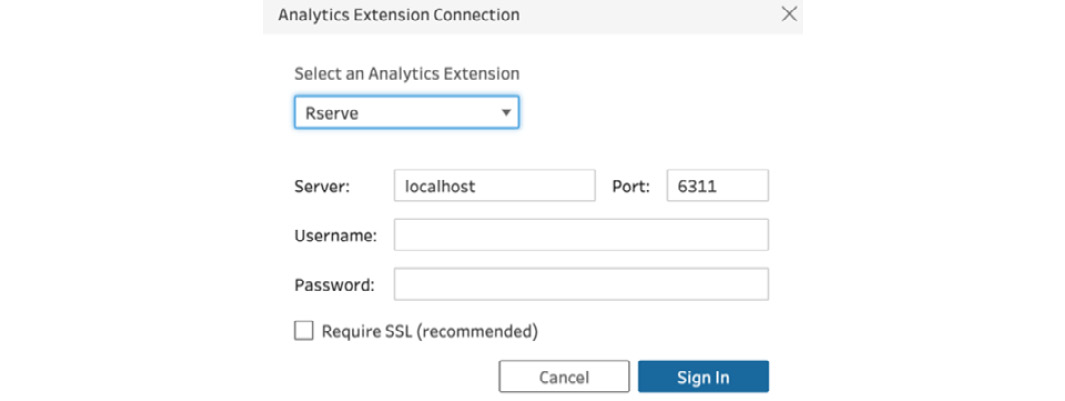
Figure 8.11 – Adding an analytic script step
- At the time of writing, Tableau Prep supports R and Python scripts. Both use the same analytic script step, and so we'll need to indicate which language we're using here. Since Rserve is the default, we can leave the setting as is. To complete the step configuration, we need to select an R script file and set the function name. Included in the sample files for this recipe is a file named R_functions_for_Tableau.R. For the moment, leave Tableau Prep and open the file in a text editor such as TextEdit, Notepad, or Sublime:
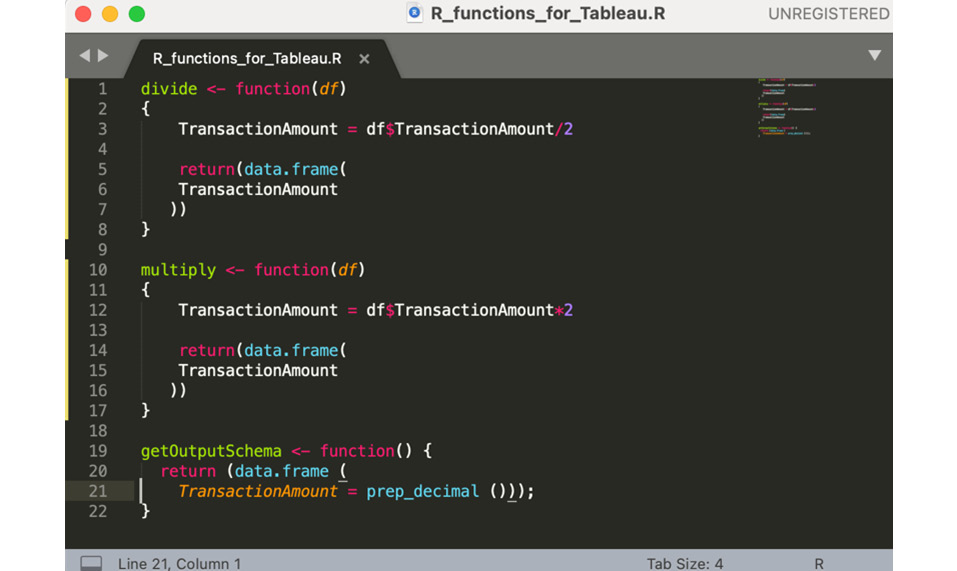
Figure 8.12 – R script opened in Sublime
This sample script contains three functions that'll help you better understand how to use R and Tableau Prep together.
The first eight lines contain a function named divide. The function uses the data from a DataFrame, df. Whenever you write an R script for Tableau Prep, calling a function with (df) will result in Tableau Prep passing data to that function.
This example function does nothing more than dividing a given number by 2.
Lines 10 to 17 demonstrate a similar function, multiply. Again, we see the use of (df) to pass data from Tableau Prep to this function. The function itself multiplies a given number by 2.
Lines 19 to 22 include a function named getOutputSchema. Whenever you want R to return data to Tableau Prep, you must use this function to do so. In this example, we're returning the TransactionAmount field to Tableau Prep. In this function, in addition to the name of the field to return, we must specify the data type for Tableau Prep. In this example, you can see that the data type for TransactionAmount has been set to prep_string(), which tells Tableau Prep that this field has a string data type.
The following table lists the various data types that are available, along with their respective functions to use in R:

- Return to Tableau Prep and in the Script step, click Browse to select the R_functions_for_Tableau.R script from the sample files folder. Then, set the function name to divide and press the Return key:
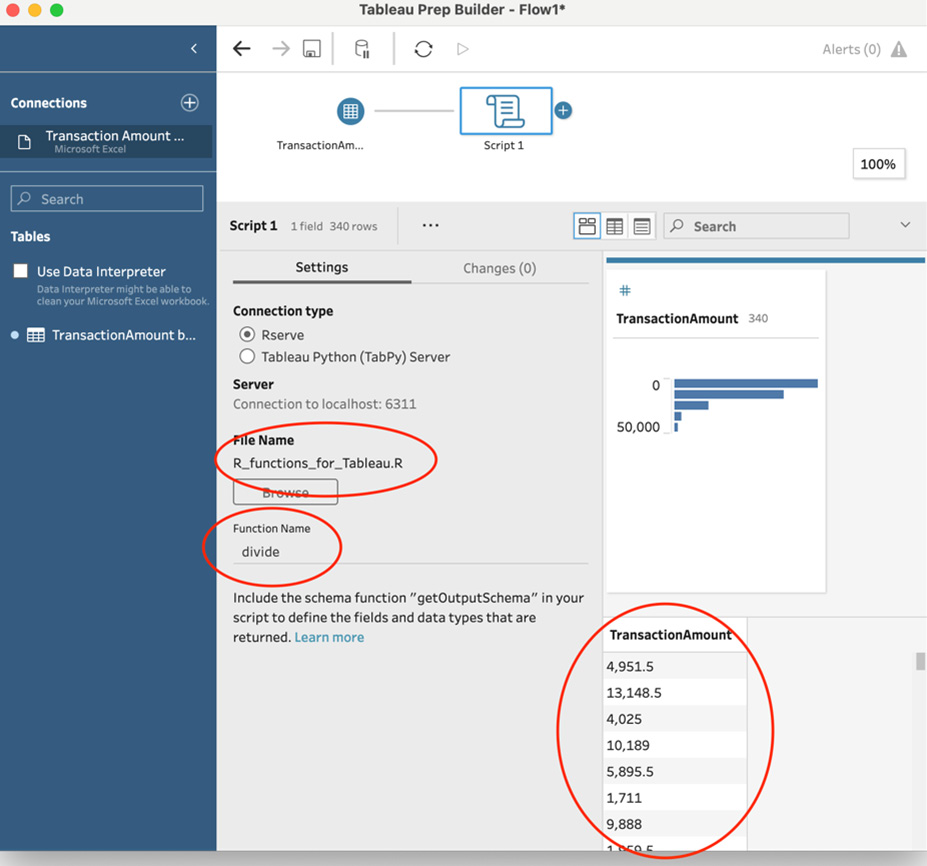
Figure 8.13 – Complete configuring the Script step
Pressing the Return key will instantly run the data through the R script. If successful, you will see the TransactionAmount field returned in Tableau Prep, with its original values divided by 2.
Important note
We only got one field back from R, TransactionAmount, yet we started our flow with two fields: Date and TransactionAmount. This is expected behavior; R will only return the fields as specified in its script. In our example script, in the getOutputSchema function, Date is not listed and therefore is not returned to Tableau Prep.
It is good practice to avoid sending unnecessary data to R and vice versa, as it could cause performance drawbacks, particularly when working with large datasets. You can always include a unique identifier and join the result from R back to your original dataset.
- Change the Script step function name from divide to multiply and press Return again. This time, R will return the TransactionAmount value multiplied by 2. This demonstrates that you can have a single R script file with many functions. Tableau Prep will only call the function specified in the Script step.
With these steps completed, you've successfully embedded a Script step with R in your Tableau Prep flow.
How it works…
In this recipe, we learned how to call an R script and a particular R function from within the Tableau Prep interface. In doing so, you've opened up the door to integrating advanced data science methods into your Tableau Prep data preparation process. We've learned that an R script file may contain multiple functions and that a script step in Tableau Prep can execute one of those functions by specifying the function name. We also learned that a function only returns data to Tableau Prep if it includes a specific function, getOutputSchema, and only the data specified in that function.
Forecasting time series using R
In the previous two recipes, Preparing Tableau Prep to work with R and Embedding R code in a Tableau Prep flow, you learned how to set up R, RStudio, and Rserve, as well as integrating an R script into Tableau Prep. The example script used was relatively basic and required no additional configuration. However, R is an extensible programming language, and many functions are bundled in what are called packages. In this recipe, we'll look at a more advanced script that has dependencies on such packages. You'll learn how to prepare R for these complex scripts that require additional preparation.
Getting ready
To follow along with this recipe, download the Sample Files 8.3 folder from this book's GitHub repository.
Important note
The R scripts in this book serve to illustrate the process of integrating R and Tableau Prep. Each dataset must be carefully analyzed prior to applying advanced functionality such as forecasting. The script referenced in this recipe is purely for illustration purposes and is not intended for real-world use.
How to do it…
Start by opening up Tableau Prep and connecting to the Transaction Amount by Date.xlsx Excel file included in the sample files for this recipe, then follow the steps:
- Click the + icon and add a Script step. Configure the step to use the forecast.R script provided with the resources for this lesson. Set the function name to forecastTS and press the Return key on your keyboard.
The forecastTS function contains a script that is designed to take time series data and predict, or forecast, future performance. In our case, our sample data contains Date and TransactionAmount. We'll run the data through this script, which has been designed to forecast the TransactionAmount value for the next 30 days (relative to the maximum date in our data):

Figure 8.14 – Configure the Script step for the forecastTS function
You'll notice Tableau Prep will show an error message when it is trying to validate the flow and leverage the specified R function. In this case, the error is caused by the fact that our script depends on extra R packages that we have not installed.
- Open up the forecast.R script in a text editor. Any time a script requires a package, it will refer to that package as library(package name). In this script, we can see that the script leverages many packages:
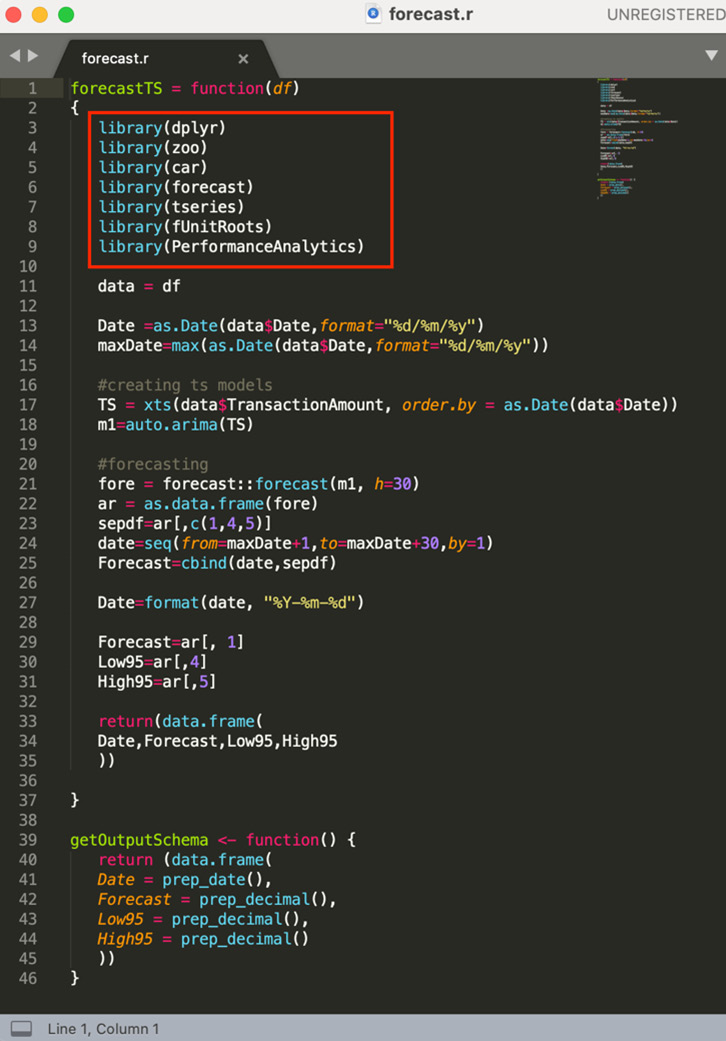
Figure 8.15 – Review the script for package (library) dependencies
- Open up RStudio and run the install.packages("package name") command from the console. This will cause RStudio to reach out to its online package repository to download the required files and install the package. You can issue multiple commands at the same time. For example, this code block will install all the packages our script needs:
install.packages("dplyr")
install.packages("zoo")
install.packages("car")
install.packages("forecast")
install.packages("tseries")
install.packages("fUnitRoots")
install.packages("PerformanceAnalytics")
Run the preceding code to install all packages. The following screenshot shows how your RStudio console will appear during this process:
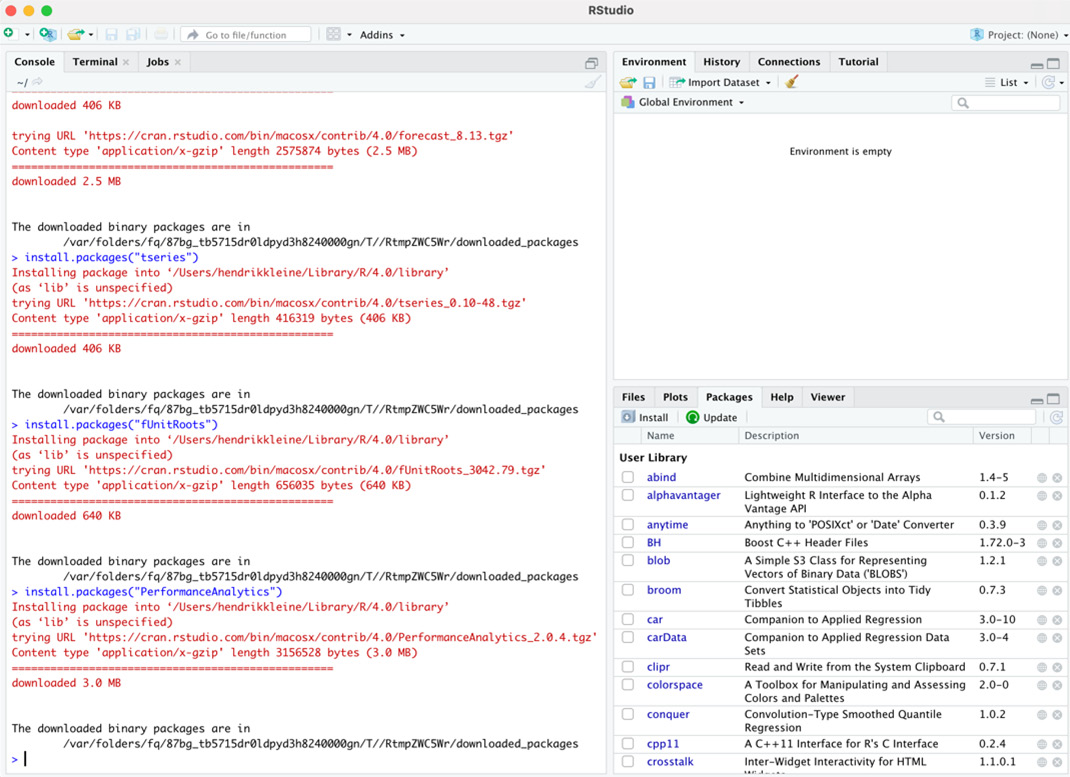
Figure 8.16 – Install missing R packages using RStudio
- Return to Tableau Prep and deselect the Script step by clicking any white space in the flow diagram. Then, select the Script step again. This will prompt Tableau Prep to re-run the script. This time, the script runs successfully and returns the forecast data to Tableau Prep:

Figure 8.17 – Advanced R script integration returning results to Tableau Prep
Important note
In Step 4, notice how the Script step returns more fields than were originally inputted. As highlighted in the previous recipe, titled Embedding R code in a Tableau Prep flow, which fields are returned to Tableau Prep is determined by the R script. Since an R script can also generate data and new fields, it is entirely possible for it to output more fields than were inputted. You can always refer back to the getOutputSchema function in the R script to evaluate what data is being returned to Tableau Prep.
With these steps completed, you've successfully integrated a complex R script in Tableau Prep.
How it works…
In this recipe, we learned how to install additional R packages to support complex R scripts. When it comes to R, there is a near-infinite amount of code possibilities driven by a large community of authors. It is good practice to consult your data science teams prior to implementing any R script in your Tableau Prep flow so that you can validate that the script is indeed appropriate for your data.
Preparing Tableau Prep to work with Python
Python is a general-purpose programming language ranking highly as one of the most popular languages right now. It is available free of charge and, similar to R, benefits from a community for ideation and support. To find out more about Python, visit https://www.python.org/. In order to allow Tableau Prep to communicate with Python, you need to prepare your machine with a Tableau Python server known as TabPy.
Important note
The Python programming language and the TabPy package are not part of Tableau Prep. Python is a separate technology and an in-depth look at Python is beyond the scope of this book. Every system is slightly different, and you may run into unexpected challenges. For help, please refer to the Python website at https://www.python.org/.
In this recipe, we will provide general guidance for configuring your system successfully.
Getting ready
If you are a Windows user, you must ensure you have Microsoft C++ Build Tools installed. You can download this at https://visualstudio.microsoft.com/visual-cpp-build-tools/.
How to do it…
Start by opening your terminal. On macOS, you can find your Terminal application in Applications, in the Utilities folder. On Windows machines, use the Start menu to search for CMD, then select Command Prompt from the search results:
- We'll first determine the version of Python you are running, if any. To do so, type python --version in your terminal and press Return:
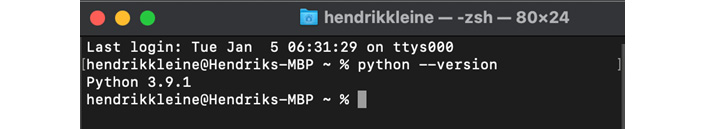
Figure 8.18 – Check your version of Python using the terminal
The terminal will either return a version number or inform you that Python was not found. If your version is lower than 3.8, which is what we are using while writing this book, or you receive the Python was not found message, you need to install a newer version of Python. If you have Python 3.8 or higher, you can skip ahead to Step 5.
- To install Python, go to https://www.python.org/downloads/ and download the latest 3.8.x version. At the time of writing, this is 3.8.7.
Important note
Not all versions of Python will be suitable for running TabPy. We found that the latest version (at the time of writing), 3.9.1, has some challenges with running TabPy. If you are a macOS user, it's important to note that all Macs ship with Python installed. The installation of a newer version may not cause the terminal to actually use that version. That is, you will see the same version number after the installation as you did in Step 1. This does not mean the installation has failed, but that your machine has multiple versions of Python installed. There are several ways to adjust this. However, which method you choose is up to you. It's a topic of discussion between Python programmers. You can select a simple solution, as described in this forum article: https://stackoverflow.com/questions/43354382/how-to-switch-python-versions-in-terminal/, or you can search online for a so-called Python version manager. As the scope of this book does not cover Python itself, we shall assume that, from Step 5 onward, you are able to run Python version 3.9.1 or higher from your terminal.
- Install Python. If you are on Windows, ensure you check the Add Python 3.8 to PATH box. Accept all other installer defaults and complete the installation:

Figure 8.19 – Check the Add Python to PATH checkbox on Windows
- Close any terminals you may have open. Then, re-open the terminal and run the python --version command to confirm your Python version is the version you just installed.
- Next, we need to upgrade the Python package manager, pip.
Important note
TabPy installation instructions are documented on TabPy's GitHub repository, which you can find at https://github.com/tableau/TabPy/blob/master/docs/server-install.md. Refer to this page if you experience any installation issues and verify the steps you've taken.
In your terminal application, run the python -m pip install --upgrade pip command to update pip, an installation manager that ships with Python.
- When done, run the pip install tabpy command to install the Tableau Python server, TabPy. This may take a few minutes to complete.
- Now that we have installed TabPy, we can start it using the terminal. Run the tabpy command to start up the Tableau Python server. Within a few moments, the terminal should return a message stating Web service listening on port 9004. This indicates your server is running. You can confirm this by opening your browser and navigating to http://localhost:9004/, which will display the TabPy server info page:
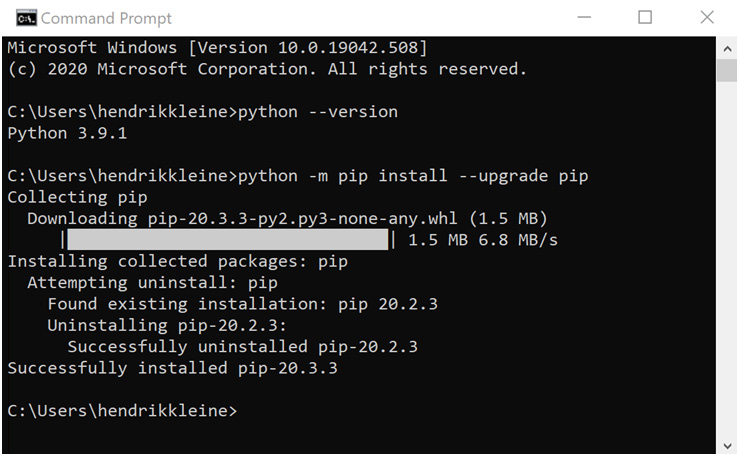
Figure 8.20 – Confirm TabPy is running by browsing to localhost:9004
Important note
Whenever you close all terminal windows or reboot your machine, you will likely shut down the TabPy server. To restart the server, simply open up your terminal and run the tabpy command again.
- Lastly, we need to configure Tableau Prep to use our new TabPy server. To do this, open up Tableau Prep and select Manage Analytics Extension Connection from the Settings and Performance section in the Help menu.
Set the server name to localhost and the port to 9004 and click Sign In to save your configuration:
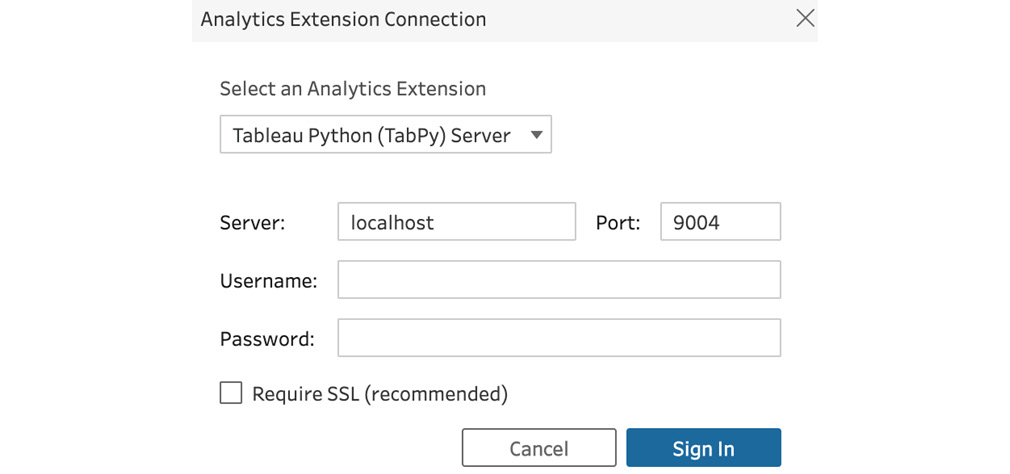
Figure 8.21 – Configure your Tableau Prep connection to the TabPy server
With these steps completed, you've successfully installed and started the Tableau Python server.
How it works…
In this recipe, we learned how to install and start the Tableau Python server, also known as TabPy, using the terminal. TabPy will allow Tableau Prep to communicate with Python. Similar to R, Tableau Prep will send data to an external Python process using TabPy, and TabPy will deliver any outputs back to Tableau Prep.
Embedding Python code in a Tableau Prep flow
In the previous recipe, we prepared our machine to work with Python, using the Tableau Python server. In this recipe, we'll create a Tableau Prep flow and embed a Python script in it. This process is largely the same as we've practiced in the recipes for R. Using this script, we'll evaluate a dataset and flag anomalies, that is, outliers.
Getting ready
To follow along with this recipe, download the Sample Files 8.5 folder from this book's GitHub repository.
Important note
The Python scripts in this book serve to illustrate the process of integrating Python and Tableau Prep. Each dataset must be carefully analyzed prior to applying advanced functionality such as anomaly detection. The script referenced in this recipe is purely for illustration purposes and is not intended for real-world use.
How to do it…
Start by opening up Tableau Prep and connect to the sales amount by date.csv file from the sample files folder:
- Click the + icon on the input step and select Script to add an analytic script step to your flow.
- Configure the Script step by setting the connection type to Tableau Python (TabPy) Server.
- Select the outlier detection.py file from the sample data folder as the script file.
This script summarizes time series data by day and then performs analysis to identify outliers, that is, relatively high or low numbers, relative to the entire dataset. You can open up the script in a text editor to look under the hood.
Similar to R scripts, we must specify a function and DataFrame for Tableau Prep to pass data to, and the script must include the get_output_schema function to return data to Tableau Prep. Unlike R, we do not have to install libraries used by our script upfront.
Important note
Tableau provides useful Python resources in its documentation, available at https://help.tableau.com/current/prep/en-us/prep_scripts_TabPy.htm.
The following screenshot shows a Python script, with a function named detect_outliers for the forecast function, and a function named get_output_data to return data to Tableau Prep:
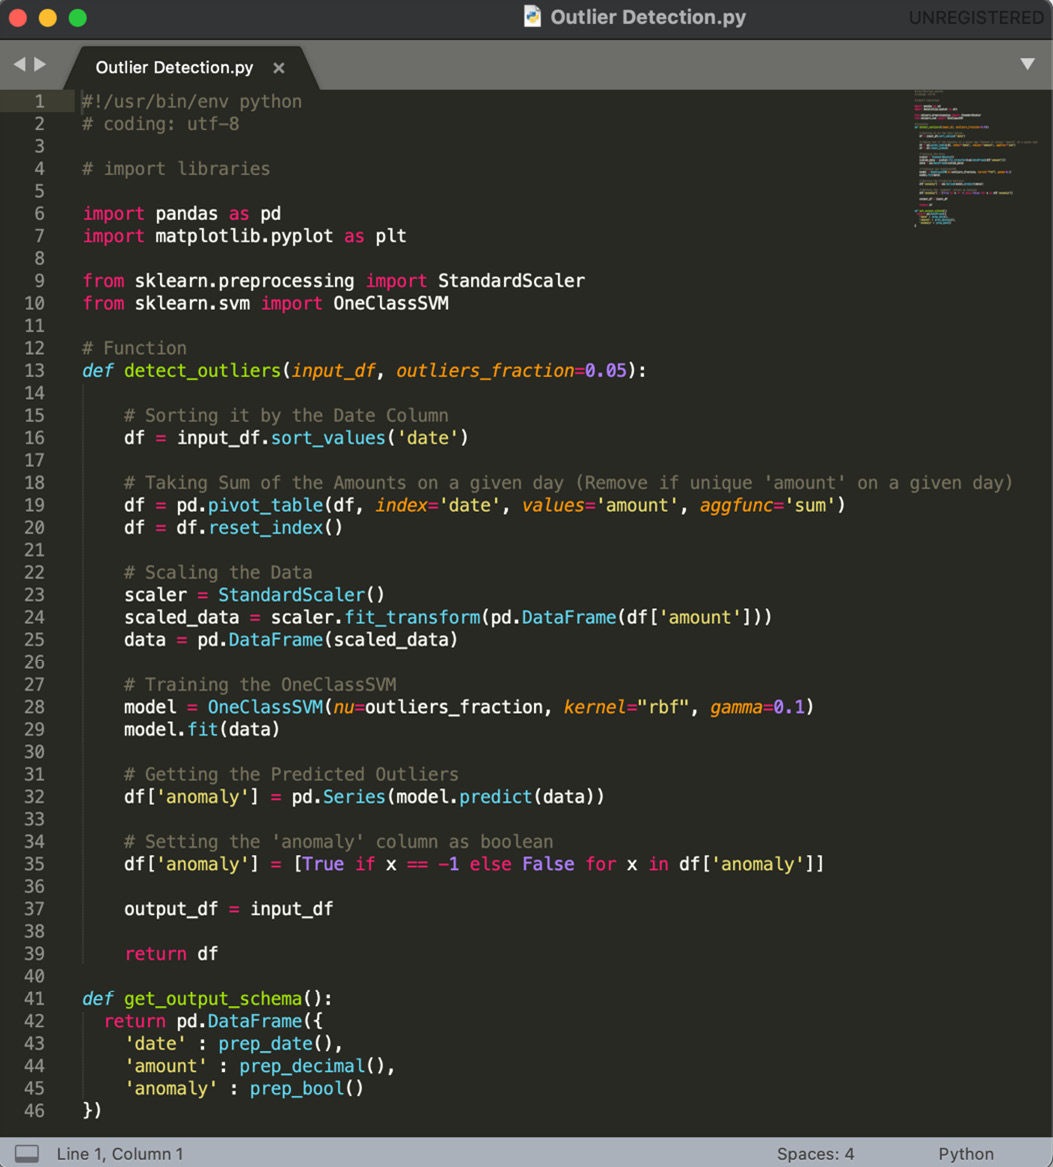
Figure 8.22 – Review the Python script
- Finally, we need to specify a function name. A script file can have multiple functions and we need to let Tableau Prep know which one to execute. As you can see from Figure 8.23, we have just one function, named detect_outliers. Set that as the function name:

Figure 8.23 – Fully configured Python Script step
- Press Return to complete the configuration. At this time, Tableau Prep will immediately run the Script step and after a few moments, you should see the result data. The script will return the source data, aggregated by day, and specify whether or not the value for that day was an outlier in the anomaly field.
Scroll through the data and observe the results. We can see that 11/01/2020 has been flagged as an anomaly. Looking at its value of 1,351, that makes sense as its neighboring values are significantly higher:

Figure 8.24 – Script results include an anomaly flag
With these steps done, you've successfully completed this recipe.
How it works…
In this recipe, we learned how to integrate a Python script into a Tableau Prep workflow. Similar to R scripts, a Python script may contain multiple functions, but the Script step can only perform the single function specified. The script must include a function named get_output_data to return data to Tableau Prep, as we have done in this recipe. This analytics extension can add significant functions to your flow that are not available out of the box.