
Chapter 4: Data Aggregation
Tableau Prep is designed with data preparation for analytics in mind. When it comes to reporting and analytics, more data is not always better, especially if you have a particular report in mind that you want to create. Pre-aggregating your data in a data preparation tool such as Tableau Prep instead of your business intelligence tool may result in significant performance gains when it comes to rendering your report.
In this chapter, you'll find recipes to help you prepare your data for analytics. Aggregation is a key part of data preparation. Aggregating your data appropriately in a Tableau Prep workflow can significantly reduce the output size. A smaller dataset will be more performant when connecting any analytics application, including Tableau Desktop.
In this chapter, we'll cover the following recipes:
- Determining granularity
- Aggregating values
- Using fixed LOD calculations for grouping data
- Grouping data
Technical requirements
To follow along with the recipes in this chapter, you will require Tableau Prep Builder and Tableau Desktop. We'll use the sample data supplied in the book's GitHub repository.
Determining granularity
One key consideration that is often overlooked is determining the granularity of the data that's needed. For example, when working with geographic data, you may have values for continent, region, country, state, city, ZIP code, street, and so on. But if you're only going to report on country data, you may not need all those other dimensions. Or perhaps you are processing order data; you may want to consider whether you need the details for each individual line item in each individual order – maybe your analysis will be fine with just the total order amount per day. In this recipe, we'll look at a quick method to help reveal the data actually in use in a Tableau Desktop visualization.
Getting ready
To follow along with this recipe, download the Sample Files 4.1 folder from this book's GitHub repository.
How to do it…
Start by opening the Superstore.tflx flow from the Sample Files 4.1 folder in Tableau Prep, then follow these steps:
- Click the Create 'Superstore Sales.hyper' output step in the flow and observe the number of fields shown in the profile pane at the bottom of the screen. These are all the fields that will be included in the hyper file when the flow runs:

Figure 4.1 – Review the output fields in the last step of your flow
- Click the play icon at the top of the screen to run your flow. If you've not altered the output settings, this will create the Superstore Sales.hyper file in your My Tableau Prep RepositoryDatasources folder on your PC:

Figure 4.2 – Click the play icon to run your flow
- Leave Tableau Prep open and start up Tableau Desktop. In Tableau Desktop, connect to the Superstore Sales.hyper file you just created:

Figure 4.3 – Connecting Tableau Desktop to a hyper extract
- Click Sheet 1 at the bottom of the screen to start a new visualization. To create the visualization from the list of available fields, drag Segment onto Columns and Sales onto Rows:
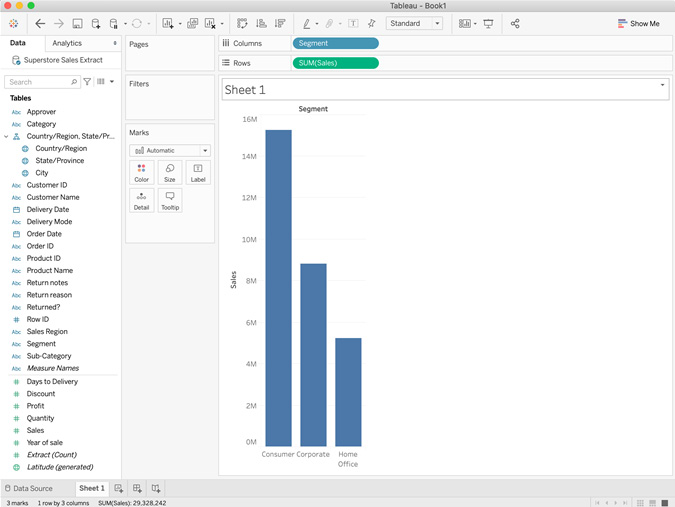
Figure 4.4 – New Tableau Desktop visualization
- From the menu bar, select Analytics, then View Data. Tableau will then display a dialog with the data that's present in the visualization. It should come as no surprise that the data contains the three segments and their sales amounts, as we saw in the bar chart. In the bottom right, you'll see that the row count is 3. In a more complex visualization, you'll see all the data that was presented in this dialog:

Figure 4.5 – Data that was visually presented in Figure 4.4
- In the View Data dialog, select the Full Data tab at the bottom, then uncheck the Show all fields option at the top. Finally, change the default preview value of 10,000 rows in the top left to 50,000. The value in the row box will automatically adjust the total number of rows, 40,889 in this case. The data that is displayed now is the data that Tableau Desktop processed in order to render the bar chart:
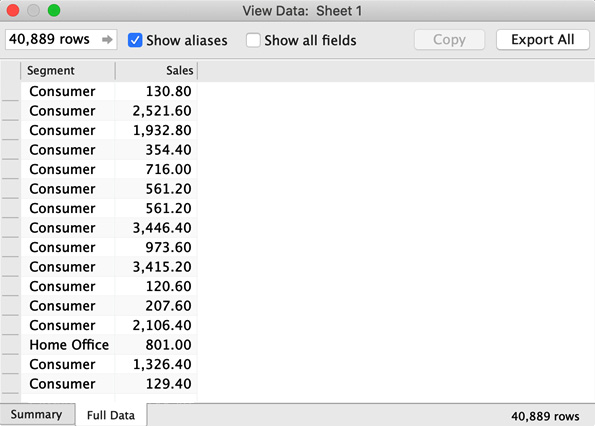
Figure 4.6 – Data that is processed in order to generate the visualization that was presented in Figure 4.4
In this example, we've determined that our data output from Tableau Prep contained many more fields than required to create the visualization. Furthermore, the fields that were required were more granular than required to render the visualization.
How it works…
In this recipe, we learned how to aggregate data in order to achieve a desired output with the minimum necessary data. Instead of an output with 26 fields and 40,889 rows, the visualization we created in Step 4 could have been created with an output of 2 fields and 3 rows.
What this demonstrates is that sometimes you may benefit from designing backward. First, determine the output, then determine what data and level of granularity is essential to produce that output. In this recipe, we've seen, using a very basic example, how we might want to start optimizing our flow output. As your reporting output becomes more complex, by adding more visuals, dashboards, filters, parameters, and so forth, designing backward becomes more challenging.
However, typically, the more complex and larger the dataset and output, the more benefits you may gain from choosing the right granularity and preparing your data accordingly in Tableau Prep.
In the following recipes in this chapter, we'll see methods for grouping and aggregating data in Tableau Prep.
Aggregating values
There are several methods to pre-aggregate your data in your Tableau Prep pipeline. Ideally, your data will be aggregated in your data connection. For example, when connecting to a database, you may be able to write a query that includes a GROUP BY statement so that the data is aggregated before being ingested into Tableau Prep.
Often, such an ideal scenario is not available for a variety of reasons, and sometimes it is simply not possible, for example, when connecting to files such as Excel or CSV files.
In this recipe, we'll look at the preferred methods for most users when aggregating data in Tableau Prep, using the aptly named Aggregate step.
Getting ready
To follow along with this recipe, download the Sample Files 4.2 folder from this book's GitHub repository. In this flow, you'll find a slimmed-down version of the sample Superstore flow provided by Tableau.
The last step in this flow contains more than 20 fields and outputs more than 40,000 rows. However, let's assume we are interested only in the total Sales amount by Segment. In this recipe, we'll achieve that output using the Aggregate step.
How to do it…
Start by opening the Superstore.tflx flow from the Sample Files 4.2 folder in Tableau Prep, then follow these steps:
- At the end of the flow, click the + icon to open the context menu and select Aggregate to add the Aggregate step to your flow:
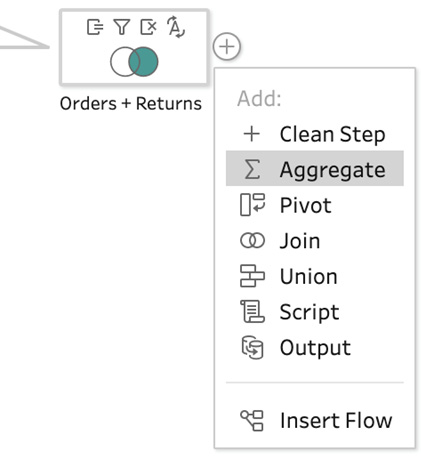
Figure 4.7 – Adding an Aggregate step
- Adding the Aggregate step will bring up its configuration pane at the bottom. Here we can select the fields that we want to aggregate by dragging them into the Aggregated Fields section. Drag the Sales field into the Aggregated Fields section. Notice how we instantly see the aggregated value of 29 million:
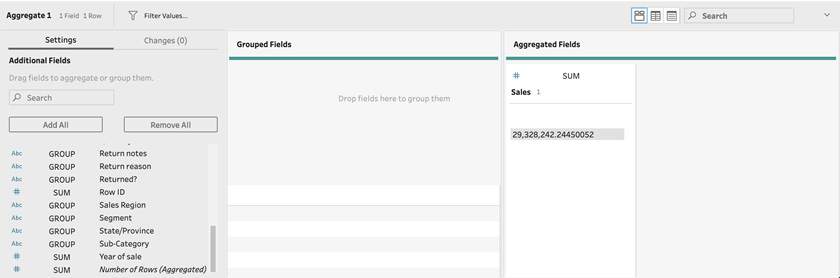
Figure 4.8 – Selecting aggregated fields
By default, aggregating a numeric value will be done by summarizing its value across all rows. However, you can select from a range of basic mathematic functions, as well as several statistical functions, to use for aggregation. To do so, click the SUM function on top of the field in the Aggregated Fields section, and select the desired function:

Figure 4.9 – Selecting a different aggregation function
- The preview we're seeing in Figure 4.8 is our current dataset that will be output, and so we must add Segment back in if we wish to view the sales amount by segment. We do so by creating a group. You can create a group by dragging the desired fields into the Grouped Fields section. Try it out and drag Segment into the Grouped Fields section:
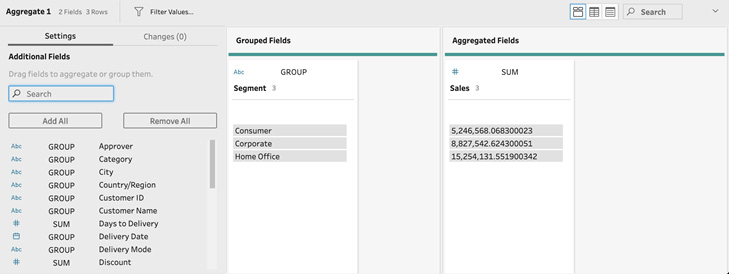
Figure 4.10 – greating Groups while aggregating
And with that, we've aggregated and grouped our data in just a few clicks. You can add other fields to the Aggregate step by simply dragging them into their respective sections. When doing so, you can always select a different aggregation function for each field. For example, you can summarize Sales but add the average Discount amount.
How it works…
Aggregating data in Tableau Prep performs the calculations in the data preparation flow rather than outputting all data just for it to be aggregated later in a data visualization tool. It's a process that requires careful thought as you'll want to provide the optimal dataset for the intended downstream analysis: not too broad and not too narrow. In this recipe, you've successfully performed data aggregation. In the process of aggregation, you've created groups. Furthermore, the data preview in Tableau Prep itself might have given you the answer you needed without having to perform additional aggregation steps in a data analysis tool!
Using fixed LOD calculations for grouping data
Level of Detail or LOD calculations are calculation expressions that have been available in Tableau Desktop for some time. An LOD calculation allows you to aggregate your data at different levels of granularity within a single dataset.
For example, you might have a dataset with customer orders, where each row represents a single line item in an order. You might want to aggregate revenue by order, or by customer, without losing the granularity of your data. This is where LOD calculations come into play. In this recipe, you'll create an LOD calculation. In doing so, you'll group your data into distinct buckets and aggregate values in a single step.
Getting ready
To follow along with this recipe, download the Sample Files 4.3 folder from this book's GitHub repository. You must have Tableau Prep version 2020.1 or greater to leverage the LOD functionality.
How to do it…
Start by opening Tableau Prep and connect to the December 2016 Sales.csv file from the Sample Files 4.3 folder in Tableau Prep, then follow these steps:
- Click the + icon on the input tool and add a clean step to your flow:
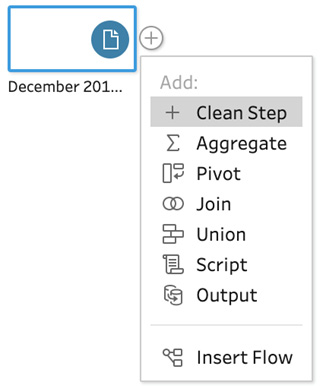
Figure 4.11 – Adding a clean step
- Suppose we want to see the total Transaction Amount value for each department. As seen in the Aggregating values recipe earlier in this chapter, we can achieve that output with the Aggregate step. However, in doing so, we'd lose the LOD available. In order to prevent this, we'll create an LOD calculation. Expand the menu of the Department card, then, from the Create Calculated Field section, select Fixed LOD:

Figure 4.12 – Adding a fixed LOD calculation
This step will cause an immediate error in your flow. That's expected, as we need to take another step to configure the LOD calculation:

Figure 4.13 – Tableau Prep flow validation will raise an error with the previous step
- Now that we're presented with the Fixed LOD dialog, we need to populate the Compute using section in order to complete the calculation. In our case, we want to aggregate Transaction Amount. To do this, select Transaction Amount from the list of values and select SUM as the aggregation method, then click Done:
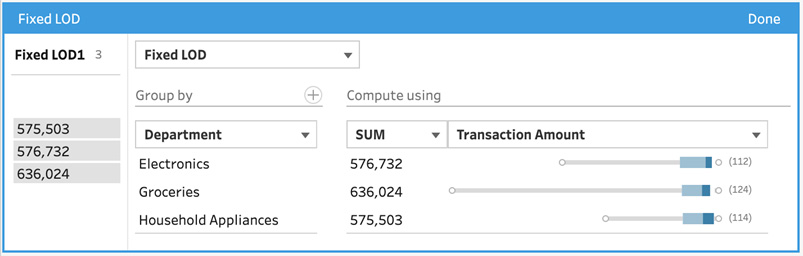
Figure 4.14 – Completed fixed LOD calculation
- Tableau Prep will instantly add a new field at the beginning of your dataset, named Fixed LOD 1. You can quickly rename this field to something friendlier by double-clicking the name and typing in Total Transaction Amount by Department. From the profile pane, we can quickly see the result of our action; the new fixed LOD field has only three values, one for each department. However, the original Transaction Amount field still exists with all its original values:
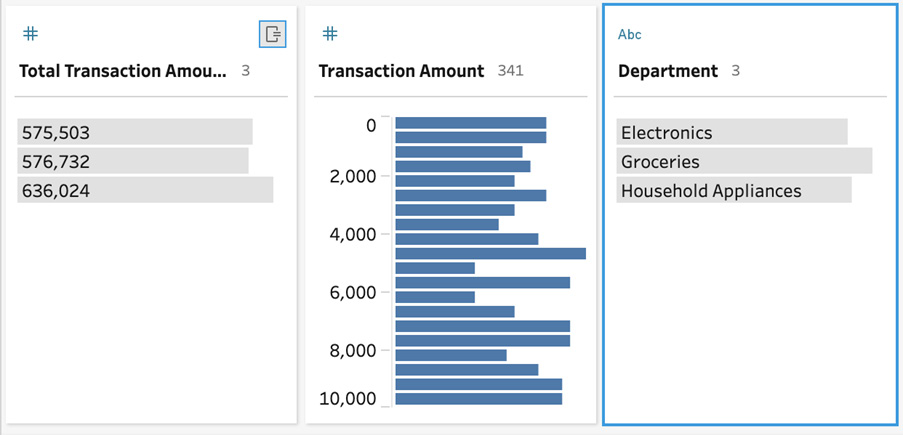
Figure 4.15 – Multiple LODs for Transaction Amount
Tip
Ensure that whoever is using your output understands the various levels of detail in your output. There are certain calculations that need to be avoided with the LOD field. For example, a graph plotting the Department and Total Transaction Amount by Department fields will have inflated results as it will summarize values that have already been aggregated.
How it works…
Tableau Prep uses the same calculation expressions as Tableau Desktop. In this recipe, you've created an LOD calculation that resulted in the creation of a group and value aggregation in one powerful move.
In this recipe, Tableau Prep has done the hard work behind the scenes and created the appropriate LOD calculation based on our selections. You can view the calculation by opening the Changes pane:
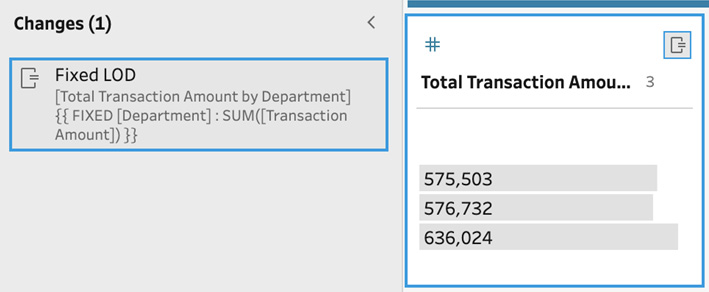
Figure 4.16 – Viewing the LOD calculation in the Changes pane
You're now able to leverage LOD calculations to perform quick data preparation, and even data analysis, in Tableau Prep!
There's more…
To find out more about LOD calculations, you can download the Tableau Desktop whitepaper Understanding Level of Detail (LOD) Expressions from https://www.tableau.com/learn/whitepapers/understanding-lod-expressions.
Grouping data
Grouping data in Tableau Prep can be done as part of the Aggregate step, as we've seen in the Aggregating values recipe earlier in this chapter. The function we'll review in this recipe is different, in that it can group values from a single field based on certain criteria.
As an example, values in a Name field might include John Smith and Smith, John. These might refer to the same person, and so we can group them together as John Smith. Performing this type of grouping is key to your data preparation efforts and ensures the downstream analysis does not run into issues with seemingly duplicate names.
Getting ready
To follow along with this recipe, download the Sample Files 4.4 folder from this book's GitHub repository.
How to do it…
Start by opening Tableau Prep and connect to the 2016 Sales.csv file from the Sample Files 4.4 folder in Tableau Prep, then follow these steps:
- Add a clean step to your flow and observe the values in the Department field in the profile pane. We can see some of the data here has been entered inconsistently. Specifically, we have Groceries and Grocery and Electronics, Electrics, and Electrics Dept:
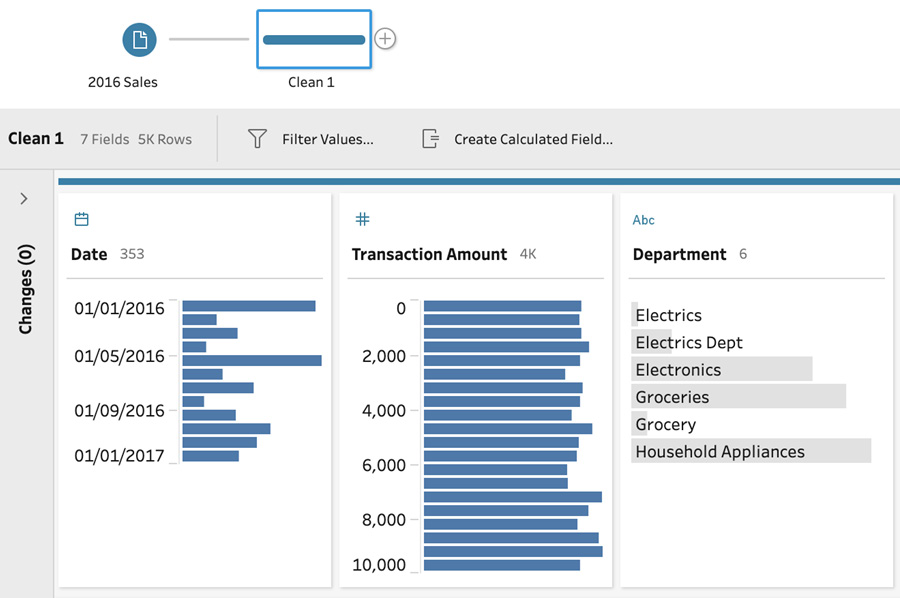
Figure 4.17 – Quickly locate inconsistent values in the profile pane
- Let's resolve the issue by using grouping. Select both the Electrics and Electronics (hold the Ctrl key on your keyboard) fields. Do not include the Electrics Dept value. Then, right-click and select Group:
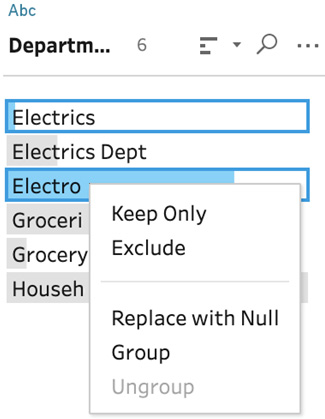
Figure 4.18 – Select Group in the context menu
- After the grouping action has been completed, a little paperclip icon will show up next to Electronics, indicating that multiple values are grouped together. Your data map changes over time and as a result, new values may be introduced. Let's assume the Electrics Dept value was added later. To edit the current group, right-click Electronics (the item with the paperclip) and select Edit Group Members:

Figure 4.19 – Edit group members
- In the group members edit dialog, select Electrics Dept followed by Done to update your group to include all three variations of Electronics.
- Thus far, we've been grouping data manually, that is, selecting values and grouping them. Tableau Prep has a number of built-in algorithms that can perform grouping for you automatically. Let's try this out on the Department field by opening the context menu, selecting Group Values, and then selecting Pronunciation:
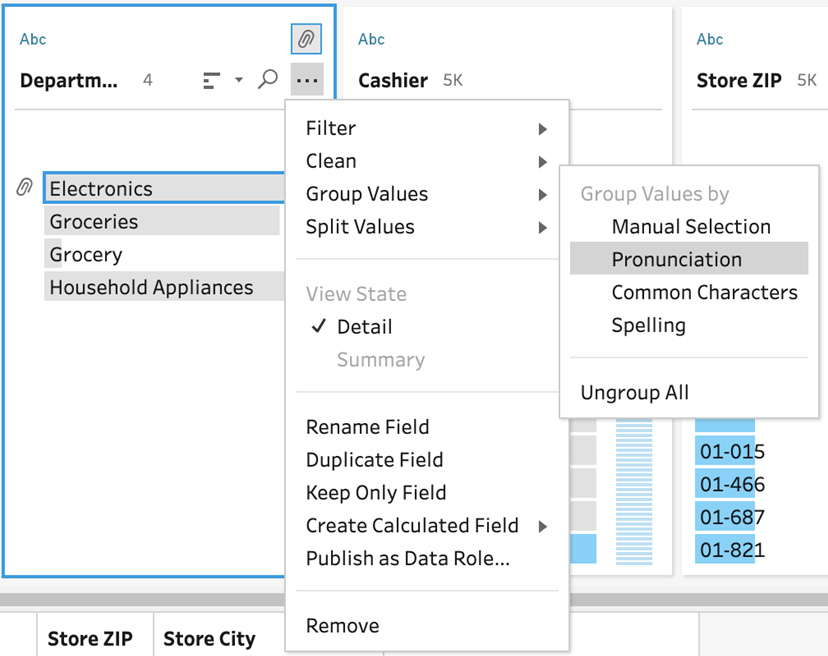
Figure 4.20 – Grouping values using algorithms
- The edit group member dialog opens up automatically so we can instantly view the results of this algorithm, and we can see here that it has grouped Grocery and Groceries together, as we wanted. Take note of how this edit group dialog is different from the manual grouping one we saw earlier. There's a slider at the top that influences the results of the algorithm. In this case, we see how similar the pronunciation should be in order to allow grouping. You can move it to the left and right to instantly see the effects it has:
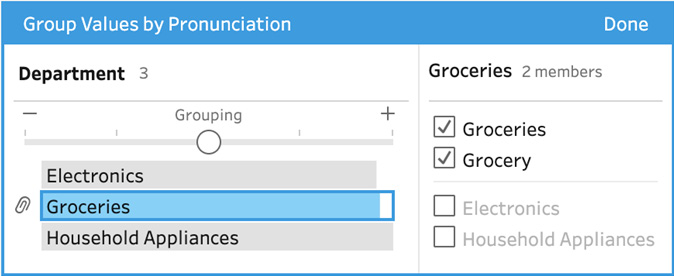
Figure 4.21 – Use the Grouping slider to influence the algorithm
How it works…
In this recipe, you've manually grouped data. You've also reviewed the different options available to you, including manual grouping, pronunciation, common characters, and spelling grouping options. When you run your flow, Tableau Prep will replace any value in your group with the name of the group itself. Grouping is a great thing to do to improve the quality of your data and make the resulting analysis more robust.
There's more…
There are three algorithms you can use for the automated grouping of values in Tableau Prep. Here is a summary of each of them. Each of these is available from the Group menu:
- Pronunciation: Using the Metaphone 3 algorithm, this option groups words by their pronunciation. It's particularly useful for the English language.
- Common characters: This option looks at the ngram fingerprint of a value. In doing so, it determines the characters in common between different values, irrespective of order. For example, the names Michael David and David, Michaels have similar characters and will be grouped together.
- Spelling: Using the Levenshtein distance algorithm, Tableau Prep will group values with similar spelling. This is particularly useful when your data has text entries where you expect similar values, but misspellings may occur. Unlike the pronunciation option, the spelling option works for any language.
With the knowledge gained in this recipe, you're now able to leverage the different types of data grouping options available to you in Tableau Prep.