
Chapter 3: Cleaning Transformations
All of Tableau Prep Builder's functionality is designed around the purpose of combining, shaping, and cleaning your data for downstream analysis. In this chapter, we'll look at the various transformations available to you to shape and clean your data.
In this chapter, you'll find the following recipes, which will help you transform your data:
- Renaming columns
- Filtering your dataset
- Changing data types
- Auto-validating data
- Validating data with a custom reference list
- Splitting fields with multiple values
Technical requirements
To follow along with the recipes in this chapter, you will require Tableau Prep Builder. We'll use sample Excel files supplied in the book's GitHub repository, so there's no need to connect to a database. In each recipe, however, you can replace the suggested sample input data source with any connection type that suits your scenario.
The recipes in this chapter use sample data files that you can download from the book's GitHub repository: https://github.com/PacktPublishing/Tableau-Prep-Cookbook.
Renaming columns
When it comes to cleaning data, one of the simplest yet most powerful actions might be simply renaming your fields to a more user-friendly format.
Tableau Prep steps can be categorized into three items: inputs, transformations, and outputs. During the first two, the input and transformation steps, we'll always have the ability to change any field name as desired.
Getting ready
To follow along with this recipe, download the Sample Files 3.1 folder from this book's GitHub repository.
How to do it…
Open up Tableau Prep Builder and connect to the December 2016 Sales.xlsx file:
- Drag the Sales_Data sheet onto the flow canvas:
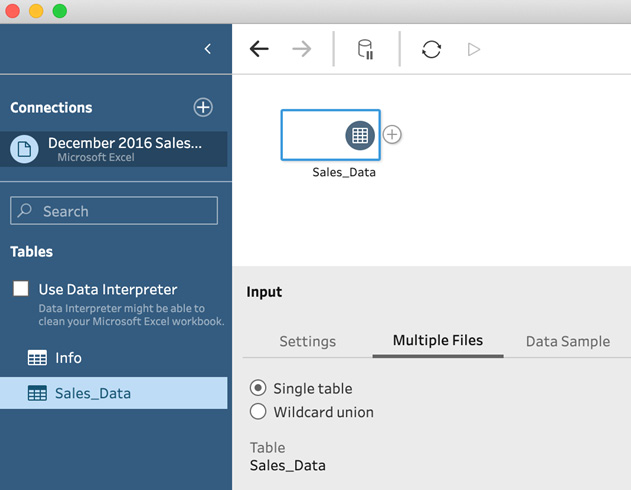
Figure 3.1 – Connecting to Sales_Data
When you select the Sales_Data input step, the bottom pane will show a preview of all the fields in the source data, along with their data type and some sample values:
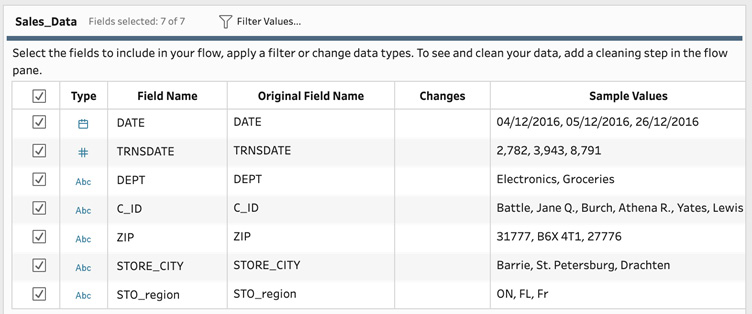
Figure 3.2 – These field names are not user-friendly
- In order to change any of the field names, we can simply double-click the current name, in the Field Name column, and edit it to our desired name. We'll always be able to see what the original field name was in our data source in the Original Field Name column. Go ahead and update the field names to match the following screenshot:
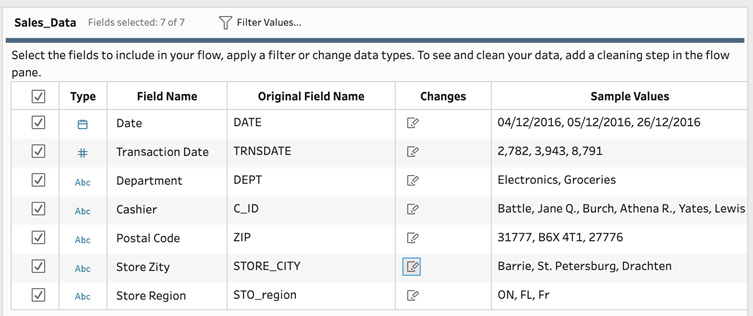
Figure 3.3 – Revised field names
It's easy to remember the changes we've made just now, but as your flow grows in complexity, it can become challenging to recall all the changes we've made. Tableau Prep supports us here by showing an edit icon next to the step in the flow that we've altered. In this case, this is the input Sales_Data step. We can hover our mouse over the edit icon to see a summary of the edits we made:
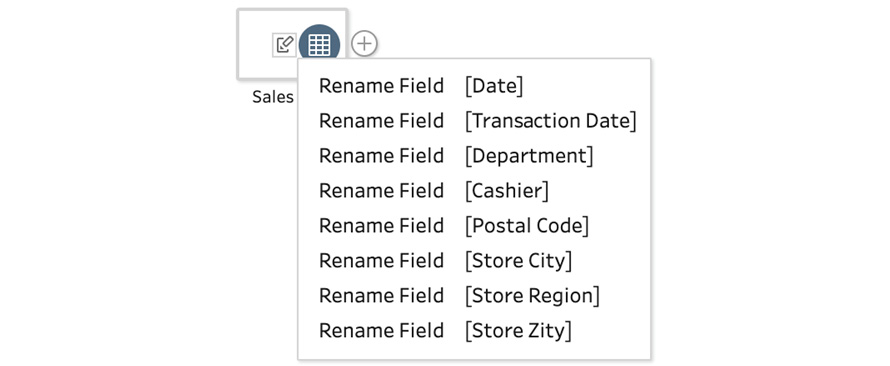
Figure 3.4 – Hover over any edit icon to see a summary of the changes made
Of course, you may wish to get more detailed insights into the exact change. There's a great overview of that as well! We can click the step with the changes and, from the bottom pane, select the Changes tab. This tab provides detailed insight into the changes made, and we can edit or remove any of the changes as needed from here:

Figure 3.5 – Detailed edit history is available from the Changes tab
- You may have noticed a typo in Figure 3.4. We renamed the STORE_CITY field to Store Zity. We'll rename this to the right name using a slightly different way to the previous method, using a clean step. To add a clean step, select the + icon on the input tool and select Clean Step:

Figure 3.6 – Adding a step to your flow
- With Clean Step selected, locate the Store Zity field from the bottom pane, open the menu by clicking the three dots next to the name, and select Rename Field. Rename the field to Store City and press Enter.
You've now successfully prepared this dataset for use by providing user-friendly, descriptive names to all fields.
How it works…
As we've seen in the steps in the How to do it… section, changing a field name in Tableau Prep is very easy. However, I recommend you take caution when renaming fields in your workflow at random steps. Doing so makes it more difficult for someone else to quickly understand your flow.
To avoid this confusion as best as possible, always rename fields as far upstream as possible, preferably in the input step itself. That way, your flow will stay organized and is easier to understand for others.
Filtering your dataset
When preparing your data for analysis, it's good practice to provide the least amount of data required to perform that analysis. Our data inputs frequently contain data that is not required and that you may want to remove immediately during an input step.
Alternatively, you may transform your data in a Tableau Prep flow, and as a result, a field may become redundant at some point after the input step itself.
In Tableau Prep, there are three methods you can use to filter your data. In this recipe, we'll perform filter actions using all three methods: calculation filters, selected values filters, and regular filters.
Getting ready
To follow along with this recipe, download the Sample Files 3.2 folder from this book's GitHub repository.
How to do it…
Open up Tableau Prep Builder and connect to the Superstore Sales.hyper extract file, then follow the steps:
- With an input step, the only method to filter our data is by using a calculation filter. To open up the calculation dialog window, click Filter Values… in the bottom pane:

Figure 3.7 – Selecting the Filter Values… button to start a calculation filter
- The sample data contains information for three segments: Consumer, Corporate, and Home Office. Suppose we want to create a filter to only include Consumer information. To do so, enter the following calculation and click Save to apply the filter:
IF [Segment] = "Consumer" THEN TRUE ELSE FALSE END
Important note
Calculations are a powerful feature in Tableau Prep. You can find more information on calculations in Chapter 7, Creating Powerful Calculations.
As seen in the following screenshot, you can type in your code entirely, or use the reference section to look up functions and use the examples to get started:
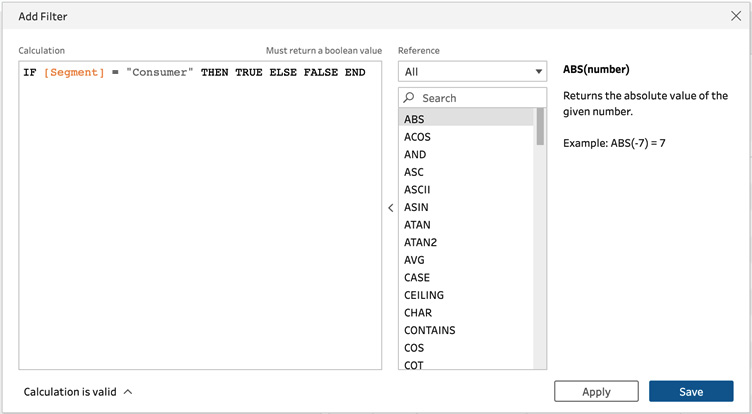
Figure 3.8 – Calculation filter definition
- Next, add a clean step to your flow by clicking the + icon on the input step and selecting Clean Step.
- With Clean Step selected, expand the bottom pane by dragging its top border up. Doing so will reveal a preview of your data. Depending on your monitor size and resolution, this pane may be visible already:

Figure 3.9 – Expanding the bottom pane on a clean step
- From the bottom pane, you can select any value in the profile pane, which will instantly update the data preview grid below it to show only rows with the selected value. Similarly, we can select multiple values by holding the Ctrl or Command key on the keyboard. Let's select Office Supplies from the Category field and Binders and Envelopes from the Sub-Category field. The data in the grid now only shows rows that have the selected values:
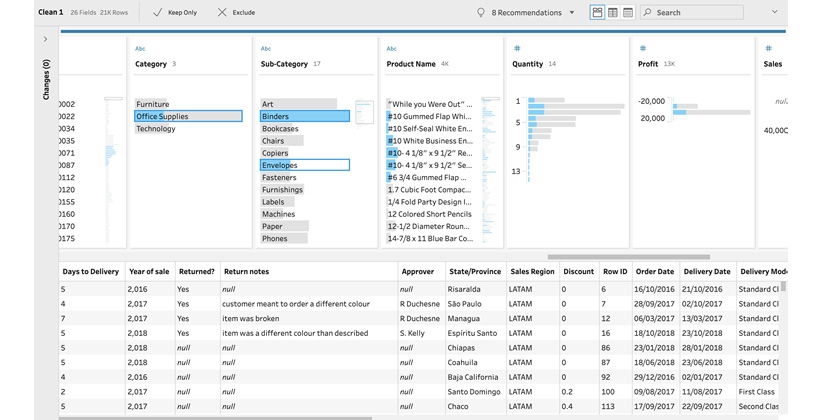
Figure 3.10 – Previewing data using profile pane filters
- We can turn this selection into a filter with a single click. At the top of the pane, you'll find that two buttons have appeared after we made our selection, Keep Only and Exclude. If we click Keep Only, Tableau Prep will create a filter to include rows with the selected values. Conversely, if we select Exclude, it will exclude those rows. Let's select Exclude to create the filter. You can see that the filter has been applied from the Changes section:
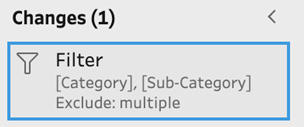
Figure 3.11 – Tableau creates a filter when selecting Keep Only or Exclude from the profile pane
- Behind the scenes, Tableau Prep has created a calculation filter for our last action. To see the filter, select Edit Filter from the Changes pane. Here, we can view or edit the calculation as needed:

Figure 3.12 – Tableau-generated calculation
- Close the Edit Filter pane and add another clean step to your flow. In this step, locate the Delivery Mode field in the profile pane and click the more options menu, followed by Filter and Selected Values:

Figure 3.13 – Adding a filter from the menu
- The Selected Values dialog will allow you to choose from a list of distinct values in the selected field, to include or exclude. Let's select First Class and Same Day to filter the data to those values only and click Done to complete the filter setup:
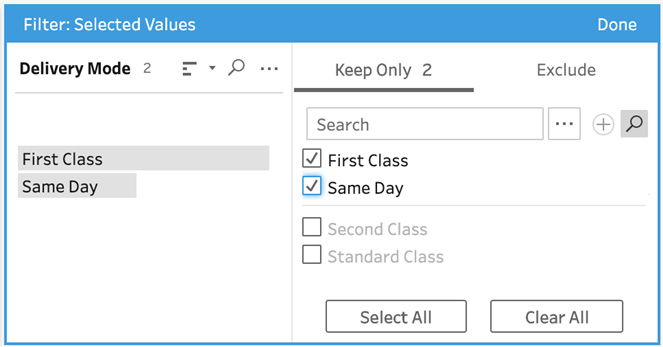
Figure 3.14 – Selected Values filter
- Next, locate the Order Date field and open up the filter menu once more. Notice how the options here are different than those we saw previously for Delivery Mode. That's because the options shown will always be relative to the data type of the field in question. In this case, Order Date is a date data type, and so we only see filter options applicable to dates:
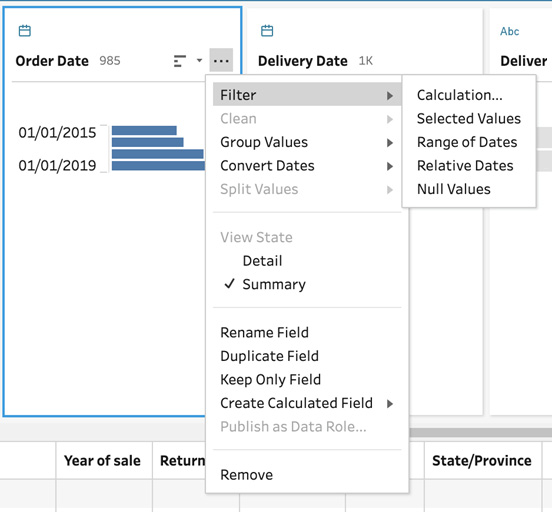
Figure 3.15 – The filter context menu depends on the data type of the field
- Select Range of Dates and set the filter to include data from January 1st, 2016 through to December 31st, 2016. Click Done to complete the filter addition.
- Next, open the filter menu for the Product ID field and select Wildcard Match. Suppose we only want to include values where the product ID starts with the characters FUR. To do this, enter FUR into the value match field and set the matching option to Starts with. This will exclude any rows that have a value in this field that does not start with FUR. Click Done to save the filter.
How it works…
In this recipe, we learned how to leverage data filters in Tableau Prep. Filters are the primary method for cleaning your dataset to remove redundant data. Besides benefiting the output for analysis purposes, a leaner dataset can also speed up the execution time of your flow. For that reason, exclude unnecessary data as early as possible in your flow.
Changing data types
With Tableau Prep's ability to connect to an incredible number of different data sources comes the challenge of data type management. Every data source technology handles data types slightly differently, or stores values differently. The wrong data type may limit the number of functions you can perform with that field. For example, you cannot aggregate a number if its data type is text, nor can you filter for a date range if the data type is not a date.
Tableau Prep does a phenomenal job of automatically detecting the appropriate data type. Tableau Prep data types are listed as follows:
- Number (decimal)
- Number (whole)
- Date & Time
- Date
- String
There are times when Tableau is unable to determine the correct data type, and times when it is unable to set it to your desired type because the values in the data are not compatible. We'll look at both cases in this recipe and how to address them.
Getting ready
To follow along with this recipe, download the Sample Files 3.3 folder from this book's GitHub repository.
How to do it…
Open up Tableau Prep and connect to the December Sales 2016.xlsx file from the Sample Files 3.3 folder and follow the steps:
- When you add an input step, Tableau Prep will show you a list of fields in the source, along with the data type it has automatically detected. The data type is indicated by an icon in the Type column. You can select any of the options here to change the data type instantly. In this particular dataset, we have two fields with a data type issue, Date and Return Date. Date has been detected as a number, whereas Return Date has been set to String. To correct this, click the icon type and set both fields to Date:
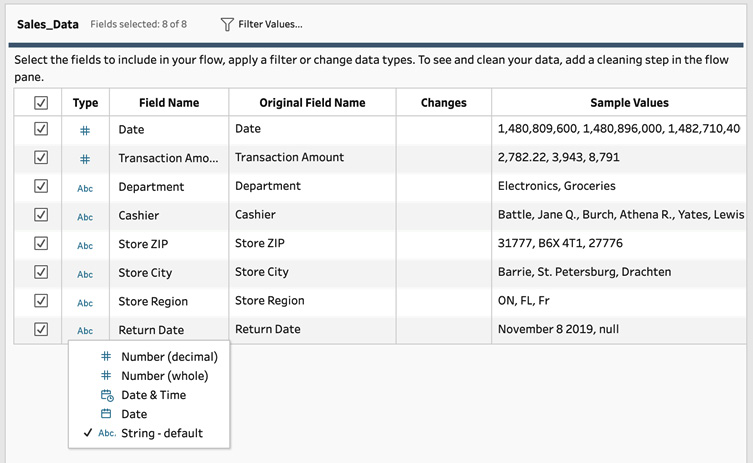
Figure 3.16 – Field list in the input step
- Once set, you should see both fields list a single sample value of null. In this case, the input tool was not able to automatically change the data type to our preference. From the Changes pane, undo the changes:
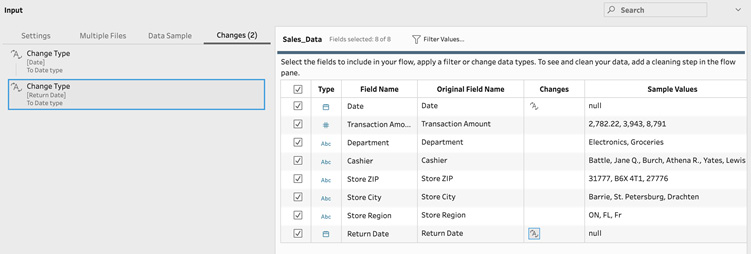
Figure 3.17 – null values appear after the data type change attempt
- Let's add a cleaning step to the flow and from the profile pane, select the Abc data type icon above the Return Date field name and set it to Date:
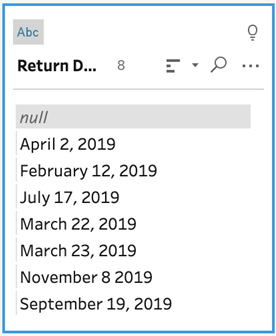
Figure 3.18 – Data types can be changed from the profile pane (Abc)
The change is successful this time and the pane shows proper date formats for the values now:
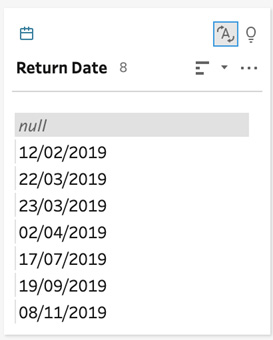
Figure 3.19 – The result of reformatting to Date
Tip
Always use the data cleaning tool to change data types. Not only does the result sometimes differ compared to using the input tool but you also have the added benefit of seeing more rows in the data grid, so you can instantly view the result of your changes.
- The Date column in our dataset is a little more problematic and cannot be solved by the cleaning tool itself. The values in this sample set are in Unix timestamp format, which Tableau Prep does not automatically recognize. We can however create a calculated field in order to return the date. To start a new calculation, click the Create Calculated Field button from the bottom pane. In the Add Field dialog, set Field Name to Date Fix and the calculation to DATE(DATEADD('second', INT(str([Date])), DATE("1970-01-01"))), and then click Save:
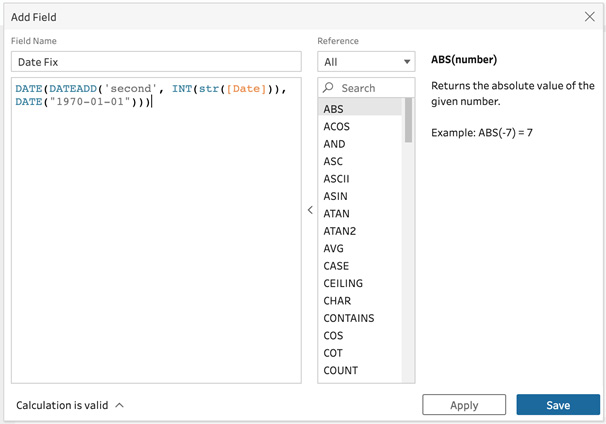
Figure 3.20 – Converting the Unix timestamp to a date
We can see that our new field, Date Fix, has been added and Tableau Prep has automatically set the data type to Date:
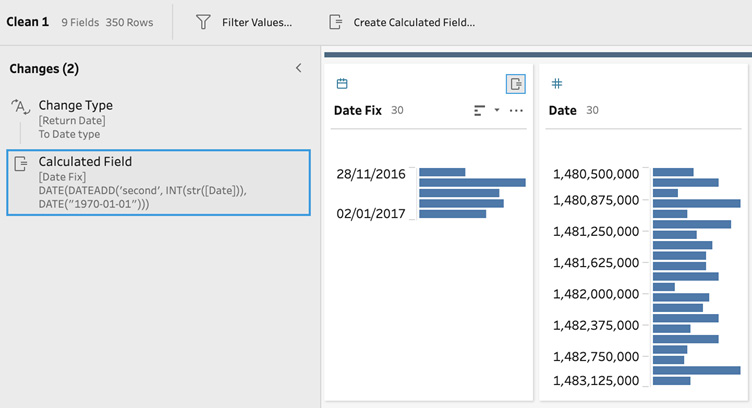
Figure 3.21 – A new calculated field has been added
Important note
Find out more about calculated fields in Chapter 7, Creating Powerful Calculations.
How it works…
In this recipe, we learned how to improve the quality of our data by correcting data types. Tableau auto-detects a variety of data types for your inputs. As we've seen in this recipe, it also auto-detects the type for newly added fields that are the result of a calculation. If you ever run into issues with the automatic detections, your first port of call is simply selecting the desired type from the data type dropdown. However, advanced calculations are always available for more complex scenarios.
Auto-validating data
Data validation can be a time-consuming task where we have to determine whether a value is accurate or not. One of the most typical data validation issues relates to misspelling and labeling the same thing differently. For example, the city of New York might be present in your data more than once, with different labels:
- New York
- NY
- NYC
- New York, NY
- New York, New York
- New York, US
- And so on…
To make the process of validating data easier, Tableau Prep uses data roles. A data role compares your data against a list of known values or specific patterns. This allows us to quickly identify problematic values in our data and take action to resolve them.
Getting ready
To follow along with this recipe, download the Sample Files 3.4 folder from this book's GitHub repository.
How to do it…
Open up Tableau Prep and connect to the User List.csv file from the Sample Files 3.4 folder and follow the steps:
- To assign a data role to any field, we must utilize a clean step. Let's click the + icon on the input step and select Clean Step.
- In the bottom pane, from the profile section, we can see that our data contains three fields: Email, Profile URL, and City. We can use Tableau Prep's built-in data roles to validate the values of these fields. To enable validation, click the data type icon on the Email field and select Email under Data Role from the menu:
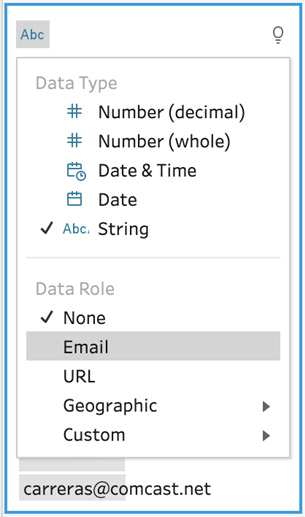
Figure 3.22 – Selecting a data role
With the role selected, Tableau Prep will validate the data in our sample file and flag any mismatch to the role with an exclamation symbol:
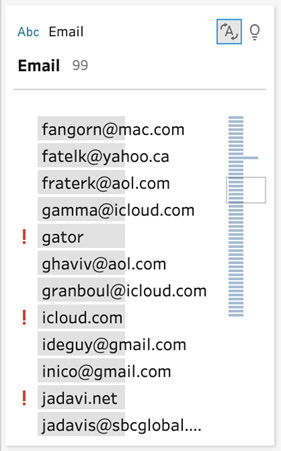
Figure 3.23 – Values flagged by a data role
We have several options to resolve these issues, which you can reveal by right-clicking an item. Let's select Replace with Null for gator:
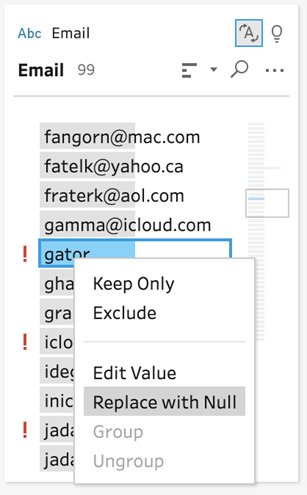
Figure 3.24 – Edit options for data validation issues
Once you edit a value, you'll notice a little paperclip icon in the list of values and a change in the Changes section listed as Group Values. This is because Tableau has created a new group with the null value and added gator as a member of that group.
- Next, select the URL data role for the Profile URL field. Then, right-click the Example value and select Exclude. Notice how the value disappears from the list and the Changes pane now lists a filter to exclude this value:

Figure 3.25 – Profile URL filter
- We can also create groups to resolve validation issues. Apply the City data role to the City field, then use the search function on the City field and search for York. This should result in two values, one of which has a leading space, resulting in a validation error:
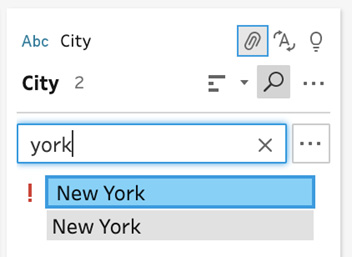
Figure 3.26 – Similar values
Important note
More details about the grouping functionality are provided in Chapter 4, Data Aggregation.
- We can safely assume that these values both mean New York. To group them together, select both (hold Ctrl or Command), right-click, and select Group:
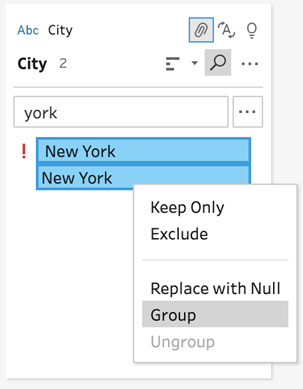
Figure 3.27 – Grouping distinct values
With the group created, we can now only see the New York value, and the warning has disappeared. Note that the Changes pane now displays another grouping action, specific to the City field:
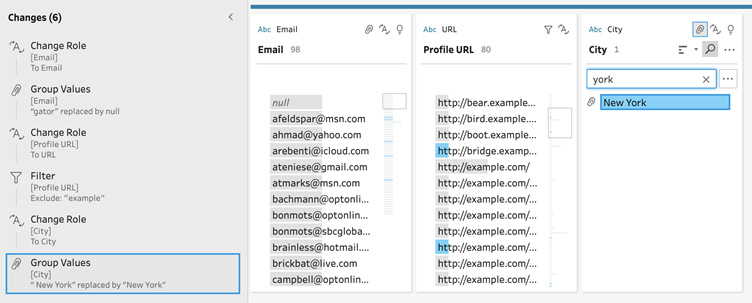
Figure 3.28 – Multiple grouping changes
You've now successfully applied auto-validation methods to your data.
How it works…
In this recipe, we learned how to apply auto-validation to ensure the right information is present in our dataset. Tableau Prep relies on data roles to validate your data. The built-in rules allow quick validation of common fields. For more powerful custom validation data roles, refer to the next recipe in this chapter.
Validating data with a custom reference list
Tableau Prep provides out-of-the-box data validation data roles for email addresses, URLs, and a variety of geographic fields. However, the real power of data roles comes from creating custom data roles specific to your environment and data. In this recipe, we'll create a custom data role and publish it to Tableau Server or Tableau Online. By leveraging your server, the custom data role can be made available to your colleagues, ensuring everyone is using a single reference list.
Getting ready
To follow along with this recipe, download the Sample Files 3.5 folder from this book's GitHub repository. In this recipe, we'll create a custom data role, for which you will need to be signed in to your instance of Tableau Server or Tableau Online.
How to do it…
Open up Tableau Prep and connect to the User List.csv file from the Sample Files 3.5 folder and follow the steps:
- To assign a data role to any field, we must utilize a clean step. Let's click the + icon on the input step and select Clean Step.
In the bottom pane, from the profile section, we can see that our data contains four fields: Email, Profile URL, City, and Type. We can use Tableau Prep's built-in data roles to validate values in the first three fields, as seen in the previous recipe, Auto-validating data. However, the Type field requires a custom role for validation purposes.
- Let's focus our attention on the Type field. Let's assume we expect two distinct values in this field, Consumer and Business. However, data entry mistakes have resulted in other values being included. In order to validate this field, we need to create a custom data role first. To do this, open a new Tableau Prep window and connect to the User Types.xlsx file supplied in the sample data folder. This file contains the correct values for our Type column, against which we'll want to validate later. Add a cleaning step, then from the profile pane, open the options menu on the Type field and select Publish as Data Role:
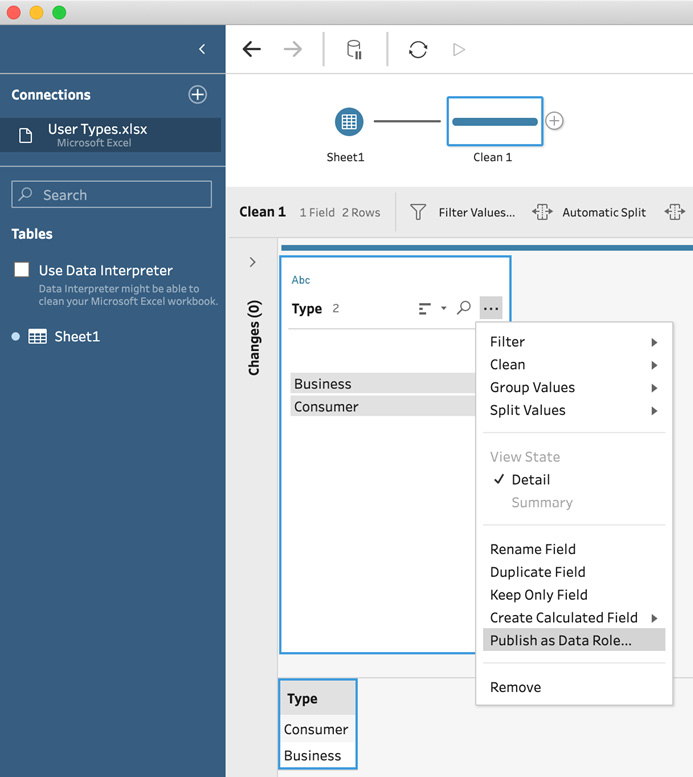
Figure 3.29 – Creating a new data role
- Tableau Prep will automatically create an output, which can publish this data role to your instance of Tableau Online or Tableau Server. It'll show a configuration error at first, which we can resolve by simply selecting the appropriate project to publish to. Select default as the project:

Figure 3.30 – Selecting the right Tableau Server/Online project
- Run your flow in order to publish the role. When done, go to Tableau Server and confirm that your role has indeed been created:
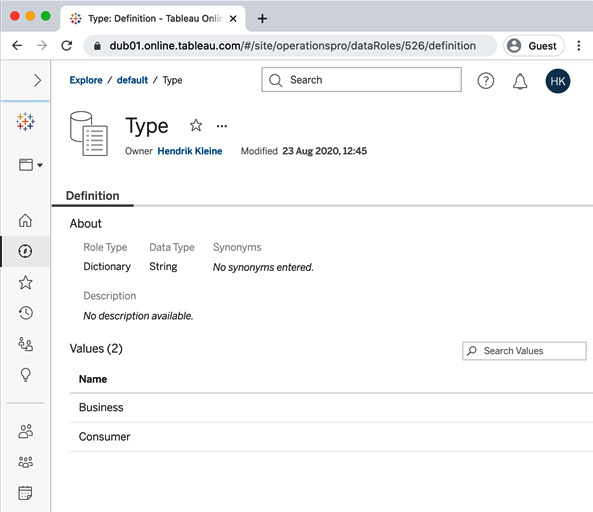
Figure 3.31 – A data role published to Tableau Online
- Close this Tableau flow without saving and head back to our original flow. We'll need to reload it in order to get the latest data roles from the server. Save and close your flow, then open it back up and select the cleaning step. Now, select Type from the custom data roles section in the Data Type menu for the fourth column, Type:
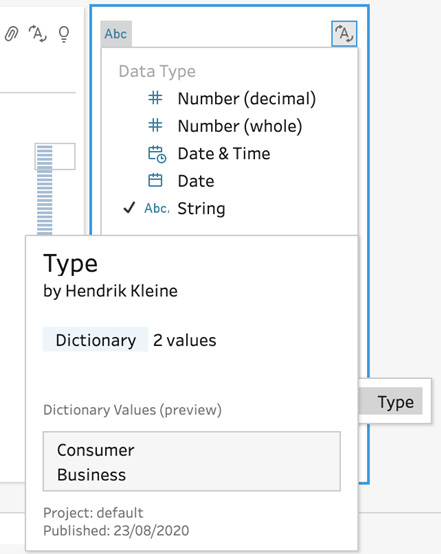
Figure 3.32 – Applying a custom data role published to your server
- Notice how Tableau Prep is now able to validate our data against the custom Type list from our server. We can quickly spot the mistakes and resolve them by using grouping to group the misspellings and to combine corporate with business:

Figure 3.33 – Applying a custom data role published to your server
When done, your output should look as in the following screenshot:
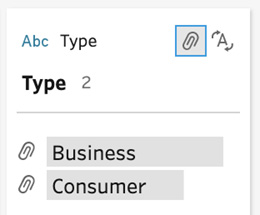
Figure 3.34 – Result of grouping
You've now completed the steps required to apply a custom data role using Tableau Server.
How it works…
In this recipe, we learned how to combine the power of Tableau Server with Tableau Prep and create a reusable, custom data role. While built-in rules allow quick validation on common fields, the ability to create roles brings the power of reusable custom roles to your organization. You can create any number of custom roles and share access through Tableau Server so that you and your team can all leverage the same data roles.
Splitting fields with multiple values
It's not uncommon for a single field to contain multiple values. For example, a name field may contain both a user's first and last name. Separating these can be done with Tableau Prep's Split Values function. Split Values facilitates the automatic creation of calculated fields with the necessary logic to split up a field based on your requirements.
Getting ready
To follow along with this recipe, download the Sample Files 3.6 folder from this book's GitHub repository.
How to do it…
Open up Tableau Prep and connect to the December 2016 Sales.xlsx file from the Sample Files 3.6 folder and follow the steps:
- Click the + icon on the input step and select Clean Step to add a cleaning step to your flow.
In the profile pane, we can see that the field named Cashier contains an employee's name. We want to split that value into two separate fields, first name and last name:
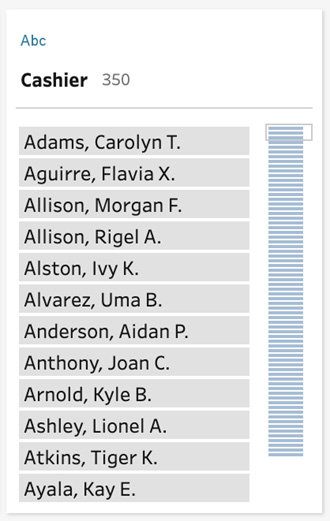
Figure 3.35 – The Cashier field contains first and last names
- Expand the more options menu on the Cashier field, and from the Split Values section, select Automatic Split:
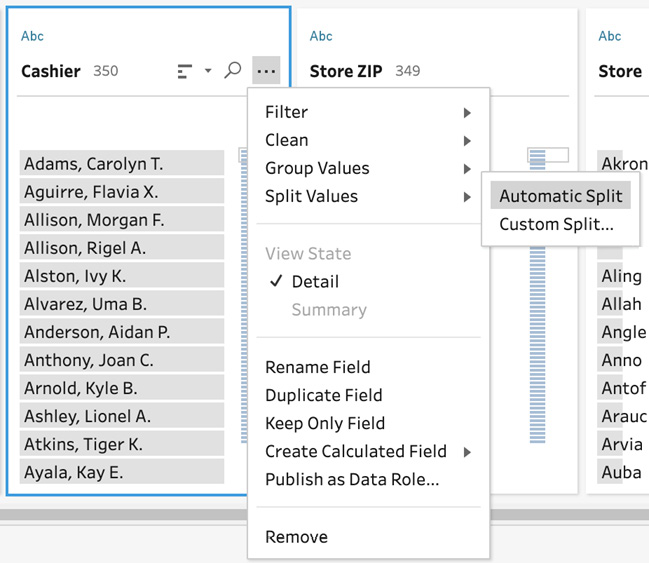
Figure 3.36 – Automatic Split
When selecting Automatic Split, Tableau Prep will attempt to identify the delimiter in the field automatically and subsequently create new fields as a result. If Tableau is unable to determine the delimiter, Automatic Split will display the Custom Split dialog instead.
The result of the action we just took can be seen in the Changes pane, where we can see that two new calculated fields have been created. We can also see two new fields in the profile pane: Cashier – Split 1 and Cashier – Split 2.
Note that the splitting of a field does not amend or remove the original field. In this instance, we still have the original Cashier field present in our data:
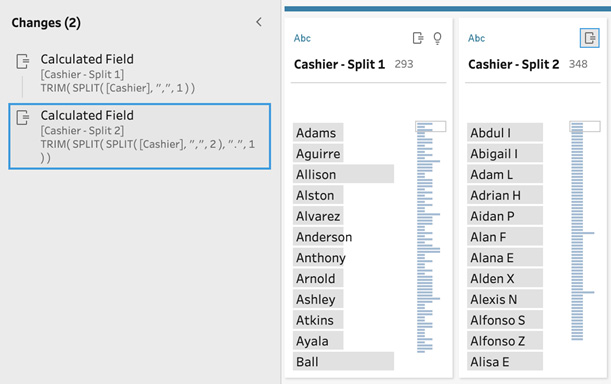
Figure 3.37 – A split action always results in calculated fields
- Change the field names of Cashier – Split 1 to Cashier First Name and Cashier – Split 2 to Cashier Last Name, then remove the original Cashier field:
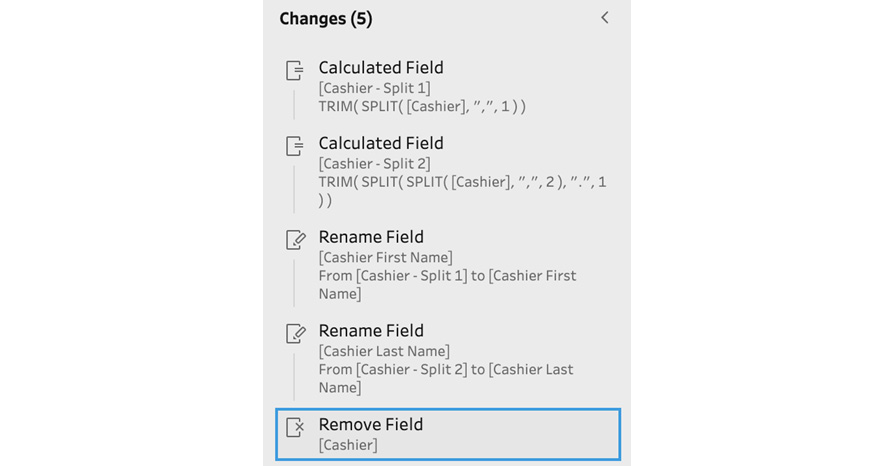
Figure 3.38 – Your Changes panes should look like this now
- We have another field in our dataset labeled Store. This field contains the store's city and region information split by a pipe, |, symbol. Let's split this field using the Custom Split functionality. Similar to Step 2, expand the options menu on the Store field, and from the Split Values section, select Custom Split. This will present the Custom Split dialog box, where we can specify the delimiter symbol and the number of fields we want to extract. Enter the pipe, |, symbol as the delimiter and split off the first two fields, one for City and one for Region. Then, click Split:
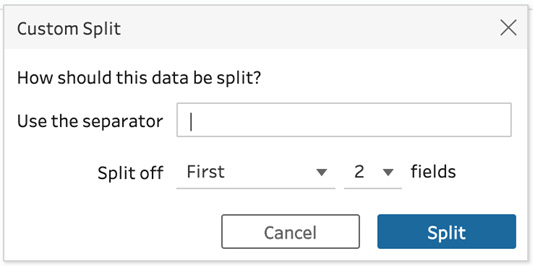
Figure 3.39 – Custom split
- Rename the fields from Store – Split 1 to City and Store – Split 2 to Region. Then, remove the Store field.
You've now successfully cleaned up this dataset and your Changes pane should look like the following:
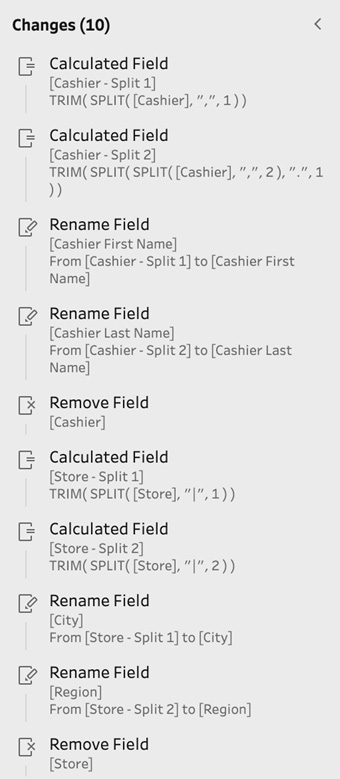
Figure 3.40 – A summary of all your changes
How it works…
In this recipe, we learned how to split values contained in a single field into multiple fields. Whenever you create a split in Tableau Prep, whether you are using the Automatic Split or Custom Split option, Tableau Prep will create a calculated field to determine the values in the new field. You can always edit these calculations just like any other calculated field by selecting the Edit icon in the Changes pane.
The following screenshot shows the split function in the calculated fields dialog:
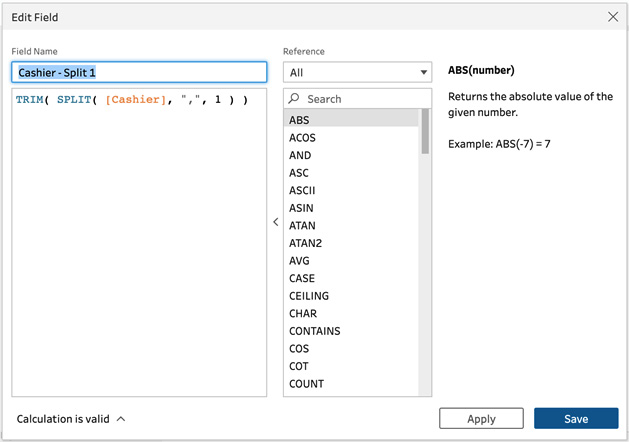
Figure 3.41 – Editing a split field calculation
With this knowledge, you can now manage complex datasets that store multiple values in a single field and transform them into an organized, easy-to-understand dataset.