
Chapter 5: Combining Data
Besides cleaning up your data inputs, Tableau Prep can be used to increase the value of your new dataset by augmenting it with complementary data. This can be done by extending the dataset vertically, adding more rows, or horizontally, by adding new data columns. Performing such data preparation tasks within Tableau Prep allows you to create a dataset that includes key data from multiple inputs, making the end result a comprehensive dataset for analysis.
In this chapter, you will learn how to combine different datasets by using a variety of different methods. Combining data is one of the most common actions in data preparation. Most organizations source data from multiple systems and combining that data into a holistic dataset allows more insightful analysis than looking at each dataset in isolation.
In this chapter, you'll find the following recipes to help you combine your data for analytics:
- Combining data with Union
- Combining data ingest and Union actions
- Combining datasets using an inner join
- Combining datasets using a left or right join
- Expanding datasets using a full outer join
- Expanding datasets using a not inner join
Technical requirements
To follow along with the recipes in this chapter, you will require Tableau Prep Builder. The recipes in this chapter use sample data files that you can download from the book's GitHub repository at https://github.com/PacktPublishing/Tableau-Prep-Cookbook.
Combining data with Union
Data is typically produced by multiple systems and certain systems may produce similar data that needs to be combined vertically. That is, the rows need to be stacked on top of one another. A use case we'll use in this recipe is combining sales data from two different sales systems, in order to get the total sales dataset prepared. This is a typical scenario you may encounter when your organization is operating multiple systems, is migrating from one system to another, is maintaining legacy systems, or is integrating systems from a partner or acquired company. In this recipe, we'll combine multiple datasets using Union.
Getting ready
To follow along with this recipe, download the Sample Files 5.1 folder from this book's GitHub repository.
How to do it…
Start by opening Tableau Prep and perform the following steps:
- Connect to the DataExport_NOV_Sales.csv text file in order to create a brand-new flow with a data connection. Let's assume that this is data from a legacy sale system, where each row represents a sale made.
- Create a second data connection to the DataExport_NOV_SalesData.csv text file. This data is from the same legacy system, but it may reside on a separate server, resulting in the need for a separate connection here:
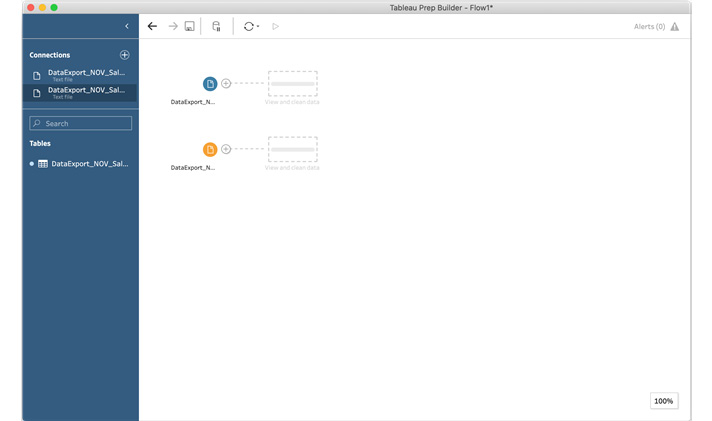
Figure 5.1 – Two connections to legacy system data
- We'll now need to combine data from both connections in order to get a complete picture of all sales made. To do so, we're going to union these two data inputs. To do so, click and hold the second data input and then drag it on top of the first data input. When you do so, you will see two options appear, Union and Join:

Figure 5.2 – Dragging one data connection on top of another for Union and Join options
Drag the connection so that Union is highlighted, and then release. Tableau Prep will instantly add a step named Union 1:
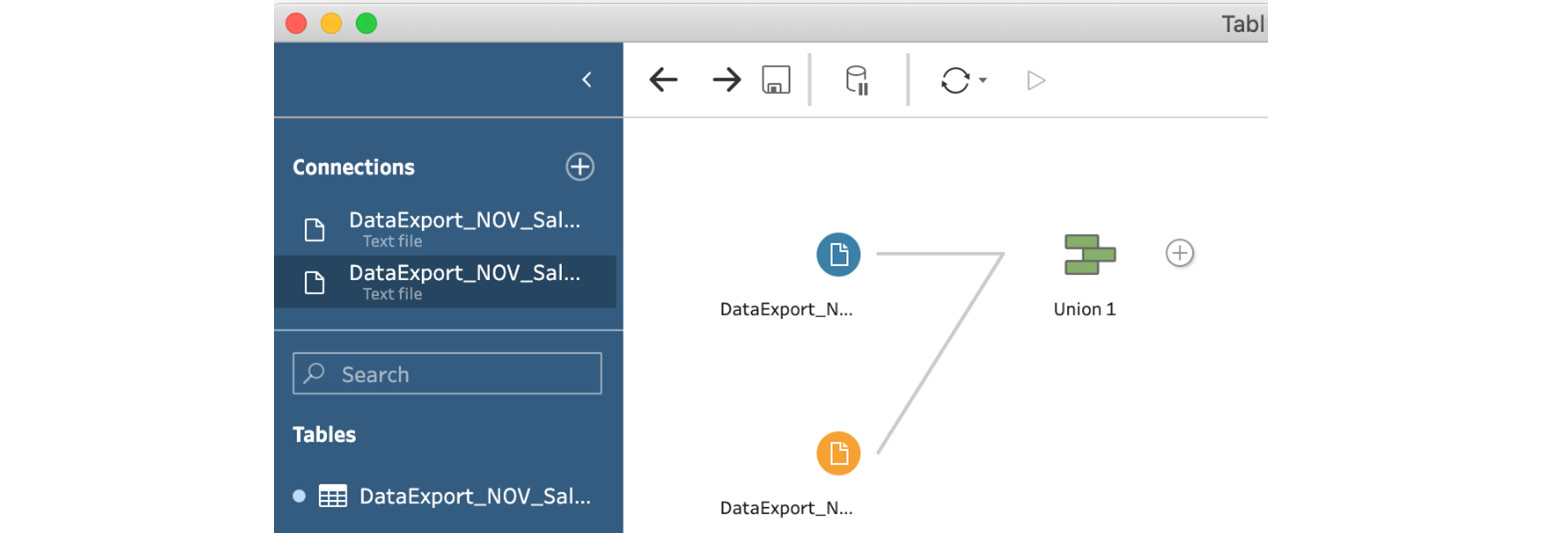
Figure 5.3 – A Union step is added by Tableau Prep when releasing the mouse
- Select the Union 1 step to view the data pane at the bottom of the screen. Expand the bottom pane so that the data preview becomes visible. Notice how a new field has been added automatically, named Table Names. This field indicates the original source of each row in the combined dataset. You can scroll through the preview to see both values, DataExport_NOV_Sales.csv and DataExport_NOV_SalesData.csv:
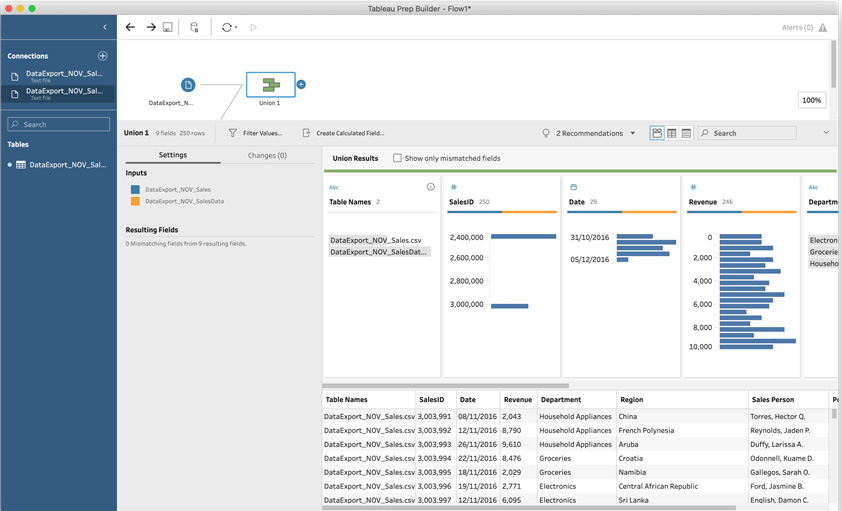
Figure 5.4 – A Union step automatically adds a Table Names field
Important note
In the bottom pane, take note of the two colors Tableau Prep has assigned to each data connection; blue for DataExport_NOV_Sales.csv and amber for DataExport_NOV_SalesData.csv. Observe the column headers and notice the multi-colored bar beneath all the field names, with the exception of the Table Names field. This multi-colored bar indicates from which data connection the field was sourced. In our case, all bars are a combination of blue and amber, meaning data was sourced from both data connections.
- Now let's add a third data connection to your flow. This time, connect to the POS_Sales_Data_November_2016.xlsx file, specifically, the Sales_Data sheet. This data is from a completely different sales system. As a result, the data in the file is organized differently from the two connections we've used so far. Observe the input field names by selecting the input step:
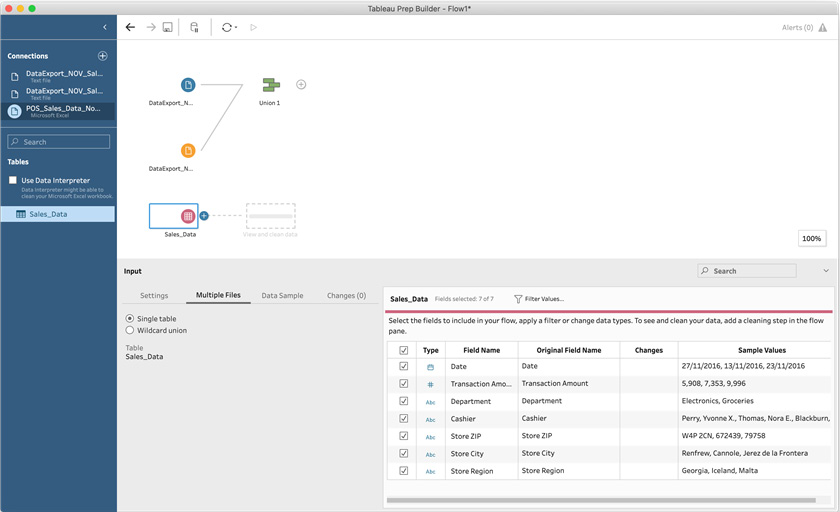
Figure 5.5 – Reviewing the input field name differences
- Even though we've observed different field names, we can still stack this data with the existing connections, using Union. Go ahead and drag and drop the POS_Sales_Data_November_2016.xlsx input on top of the Union 1 step. Notice how this time, three options appear when hovering, instead of the two options we saw in Step 3 earlier. We have Add, Union, and Join:

Figure 5.6 – Hovering over an existing union shows the Add action
Hover to the left to highlight the Add action and release the mouse button. This will add the third source to your existing union. If you have selected Union instead, a second union step would have been created, combining Union 1 with the third data connection.
- Select the Union 1 step to view the bottom pane. Notice how you can use the color coding to quickly find potential issues with the union. The Inputs section now defines three colors; blue for DataExport_NOV_Sales.csv, amber for DataExport_NOV_SalesData.csv, and red for our newly added POS_Sales_Data_November_2016.xlsx connection:
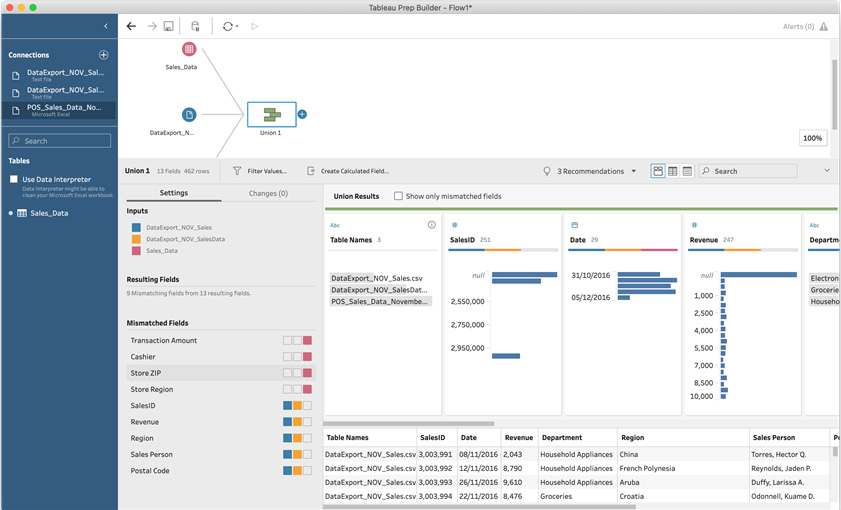
Figure 5.7 – Using color coding to quickly spot potential union issues
Using the same color bars we described in Step 4, you can quickly see the origins of each field. For example, SalesID is blue and amber, meaning it contains data from those two data connections. That is, the SalesID field does not exist in the POS_Sales_Data_November_2016.xlsx data connection. Similarly, the Date field has three colors – blue, amber, and red – indicating the field is present in all three inputs.
- The Mismatched Fields section uses color coding to inform us of the field origins, similar to the multi-colored bar under each field name. There are some fields that contain similar data, such as Store Region and Region. However, because the field names in the data connections are different, Tableau Prep was unable to align them in a single field. To solve this issue, we can simply rename the fields:
Rename Transaction Amount to Revenue.
Rename Cashier to Sales Person.
Rename Store ZIP to Postal Code.
Rename Store Region to Region.
The following screenshot illustrates the end result, where fields have automatically been merged as a result of renaming field names:
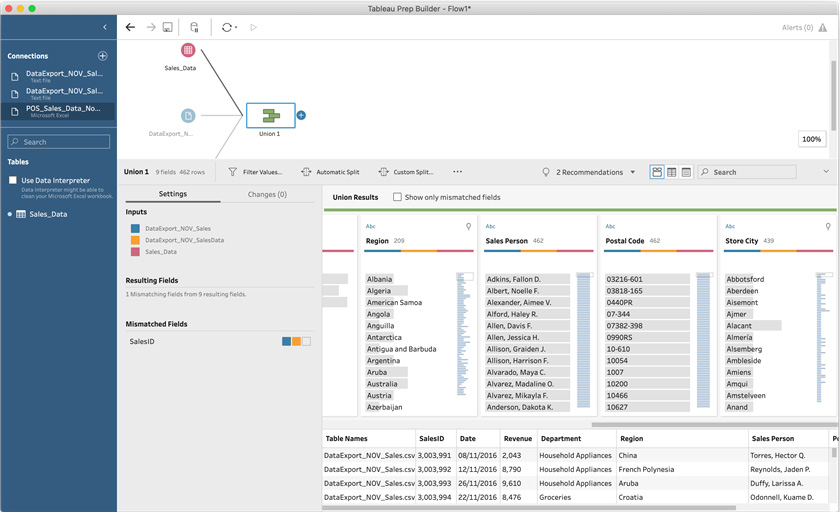
Figure 5.8 – Aligning fields by renaming them to a common name
As you can see, Tableau Prep automatically and instantly re-aligns the fields once they have identical names. In our case, we have one field remaining that is not present in the POS_Sales_Data_November_2016.xlsx data connection – SalesID. This is not an issue for the union step. The field will be retained, and any rows originating from the POS_Sales_Data_November_2016.xlsx data connection will have a null value for that field.
How it works…
Tableau Prep stacks rows from any input to a union on top of each other and aligns the data by field names at the same time. In our recipe, we've resolved two scenarios. First, we combined data from two similar, but separate, data connections. In this case, Tableau Prep combined the data without any issues. Then we combined data that was significantly different, that is, data with a different number of fields, and different field names. Tableau resolves this by setting the value to null for fields that are not present in a certain input, and we can manually rename fields in order to trigger Tableau to align them.
Combining data ingest and Union actions
When you have multiple data sources that need to be vertically stacked using a union, you may opt to perform that action during ingestion. This avoids you having to create a separate Union step in Tableau Prep. Furthermore, you can use wildcards in your input, such that the input becomes dynamic, and new data files can be ingested as they are added. A typical scenario for this would be an automated process that exports data on a recurring schedule, which you then need to union with prior data exports.
In this recipe, we'll use a special type of union that is part of the input step, rather than a step by itself. Using the Union functionality during input allows you to ingest and union multiple input files simultaneously.
Getting ready
To follow along with this recipe, download the Sample Files 5.2 folder from this book's GitHub repository. This folder contains sales data that has been exported every month, and so we have one file for every month of the year 2016, 12 files in total, to be combined using a union.
How to do it…
Start by opening Tableau Prep and perform the following steps to create a dynamic input and union step:
- Connect to the January 2016 Sales.xlsx Excel file in order to create a brand-new flow with a data connection.
- From the available tables, drag the Sales_Data table onto the flow canvas. Then, select the input step in order to display the bottom pane. From the pane, select Multiple Files, followed by Wildcard union:
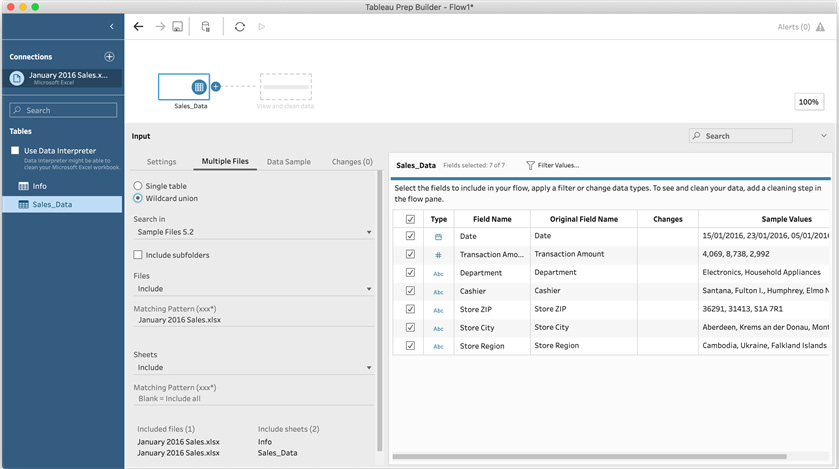
Figure 5.9 – Selecting Wildcard union from the Input options in the bottom pane
Wildcard union allows you to perform a union within the input data connection. That is, you can union multiple files at the same time. Wildcards, represented by the asterisk, *, symbol, are utilized to refer to any number of files in a given directory that match a certain naming pattern.
In this recipe, we will perform a union to combine all 12 Excel files in the sample folder.
- By default, Matching Pattern is identical to the filename of the current connection, in this case, January 2016 Sales.xlsx. To capture all files in the directory, we can replace any number of characters using a wildcard. Set Matching Pattern to *2016 Sales.xlsx. This will instruct Tableau Prep to include every file ending in 2016 Sales.xlsx. In this example, we've replaced the month with a wildcard, and hence all 12 files are now in scope.
- Once you've set the Matching Pattern field, Tableau Prep will immediately scan the files in scope, and identify the sheet names per file. You will be presented with a full list of file and sheet names under Sheets. Notice how each file from our sample data contains two sheets, Sales_Data and Info:
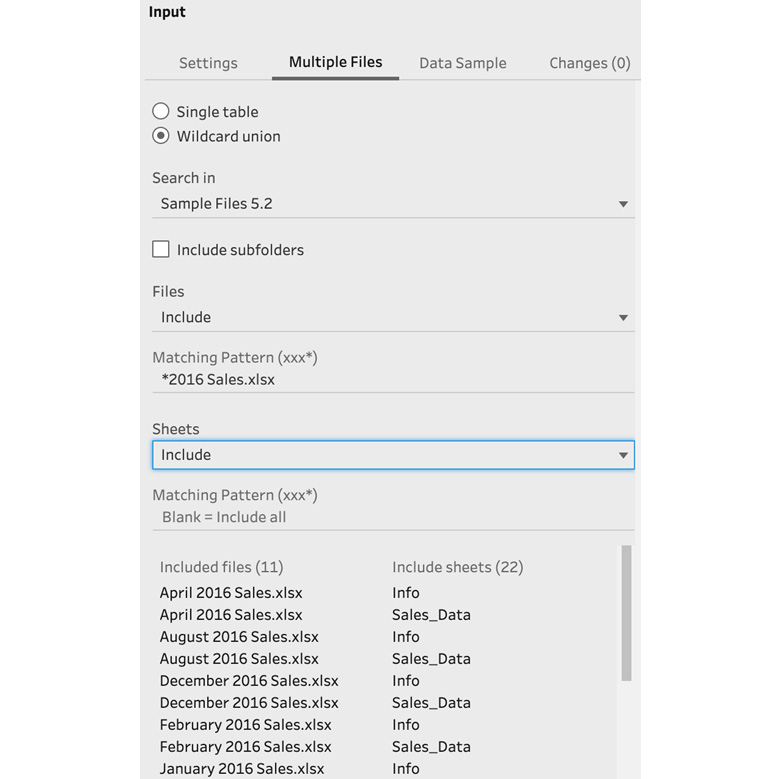
Figure 5.10 – Reviewing the available sheets
The data we want to capture resides in the Sales_Data sheet. As such, we need to provide a matching pattern for sheets, so that only the sheet carrying that name will be included. Since the sheet names are identical, we can achieve this without a wildcard.
Note that we can set our Matching Pattern behavior to Include or Exclude. Using the dropdown highlighted in Figure 5.10, by setting this option to Exclude, you can specify the Matching Pattern value as Info. In doing so, you're instructing Tableau Prep to exclude all sheets named Info.
- To confirm the settings, make sure to click the Apply button at the bottom of the pane. Depending on your screen size, this button may not be visible initially. Scroll down to the bottom to reveal the Apply button and click it.
- After applying your changes, Tableau Prep will provide a list of field names found across all the files in scope. Furthermore, it will provide us with a preview of values per field in the bottom pane:

Figure 5.11 – Sales_Data preview after input union
Notice that there is a field named Revenue with null values. Throughout this book, we've used these sample files multiple times and the Revenue field name is unexpected, as is the null value. To investigate this further, add a clean step to your flow.
- With Clean 1 selected, scroll through the field list, to the Revenue field. The data profile shows a large number of null values, confirming our suspicion that there's something not right here. Select the null value in the profile chart. Doing so will highlight the origins of the null value in the File Paths field, which has automatically been added by Tableau Prep, as a result of the union. Here, we can clearly see that null values are present in all files, except the November 2016 Sales.xlsx file:

Figure 5.12 – Investigating the Revenue null origins with a data profile
- The only other numeric field in the dataset is Transaction Amount, so it is worth investigating that field as well. When you scroll over to the Transaction Amount field, you'll once again see a significant number of null values. Repeat the process from the previous step, select the null value, and then observe the origins in the File Paths field.
This time, you can see that the origin is the opposite. All null values originate from the November 2016 Sales.xlsx file. And so we have determined that Transaction Amount and Revenue are likely to represent the same data, but the field labels have changed in the November file.
- To resolve the problem we have identified, we need to merge the Transaction Amount and Revenue fields into a single field. To do so, select the Transaction Amount field, press the Ctrl key, and then select the Revenue field as well. With both fields selected, open the options menu on either field and then select Merge:
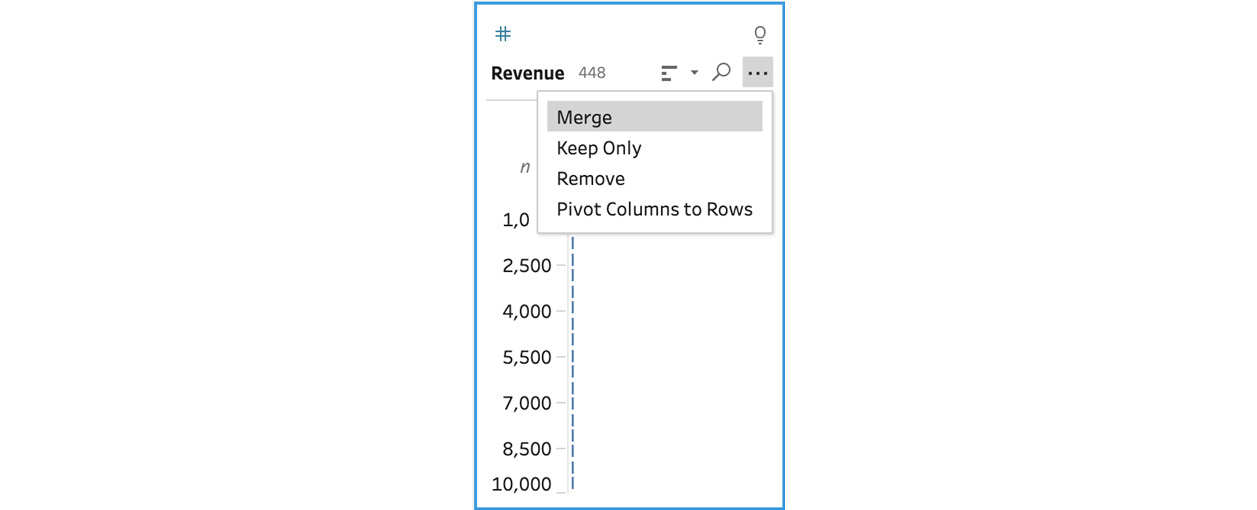
Figure 5.13 – The Merge option will appear when multiple fields are selected
Tableau Prep will instantly merge the fields and assign it the name of the field first selected. An icon above that field will indicate the merge action. Hovering over the icon provides details on the fields that were merged:
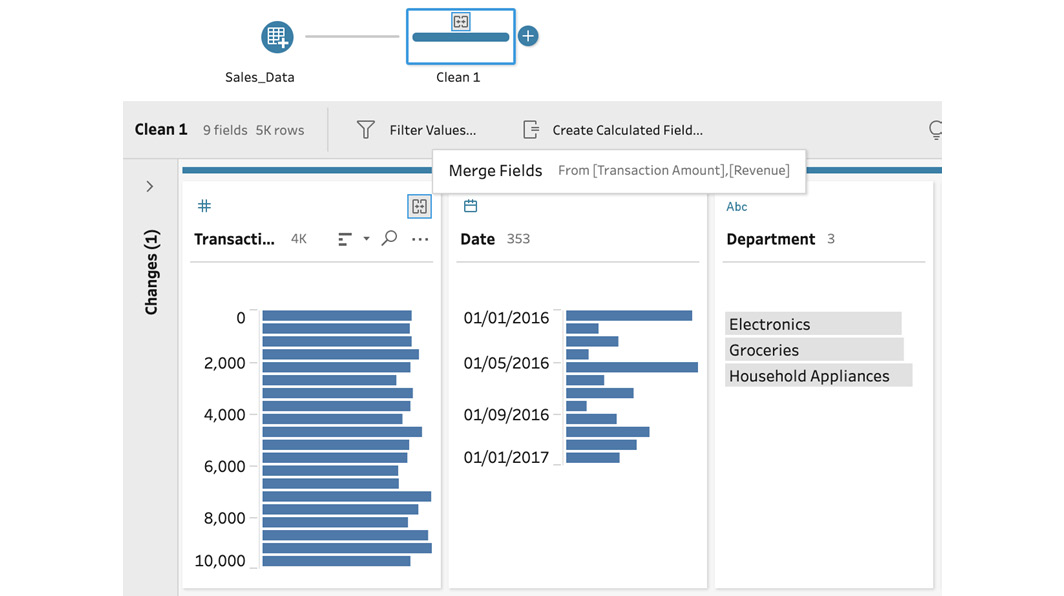
Figure 5.14 – Hovering over the merge icon to see the fields included in the merge
With these steps completed, you have successfully performed a union during the input step.
How it works…
Tableau Prep stacks rows from data files in scope, as defined by matching patterns during its data ingestion. It does so by opening up multiple files in the background and stacking them without any significant controls in place. That is, completely different data sources can be combined in this union, leading to undesirable outcomes. We've seen a brief example of this in this recipe, where only a single field mismatch justified an investigation.
However, if you are confident that the data format is consistent, as is often the case with automated processes, for example, the input wildcard union option is a great way to ingest files dynamically. For example, a folder that is updated every day with a new file carrying the current date can be included by Tableau Prep thanks to the input wildcard union support.
In this recipe, we've created a union as part of the input step, leveraged a filename and sheet matching pattern, toggled the matching style from include to exclude, and investigated a discrepancy as a result of a union of files with a different structure. As a result, we've learned how to ingest multiple files and perform a Union action using a single input step.
Combining datasets using an inner join
We often store in multiple different places for a variety of reasons, including different systems, storage optimization and efficiency, security, costs, and so forth. When analyzing data, however, we often want to bring data from many different areas together to create a richer dataset for analysis. Doing so may result in a better understanding of the data and provide valuable business insights. We can use the Join functionality to combine data horizontally, that is, widen the dataset by adding fields from two or more sources together. There are a variety of different join types, as you can see by the recipes in this chapter. In this recipe, we'll look at creating an inner join.
An inner join is the end result of joining two data sources together and retaining only those rows that overlap. For example, let's assume we have order data for a B2B seller of office supplies. Their data may be segmented into a database containing order information, and another database containing customer information. The overlap between these two sources is a common identifier, such as the customer's name, or, more likely, a unique customer ID.
Getting ready
To follow along with this recipe, download the Sample Files 5.3 folder from this book's GitHub repository.
How to do it…
Start by opening Tableau Prep and perform the following steps to combine the two sample files using the Inner Join functionality:
- Connect to the Orders.csv text file in order to create a brand-new flow with a data connection. The Orders file contains order data from a B2B supplier. Each row represents a separate order. Each customer is denoted by a unique identifier in the cust_id field:

Figure 5.15 – The cust_id field is a unique identifier, essential to the join operation
- In our sample data folder, there is a separate file containing customer details, such as a customer contact name, email, and geographic information. In order to perform a comprehensive analysis on orders, for example, identifying the total sales by State or County, we need to combine these datasets. To get started, create a second connection in your flow to the Customers.csv file.
- In order to start any new join, whether that is an inner join or any other type, we need to click and drag the second data connection step over the first step. When you hover on top of the first connection step, two options will appear, Union and Join. Ensure that Join is highlighted and then release your mouse hold:
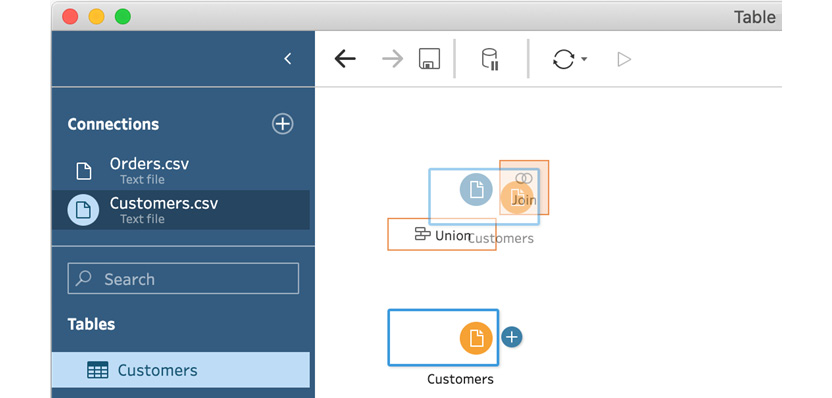
Figure 5.16 – Creating a new join by dropping an input step on top of another input step
A join will always require additional configuration before it is ready for use. Because Tableau Prep instantly evaluates the validity of your flow, creating a new join will initially result in a warning message. This is expected behavior and nothing to be concerned about:
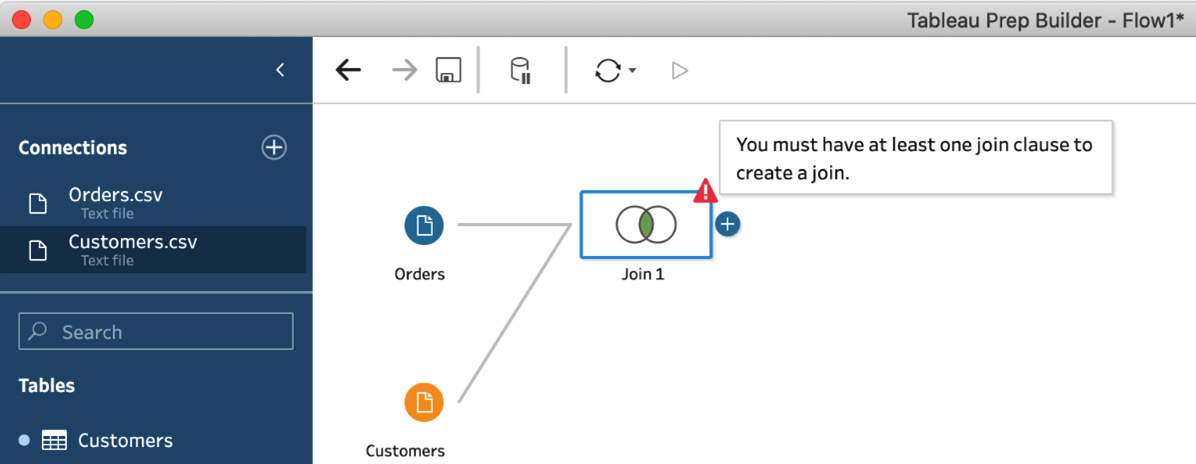
Figure 5.17 – A new join will trigger a warning message
- Next, we need to specify how these two data sources can be connected, that is, which field, or combination of fields, they have in common. We can specify this in the bottom pane, in the Applied Join Clauses section. Here, click Add to reveal two field name lists. The field name lists indicate their source data connection, Orders and Customers, just above the search bar:
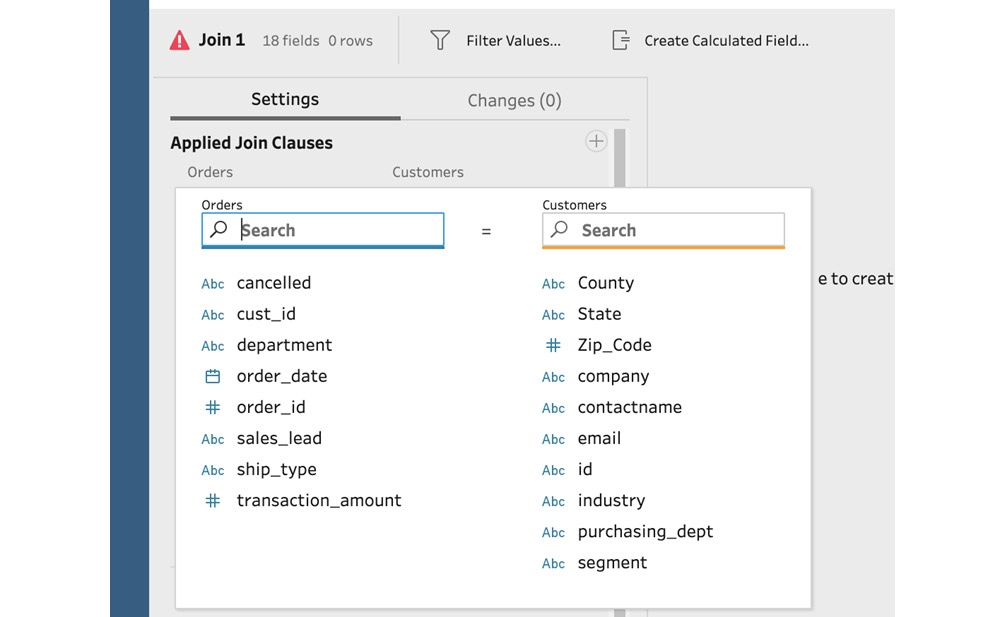
Figure 5.18 – Specifying a new join clause
These data sources are connected by customer ID. In the Orders data source, this field is denoted by cust_id. In the Customers data source, it is denoted by id. Select these two fields to create your join clause.
Once a join clause has been created, as we did in the previous step, Tableau Prep will immediately execute the join and provide detailed results in the bottom pane. There are two specific areas to pay careful attention to when creating a join, Join Type and Summary of Join Results.
Join Type allows us to set the type of join, that is, an inner, left, right, full outer, or other type of join. By default, the type is set to inner, which is the type we require in this recipe, and so we do not have to alter it. An inner join will return all data that overlaps between the two data sources; in our case, all orders that have a customer associated with them.
In the following screenshot, we can see that the overlapping section of the two circles is selected, resulting in Join Type : inner:

Figure 5.19 – The default join type is inner
Summary of Join Results provides valuable information regarding the outcome of a join operation. Specifically, it will inform us how many records are returned from each data source, after passing through the join, and how many records did not pass through because of a mismatch. In our example, a mismatch would occur if an order would not have a customer associated with it in the Customers.csv file. Our sample data has not mismatched and we're seeing a total of 15,821 rows from the Orders file passed through the join, as well as 1,467 rows from the Customers file. You can open both files in Excel to confirm that this is indeed the correct number of rows.
The following screenshot shows the join results of the steps we have just performed:
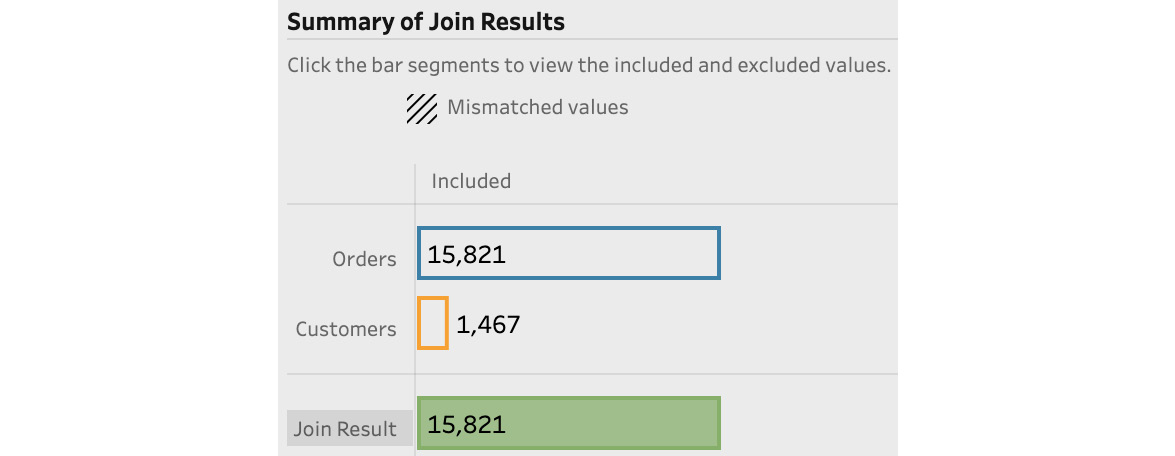
Figure 5.20 – Using Summary of Join Results to verify the join operation outcome
Let's move on to the next section!
How it works…
In this recipe, you've connected two data sources in a Tableau Prep flow. You then joined these two data sources using a common denominator, in this case, the customer ID. You've experienced how Tableau Prep immediately performs join operations without the need for you to run the entire flow. This is by design, and helps you validate your join prior to building out your flow further and possibly running into unexpected issues later on as a result of the output of the join step.
Combining datasets using a left or right join
In the Combining datasets using an inner join recipe, we combined data that was complementary and complete, orders, and associated customer information. However you may find a use case where complementary data is present for some records, and not for others. An example of this that we'll use in this recipe involves two data sources, one with sales data from a department store, and another data source with information from customers who checked out with a loyalty card. Of course, not all customers may have a loyalty card, and so we cannot expect to match every row in the data. This is where a left join comes into play.
In a left join, we pass through all the data from the first dataset, that is, the left data source, and only those records from the second, right data source that we were able to match. This means that any sales records that did not involve a loyalty card will still pass through, but the additional fields from the second source will simply be empty, or null.
Getting ready
To follow along with this recipe, download the Sample Files 5.4 folder from this book's GitHub repository.
How to do it…
Start by opening Tableau Prep and perform the following steps to enrich the sample sales data with the customer loyalty card data, if available:
- Connect to the Sales Data.xlsx Excel file in order to create a brand-new flow with a data connection. Let's assume this is sales data from a checkout system, where a customer may or may not have used a loyalty card. If the transaction involved a loyalty card, there will be a value in the Loyalty_ID field, otherwise it will be null.
- Now, bring in the customer loyalty card data by creating a second data connection, this time to the LoyaltyData.csv text file.
- Create a join by dragging the LoyaltyData data source on top of the Sales Data source, ensuring that you release when the join is highlighted:
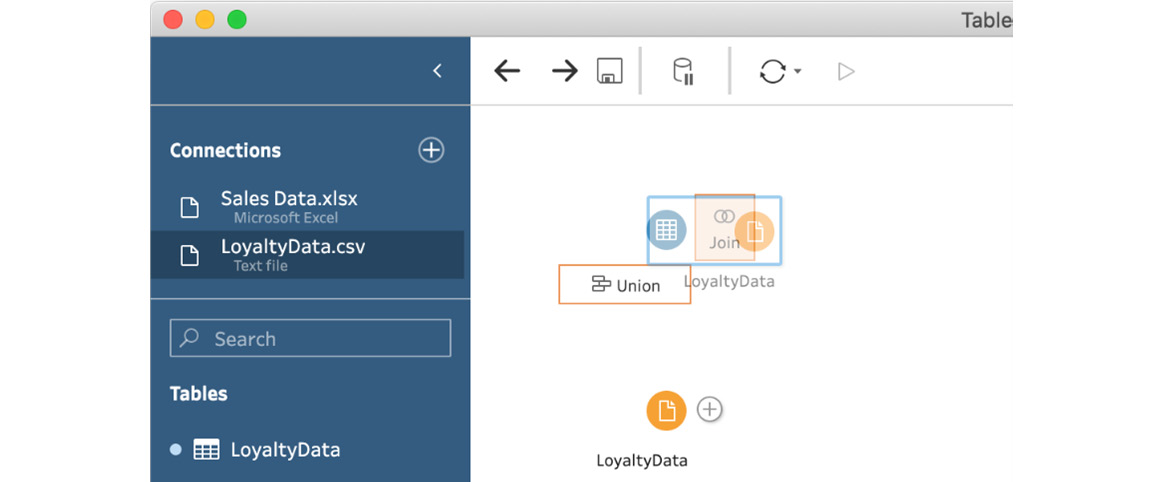
Figure 5.21 – The initial step for creating any type of join is dropping one source on top of another
- Set the join clause to use the Loyalty_ID field from the Sales Data source and the ID field from the LoyaltyData source. Once you apply the join clause, Tableau Prep will immediately perform the join operation and, after a few moments, provide you with the results, in both summary and detail, within the bottom pane:

Figure 5.22 – The result of the join operation is immediately returned by Tableau Prep
Note that Tableau Prep indicates a number of mismatched values in the Summary of Join Results section. Because the default join type is an inner join, Tableau Prep will only return rows that have a common identifier in both sources, in this case, our loyalty ID. Any other rows are excluded. The join result gives the count of rows that actually passed through the join, 216 in this case, out of a total of 826 sales transactions:
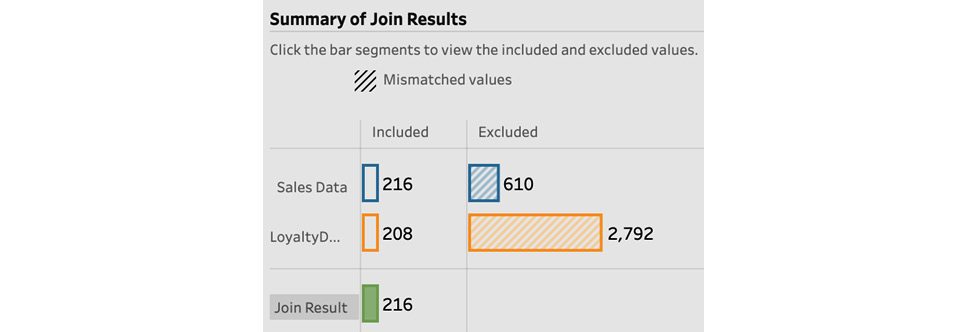
Figure 5.23 – Reviewing the result of your join in the summary section
The middle section in the join step settings shows all the IDs that could not be matched in a red font. For example, null from Sales Data could not be matched to any row in the LoyaltyData file and, as a result, is excluded from the join results. Similarly, the ID 2000 from the LoyaltyData file was not present in the sales data, and therefore is also excluded from the join results:

Figure 5.24 – You can review the excluded details by focusing on the items in red
- In our case, we want to return all our sales data rows and simply augment them with loyalty card data, if the customer used a loyalty card. Therefore, we need to change our join type to Left Join, meaning that we want to retrieve all data from the left side, Sales Data, and only those rows from the right side, LoyaltyData, when there is an overlap, based on Loyalty ID. To change the join type, select the left circle in the Join Type Venn diagram:

Figure 5.25 – Click the left circle to change the join type to a left join
Tableau Prep immediately updates the join results, and, at a glance, we can now see from the summary that all 826 Sales Data rows are being passed through:

Figure 5.26 – A left join results in no values being excluded from the left side
You may review the row-by-row results in a more organized pane by adding a clean step to your flow and selecting null from the Loyalty_ID field. This will display all rows where a transaction was made without a loyalty card, and you can see that the values for customer information are set to null as a result:
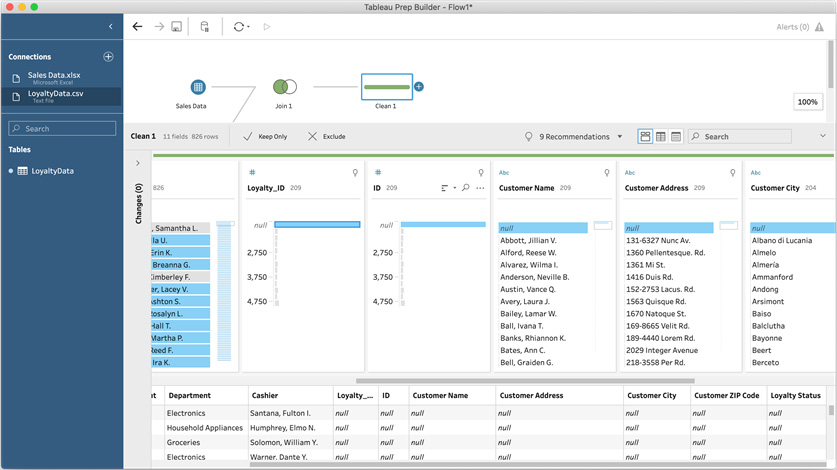
Figure 5.27 – A clean step is useful for inspecting your data quickly
With these steps completed, you've successfully utilized Tableau Prep to perform a left join.
How it works…
In this recipe, you've created a left join, which resulted in returning all rows from one data source, and only those rows from a complementary data source when there was a common identifier. A right join would have performed the exact opposite, that is, returned all rows from the second data source, and only matching rows from the first data source.
There are many use cases for a left or right join, as in many scenarios we combine data from multiple sources to a core data source, such as transactions or customers.
Expanding datasets using a full outer join
In the Combining data ingest and Union actions recipe, we created an inner join to return rows from two data sources that had a commonality. In the Combining datasets using a left or right join recipe, we created a left join to return all rows from a data source and enrich that data with information from a second source, whenever there was additional information available, without dropping any rows from the original source.
In this recipe, we'll look at a variation of the join, which is named the full outer join. In this case, we'll want to retrieve all rows from both data sources involved in the join, that is, even if there's no overlap. It's essentially doing a left and right join at the same time; you won't lose any data from either data source.
In the example that follows, we'll use a use case where a company is running several projects and each project may have a number of people assigned to it. However, some projects may not have started yet, or may have already been completed. Those inactive projects won't have people assigned to them. Similarly, people may be assigned to a project, or are currently between projects and not assigned directly to any project. We want the result of our join to return all projects and all people.
Getting ready
To follow along with this recipe, download the Sample Files 5.5 folder from this book's GitHub repository.
How to do it…
Start by opening Tableau Prep and perform the following steps to create a full outer join to combine project and people data:
- Connect to the Projects.xlsx Excel file in order to create a brand-new flow with a data connection. From the available tables, drag the Projects table onto the canvas.
- The source we've connected to contains two tables, Projects and Project Staff. Without creating a brand-new data connection, drag the Project Staff table onto the canvas to create a second input, using the same data connection:
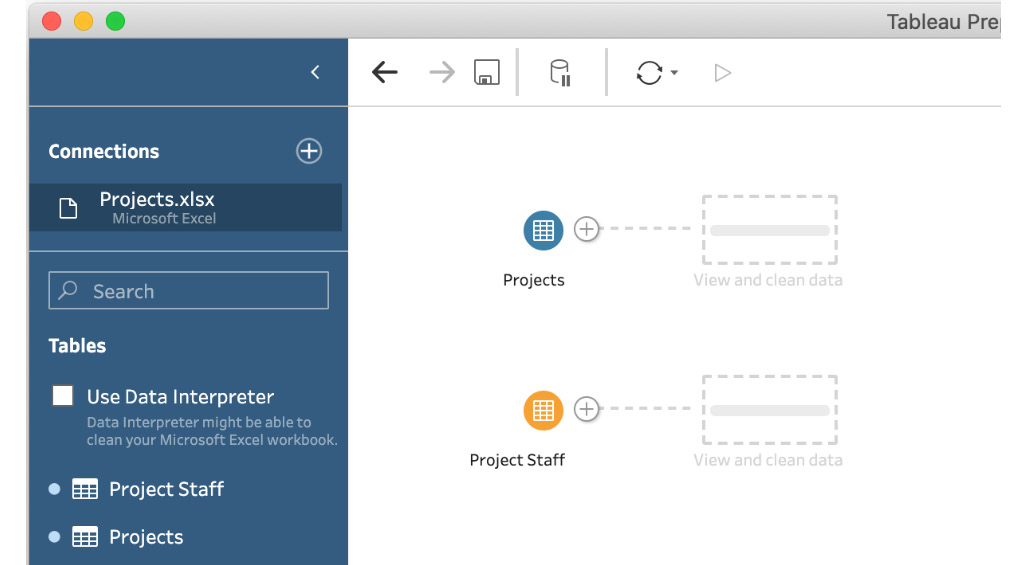
Figure 5.28 – Using the same connection for multiple inputs
- To initiate the join creation process, drag the Project Staff input on top of Projects, releasing it when the join icon is highlighted.
- Create a join clause using the Project Name field for the Projects input, and the Project field for the Project Staff input.
- To complete the configuration, click the left circle in the Venn diagram, followed by the right circle. This will then update the join to become a full outer join. Notice that the type name is abbreviated to simply state full:
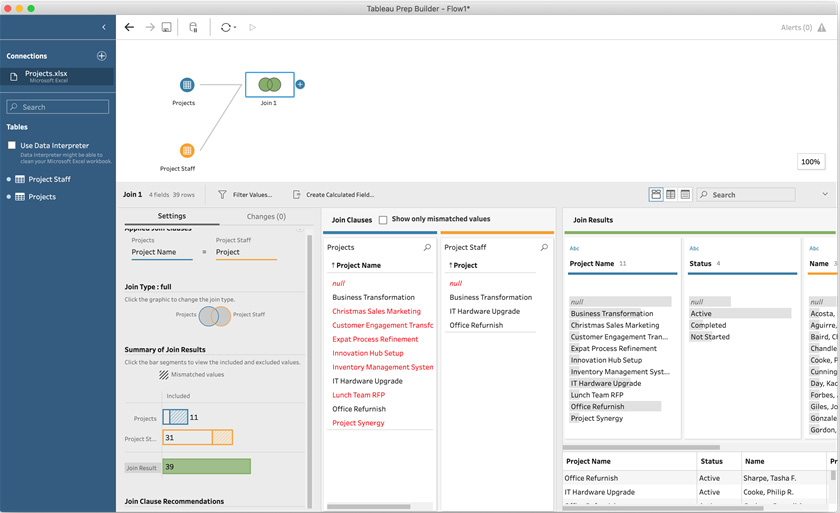
Figure 5.29 – A complete full outer join may show many mismatched values
With these steps completed, you've successfully performed a full outer join with Tableau Prep.
How it works…
In this recipe, you've leveraged a full outer join to combine two data sources, even if those sources have nothing in common. In this case, we have included projects that were not assigned any staff and included staff that were not assigned to any project.
Using a full outer join can come in handy for specific scenarios. However, there is a risk of creating a dataset that is incorrect since, with a full outer join, you may expect many mismatched values, and a mistake is easily made by ignoring the mismatches. It is prudent to double-check that your join clause is correct with any join, but perhaps even more so with a full join, for this reason.
Expanding datasets using a not inner join
In this chapter, we have assumed in all join-related recipes that there was an overlap between two data sources. However, for analysis purposes, you may be interested in what data is not overlapping, so that you can take action appropriately.
Using the same data as we've used in the Expanding datasets using a full outer join recipe, where we have a data source with projects, and another data source with project staff, we may change our use case to focus solely on data that does not overlap. That is, we are only interested in projects without staff assigned to them, or staff members not currently assigned to work on any project.
Getting ready
To follow along with this recipe, download the Sample Files 5.6 folder from this book's GitHub repository.
How to do it…
Start by opening Tableau Prep and perform the following steps to create a not inner join:
- Connect to the Projects.xlsx Excel file in order to create a brand-new flow with a data connection. From the available tables, drag Projects onto the canvas.
- From the same list of tables, drag Project Staff onto the canvas to create a second input step.
- Drag the Project Staff step on top of Projects, releasing when the join icon is highlighted, in order to create a new join.
- Configure Join Clause to match the data on Project Name from the Projects source, and Project from the Project Staff source.
- To create the not inner join, click the Venn diagram in the following order. First, click the left circle, then the right circle, and finally the center where both circles overlap. When done, the join type will state notInner:

Figure 5.30 – A fully configured notInner join
- Add a clean step to your flow, after the join, to view the data in the preview section. Here, you can clearly see that you have included only projects without staff and staff without projects:
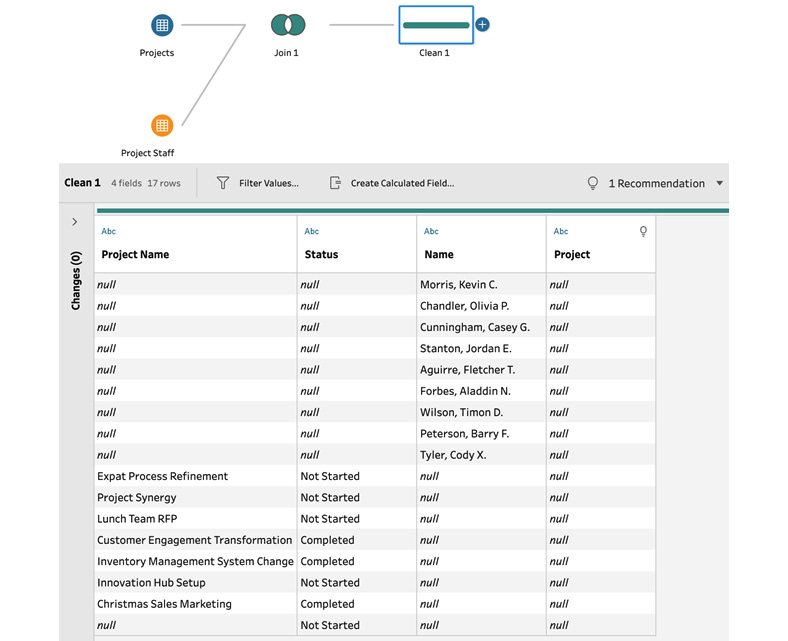
Figure 5.31 – Adding a clean step to easily inspect results
With this step completed, you've performed the Not Inner Join method of discarding data.
How it works…
A not inner join works by discarding the data which would be put through as the result of an inner join. In doing so, Tableau Prep allows you to quickly identify rows that cannot be matched across the data sources used. This can be helpful in scenarios such as the one used in this recipe, or even for identifying data quality issues where you expect a match, but the data is not providing a match on every row.