Chapter 5
Turnaround Talent
Management at Avon
Products
Marc Effron, Vice President, Talent
Management
What’s in this chapter?
- How Avon faced down a talent management challenge
- How to build a new talent management system
- The results of successful change
In early 2006, Avon Products, a global consumer products company focused on the economic empowerment of women around the world, began the most radical restructuring process in its long history. Driving this effort was the belief that Avon could sustain its historically strong financial performance while building the foundation for a larger, more globally integrated organization. The proposed changes would affect every aspect of the organization and would demand an approach to finding, building, and engaging talent that differed from anything tried before.
A Success-Driven Challenge
Avon Products is a 122-year-old company founded by David H. McConnell—a door-to-door bookseller who distributed free samples of perfume as an incentive to his customers. He soon discovered that customers were more interested in samples of his rose oil perfumes than in his books and so, in 1886, he founded the California Perfume Company. Renamed Avon Products in 1939, the organization steadily grew to become a leader in the direct selling of cosmetics, fragrances, and skin care products.
By 2005, Avon was an $8 billion company that had achieved a 10 percent cumulative annual growth rate (CAGR) in revenue and a 25 percent CAGR in operating profit from 2000 through 2004. A global company, Avon operated in more than 40 countries and received more than 70 percent of its earnings from outside the United States. By all typical financial metrics, it was a very successful company.
However, as the company entered 2006, it found itself challenged by flattening revenues and declining operating profits. Though the situation had many contributing causes, one underlying issue was that the company had grown faster than portions of its infrastructure and talent could support. As with many growing organizations, the structures, processes, and people that were right for a $5 billion company weren’t necessarily a good fit a $10 billion company.
The Turnaround
Faced with these challenges, Avon’s executive team launched a fundamental restructuring of the organization in January 2006. Some of the larger changes announced included
- Moving from a regional to a matrix structure: Geographic regions that had operated with significant latitude were now matrixed into select global business functions, primarily marketing and supply chain.
- Delayering: A systematic, six-month process was started to take the organization from 15 layers of management to eight, including a compensation and benefit reduction of up to 25 percent.
- Significant investment in executive talent: Of the 14 people reporting directly to the CEO, six were replaced externally from 2004 to 2006, including the CFO, head of North America, head of Latin America, and the leaders of human resources (HR), marketing, and strategy. Five others were put in new roles.
- New capabilities were created: A major effort to source brand management, marketing analytics, and supply chain capabilities was launched, which brought hundreds of new leaders into Avon.
The Talent Challenge
As the turnaround was launched, numerous gaps existed in both the talent Avon had and its ability to identify and grow its talent. Though some of these gaps were due to missing or poorly functioning talent processes, an underlying weakness seemed to be the overall approach to managing talent and the talent practices supporting it.
After reviewing Avon’s existing talent practices, members of the talent management (TM) group identified six overriding weaknesses that hurt their effectiveness. Specifically, they found that existing talent practices were
- Opaque: Neither managers nor associates knew how existing talent practices (that is, performance management, succession planning) worked or what they were intended to do. To the average employee, these processes were a black box.
- Egalitarian: Though the Avon culture reinforced the belief that every associate should be well treated, this value was being misinterpreted as requiring every associate to be treated in the same way. High performers weren’t enjoying a fundamentally different work experience, and low performers weren’t being managed effectively.
- Complex: The performance management form was 10 pages long, and the succession planning process required a full-time employee just to manage the data and assemble thick black binders of information for twice yearly reviews. Complexity existed without commensurate value, and the effectiveness rate of the talent practices was low.
- Episodic: Employee surveys, talent reviews, development planning, and succession planning, when done at al , were done at a frequency determined by individual managers around the world.
- Emotional: Decisions on talent movement, promotions, and other key talent activities were often influenced as much by personal knowledge and emotion as by objective facts.
- Meaningless: No talent practice had “teeth.” HR couldn’t answer the most basic question a manager might ask about talent practices: “What will happen to me if I don’t do this?”
A New Model
Avon’s TM group found itself in a difficult situation. Fundamental changes were needed in every talent practice, and the practices had to be changed and implemented in time to support the company’s turnaround. This meant that the practices had to be quick to build, easy to use, and, most of all, effective immediately.
Taking our guidance from the Top Companies for Leaders study (Effron, Greenslade, and Salob 2005) and the philosophies of Marshall Goldsmith (2006), we decided to build our talent practices with two key guiding principles:
- Execute on the “what”: The Top Companies for Leaders study found that simple, well-executed talent practices dominated at companies that consistently produced great earnings and great leaders. We similarly believed that fundamental talent practices (that is, performance management or succession planning) would deliver the expected results if they were consistently and flawlessly executed. We decided to build talent practices that were easy to implement and a talent management structure that would ensure that the practices were consistently and flawlessly implemented.
- Differentiate on “how”: Though disciplined execution could create a strong foundation for success, the six adjectives that described Avon’s current processes were largely responsible for their failure. We realized how we executed our talent management practices mattered as much as the practices themselves. We drew inspiration from Goldsmith’s revolutionary re-creation of the executive coaching process. He had taken a staid, academic/therapy model for improving leaders and turned it into a simple but powerful process that has been proven effective in changing leaders’ behaviors.
With these two guiding principles in place, we began a complete transformation of Avon’s talent practices.
From Opaque to Transparent
One of the most simple and powerful changes was to bring as much transparency as possible to every talent practice. TM redesigned existing practices and created new ones, using total transparency as the starting point. Transparency was only removed when confidentiality concerns outweighed the benefits of sharing information. The change in Avon’s 360-degree assessment process was a telling example.
The Avon 360-Degree Assessment
Avon’s 360-degree assessment process was hardly a model of transparency when the turnaround began. When the new TM leader arrived at Avon, he asked for copies of each vice president’s (VP’s) 360-degree assessment, with the goal of better understanding any common behavioral strengths and weaknesses. He was told by the 360-degree administrator in his group that he was not allowed to see them. The TM leader explained that he did not intend to take any action based on what he learned but simply wanted to learn more about his clients. He was again told “no”—that confidentiality prevented their disclosure.
Although the administrator was correct in withholding the information (the participants had been promised 100 percent confidentiality), the fact that the most critical behavioral information about top leaders was not visible to the TM leader (or anyone else) had to change. A new, much simpler 360-degree program was designed and implemented that explicitly stated that proper managerial and leadership behaviors were critical for a leader’s success at Avon. Citing that level of importance, the disclosure to all participants and respondents stated that the 360-degree information could be shown to the participant’s manager, HR leader, regional talent leader, and anyone else whom Avon’s senior HR team decided was critical to the participant’s development. It also stated that the behavioral information could be considered when making decisions about talent moves, including promotions and project assignments.
Helping to make this transition to transparency easier, the new 360-degree assessment and report differed from typical tools and borrowed heavily from the “feedforward” principles of Goldsmith (2006). Feedforward is a technique to accomplish behavior change by providing specific examples of behaviors desired in the future. This differs from traditional feedback techniques, which focus on rating the quality of a manager’s previous behaviors. The new 360-degree assessment identified the exact behaviors 360-degree respondents wanted to see more of, or less of, in the manager going forward. Without the potential stigma of having others see you rated as a “bad” manager, the issue of openly sharing 360-degree findings quickly evaporated.
Broad-Based Transparency
Transparency was woven into every talent process or program in a variety of ways. Examples include
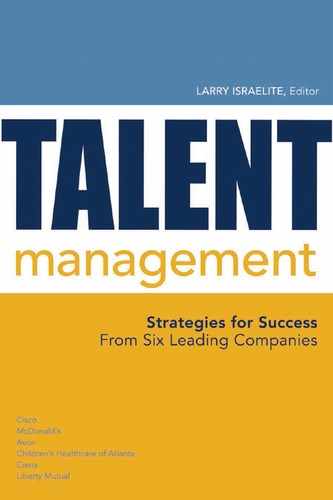
- Career development plans: To provide associates with more transparency about how to succeed at Avon, the HR team developed “the Deal”—shown in figure 5-1—which was a simple description of what was required to have a successful career at Avon and the parts the associate and Avon needed to play. The Deal made clear that every associate had to deliver results, display proper leadership behaviors, know our unique business, and take advantage of development experiences if he or she hoped to move forward in the organization.
Figure 5-1. The Avon “Deal”
Working Together to Help You Create a Great Career at Avon Grow
- Development courses: Avon acknowledged the unspoken but obvious fact about participating in leadership or functional training courses—of course, you’re being observed! We believed it was important for participants to understand that we were investing in their future and that monitoring that investment was critical. The larger investment that we made, the more explicitly we made the disclosure. For our Accelerated Development Process (a two-year, high-potential development process offered to the top 10 percent of VPs), we let them know that they were now “on Broadway.” The lights would be hotter, and the critics would be less forgiving. Executive committee members often sponsored these courses and observed throughout each class. The quality of leaders’ participation, how they interacted with their fellow participants, and even any unusual interactions (a member screaming at the hotel staff during an off-site meeting, for example) were data points that were considered during talent reviews.
- Performance reviews: Switching from a three-point scale to a fivepoint scale provided additional clarity to participants about their actual progress, as did clarifying the scale definitions. Associates were informed about what performance conversations their manager should be having with them and when. The recommended distribution of ratings across the scale was widely communicated. As part of our talent review process, managers were asked to share our assessment of a leader’s future potential with them him or her after the meetings.
From Complex to Simple
One of the most important changes made in Avon’s talent practices was the radical simplification of every process. We believed that traditional talent processes would work (that is, grow better talent, faster) if they were effectively executed. However, we understood from our experience and a plethora of research that most talent practices were complex—without that complexity adding any significant value. This level of complexity caused managers to avoid using those tools, so talent wasn’t grown at the pace or quality that companies required.
We committed ourselves to radically simplifying every talent process and ensuring that any complexity in these processes was balanced by an equal amount of value (as perceived by managers). Making this work was easier than we had anticipated. As the TM team designed each process, we would start with a blank sheet of paper and an open mind. We would set aside our hard-earned knowledge about the “right” way to design these processes and instead ask ourselves these questions:
- What is the fundamental business benefit that this talent process is trying to achieve?
- What is the simplest possible path to achieving this benefit?
- Can we add value to the process that would make it easier for managers to make smarter people decisions?
Using just these three questions, it was amazing how many steps and bells and whistles fell away from the existing processes. In fact, we were able to simplify most processes to a one-page form or report, which caused us to label our approach “one-page talent management.” The two examples that follow provide helpful illustrations.
Performance Management
Aligning associates with the turnaround goals of the business and ensuring that they were fairly evaluated was at the foundation of the business turnaround. As we entered the turnaround, the company had a complex 10-page performance management form with understandably low participation rates. Many associates had not had a performance review in three, four, or even five years. It would have been impossible to align associates with the vital few turnaround goals using that tool and process.
We stated that the fundamental business benefit of performance goals and reviews is that they aligned associates with business goals and caused associates to work toward these goals with the expectation of fair rewards.
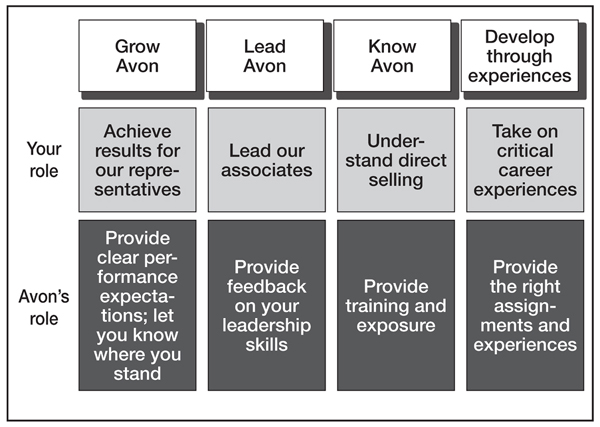
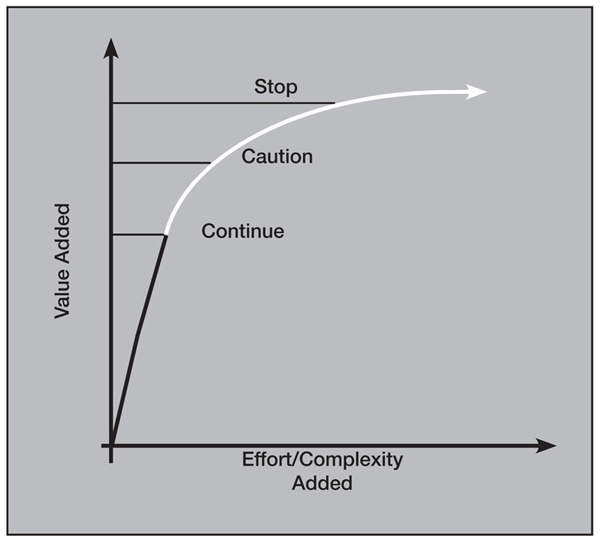
It seemed obvious that the easiest way of achieving the business goal was simply to have managers tell their associates what their goals were. It was straightforward, and the value to managers outweighed any complexity. After taking this small step forward, we advanced at the same pace, taking incrementally small steps forward in the design process. At each step, we would ask ourselves: Does this step add more value to managers than it does complexity? As long as it did, we added the additional design element. When the complexity/value curve started to level, as shown in figure 5-2, we carefully weighed adding any additional elements. And when we couldn’t justify that adding another unit of complexity would add another unit of value, we stopped.
What went away as the design process progressed? Just a few examples would include
- goal labels (highly valued, star performer, and so on), which added no value (in fact, blurred transparency!) but did add complexity
- individual rating of goals, which implied a false precision in the benefit of each goal and encouraged associates to game the system
Figure 5-2. The Complexity/Value Curve
- behavioral ratings, which were replaced with a focus on behaviors that would help achieve the current goals.
The output was a one-page form with spaces for listing the goal and the metric and recording the outcome. A maximum of four goals was allowed. Two behaviors that supported achievement of the current goal could be listed but were not formally rated. As a result, participation reached nearly 100 percent, and line managers actually thanked the talent team for creating a simple performance management process!
The Engagement Survey
When the turnaround began, there was no global process for understanding or acting on associate engagement issues. Select regions or departments made efforts of varying effectiveness, but there was no integrated focus on consistent measurement and improving engagement. In designing the engagement survey process, we applied the same three questions.
The first question concerned the business benefit. We accepted the substantial research that showed a correlation (and some that showed causation) between increasing engagement and increasing various business metrics. In addition, we felt the ability to measure managers’ effectiveness across engagement levels and changes would provide an opportunity for driving accountability for this issue. As with performance management, we knew that managers would use this tool if we could make it simple and, ideally, if we could show that it would allow them to more effectively manage their teams.
The second question concerned the simple path. Two goals were established for simplicity. One goal was to understand as much of what drove engagement as possible while asking the least number of questions. The second goal was to write the questions as simply as possible, so that if managers needed to improve the score on a question, their options for action would be relatively obvious.
The final version of the survey had 45 questions that explained 68 percent of the variance in engagement. The questions were quite simple, which had some value in itself, but the true value was multiplied 10-fold by the actions described below.
The third question concerned adding additional value. We were confident that if managers took the “right” actions to improve their engagement results, not only would the next year’s scores increase but the business would also benefit from the incremental improvement. The chal enge was to determine and simply communicate to the manager what the “right” actions were. Working with our external survey provider, we developed a statistical model that became the engine to produce these answers. The model al owed us to understand the power of each engagement dimension (that is, immediate manager, empowerment, senior management) to increase engagement and to express this power in an easy-to-understand statement.
For example, we could determine that the relationship between the immediate manager dimension and overall engagement was 2:1. This meant that for every two percentage points a manager could increase his or her immediate manager dimension score, that manager’s overall engagement result would increase by one percentage point. Even better, this model allowed us to tell every manager receiving a report which particular three or four questions were the key drivers of engagement for his or her group.
No longer would managers mistakenly look at the top 10 or bottom 10 questions to guess at which issues needed attention. We could tell them exactly where to focus their efforts. The list of these questions allowed managers to understand their survey results by reading just one page.
From Egalitarian to Differentiated
A critical step in supporting Avon’s turnaround was determining the quality of talent we had across the business—an outcome made much easier with transparent processes and conversations. Once we understood our talent inventory, we made a broad and explicit shift to differentiate our investment in talent. Though we would still invest in the development of every associate, we would more effectively match this level of investment with the expected return. We also differentiated leaders’ experiences to ensure that our highest-potential leaders were engaged, challenged, and tied to our company.
We made the shift to differentiation in a number of ways. Let’s look at three.
Communication to Leadership Teams
At the start of the turnaround process, presentations were made to each of the regional leadership teams to explain the shift in talent philosophy. The presentations helped to emphasize that we were serious about differentiation and allowed us to be relatively specific about what that meant and how we planned to apply it. We used a traditional “nine-box” grid that mapped performance over time and potential to illustrate the differences. The specific areas on which we differentiated included
- compensation targets
- development investments
- eligibility for participation in high-potential programs, global moves, and assignments to special projects.
Showing the differentiation on our new performance-and-potential matrix also let leaders know that accurately assessing talent on this tool was critical to our making the right talent investments.
A Few Big Bets
A key aspect of our philosophy was that we believed in placing a “few big bets” on a small number of leaders. This approach was informed by the research showing the vastly superior performance of the top five or 10 percent of a specific population and by the belief that flawless execution of well-known, high-potential development tactics would rapidly accelerate development (Hunter, Schmidt, and Judiesch 1990; Jones 1986). With limited funds to spend, we needed to make a decision about which talent bets would truly pay off.
Our monetary investment in our highest potential leaders was five to 10 times what we would invest in an average performer. This investment would include training, coaching, and incentive compensation, but we also invested the highly valuable time of our CEO, executive team, and board members. Our highest-potential leaders would often have an audience with these executives on a regular basis.
Tools and Processes
Our new talent review and performance review processes also emphasized our differentiation philosophy. Our new five-point performance scale came with a recommended distribution that assumed 15 percent of our managers would fail to meet some of their goals during the year. We believed that if goals were set at an appropriately challenging level, this was a reasonable expectation. As a consequence, we saw marginal performers—those who typically could have limped along for years with an average rating—receive the appropriate attention to either improve their performance or move them out of the business.
Our performance and potential grid (3 x 3) also had recommended distributions, but we found over time that the grid definitions better served our differentiation goals. After initially rating managers as having higher potential (the ability to move a certain number of levels over a certain period of time), their managers saw that the movement they predicted didn’t occur, and those with more potential to move became a smaller, more differentiated group. We also asked managers to “stack rank” box six, which contained average performers who were not likely to move upward within the next 24 months. This process helped to differentiate “solid average” performers from those who were probably below average and possibly blocking the career movement of others.
'
From Episodic to Disciplined
As with many companies, Avon had plenty of well-intentioned but busy managers. Processes like talent reviews, which were administratively complex and difficult to understand, were not going to inspire the typical manager to reorder his or her priority list. By greatly simplifying these processes, we had removed one barrier to effectiveness, but we hadn’t actually moved the process forward. We still needed to build organizational discipline around the execution of these simple new processes. We did that in a number of ways. Let’s look at three.
Consistent Global Tools and Processes
Many parts of the organization had created their own tools for activities like performance management or individual development. The corporate talent management function was not empowered to push for global consistency, and consequently there was no common approach to build Avon’s talent. This changed with a shift to global consistency that was championed by the senior vice president for HR.
Although all talent practices would now be designed by the corporate TM group, each still had to be vetted with the HR leaders of each geographic region and functional discipline. As a final part of the design process, adjustments were made to tools and processes to ensure that they met needs around the world.
Adding Talent Management Structure Globally
We created the role of regional talent management leader, a manager-or director-level role with responsibility for the local implementation of global processes. Five of these roles were created—one in each key geographic region—and the improved process discipline can be credited to them and their HR leaders. Regular contacts between regional leaders and the corporate TM group helped ensure great dialogue and consistent improvements in the processes.
A Committed CEO
Avon’s CEO, Andrea Jung, showed herself to be a tremendous supporter of effective talent processes. Both through her role modeling (that is, conducting performance reviews and setting clear goals for her team) and instilling process discipline (she held semi-annual talent review meetings with each person reporting directly to her and an executive committee talent calibration meeting twice each year), she signaled that these processes were important to her and had value for the organization.
This new level of discipline was an incredibly strong lever in our ability to assess and develop our talent. By executing these talent processes every six months, we were able to drive transparency for talent issues on a regular basis and instill accountability to take action on issues before the next cycle.
From Emotional to Factual
Avon had always been a company with genuine, heartfelt concern for its associates and an organization where strong relationships were built over a lifetime of employment. As the organization grew, a leader’s personal knowledge of associates’ performance or development needs often served as a key factor in determining talent movement. Though, in many cases, a leader’s individual knowledge was relatively accurate, it’s likely that a more calibrated point of view or additional quantitative facts may have allowed for richer discussions and more confidence in decision making.
The TM team worked to inject more fact-based decision making into talent discussions. Some of those facts were qualitative and others were quantitative, but as a whole they enabled a more complete discussion of an individual’s performance and potential.
Qualitative Facts Added
Additional qualitative facts were found in activities ranging from talent reviews to leadership and functional courses. In talent reviews, calibration discussions were added at each level so that individual managers could justify individual potential ratings to their peers. Those ratings might also be reviewed once again at the next level. Regional talent management leaders would facilitate many of the meetings to help leaders have complete and honest discussions, helping to ensure that the qualitative data were accurate.
Additional qualitative data were also added from a leader’s participation in leadership or functional development programs. Senior line managers would sponsor these programs, frequently attending the entire one, two, or three-week process. As mentioned above, these managers would then bring rich observations to the talent discussions about an individual’s performance in these classes—on projects, with their team, and so on.
Quantitative Facts Added
Two of the new tools discussed above—the 360-degree assessment and the engagement survey—provided quantitative facts that helped Avon assess talent. Progress toward engagement goals or individual behavior improvement (or the lack of it) was often a key indicator of readiness for additional development and responsibility.
From Meaningless to Consequential
Injecting managerial accountability for talent practices was a key factor in managers’ effectiveness. Before Avon’s turnaround, there was no accountability for these practices, and some managers took personal responsibility for implementing them while others did very little. In creating the new talent practices, we tried to inject accountability into each one, answering the critical question “Why should I do this?” For instance:
- Monetary accountability: Varying a leader’s pay for successfully or unsuccessfully managing talent is a dream of many HR and compensation leaders. We chose to use this lever in a targeted way when we applied it to engagement survey improvement. The executive team believed that the survey provided a strong enough measure of a manager’s focus on people issues that managers could be held accountable for improving it. The executive committee established year-over-year improvement in engagement scores as a goal in every VP’s performance plan.
- Associate-led accountability: To encourage the timely completion of the performance management process steps, we empowered associates to hold their managers accountable. A memo was sent to every associate at the beginning of each year informing them of the specific action steps and corresponding dates their managers should be taking to set goals. A similar note was sent for midyear and year-end reviews. The note asked associates to let their local HR leaders know if these steps weren’t occurring.
- CEO-led accountability: Every six months, each executive team member would meet with the CEO to present his or her talent review. Actions promised at the last meeting were reviewed, and progress was noted. Leaders knew that promises were being tracked and reviewed and that progress would need to be shown at the subsequent meetings.
Though accountability was applied in many different ways, the common outcome was that leaders understood that focusing on talent during the turnaround (and after) mattered and that they were responsible for getting this done.
The progress that was made on talent issues was helped by the various factors discussed above, from a committed CEO and senior vice president for HR to the urgency of a turnaround to the dramatic change in talent practices. But it would not have been possible without the desire of Avon’s managers to do the right thing. We started with a culture that valued every associate, and we channeled this positive spirit using sound processes and unflinching discipline. We didn’t delude ourselves into thinking that these talent changes would have been possible without the power of Avon’s culture.
The Results of a Talent Turnaround
At the beginning of this chapter, I described the six weaknesses in Avon’s talent practices. Over the initial turnaround period (12 to 18 months), we moved these processes:
- From opaque to transparent: Leaders now know what’s required to be successful, how we’ll help them get there, how we’ll measure success, and the consequences of higher and lower performance. They know their performance rating, and our feelings about their potential to advance.
- From egalitarian to differentiated: We actively differentiated levels of Avon’s talent and provided each level with the appropriate experience. Our highest-potential leaders understand how we feel about them, and they see a commensurate investment. Our lower-performing leaders get the attention they need.
- From complex to simple: Managers now do the right thing for their associates, both because we’ve lowered the barriers we’d previously built and because we’ve helped them with value-added tools and information.
- From episodic to disciplined: Processes now happen on schedule and consistently around the world.
- From emotional to factual: Talent decisions are made with an additional layer of qualitative and quantitative information drawn from many different leaders’ experiences.
- From meaningless to consequential: Leaders know that they must build talent the Avon way for both their short-and long-term success.
Measuring the Talent Turnaround’s Success
The specific talent practices we targeted have seen significant improvements in effectiveness. Ratings of immediate managers (including items like clear goal setting, frequent feedback, and development planning) have increased up to 17 percent, with directors and vice presidents giving their immediate managers nearly a 90-percent approval rating. The ratings of people effectiveness (which captures many HR and talent practices) have increased up to 16 percent, including strong gains on questions related to dealing appropriately with low performers and holding leaders accountable for their results.
More transparency has allowed faster movement of talent into key markets. Simpler processes have allowed us to accelerate the development of leaders. And holding leaders accountable for their behavior has improved the work experience for associates around the world.
Though these changes were hard-fought and we believe created much more effective processes, a more important set of metrics exists. Avon has achieved all of its expense-savings goals since the start of the turnaround and has recently reinforced its commitments to even greater expense reductions. Even with this lower cost base and 10 percent fewer associates, Avon has grown from revenues of $8 billion in 2005 to nearly $11 billion in projected 2009 revenues while delivering strong single-digit earnings growth.
We can’t say with certainty that our new talent practices have contributed to either these cost savings or our revenue increases. We are confident, however, that the talent practices now in place will deliver better leaders, faster, to help Avon meet its business goals.
Note: The views expressed by the author are his own and do not necessarily represent those of Avon Products.