Chapter 10
Graphics
As a director, I always assume that the audience is watching from a noisy bar, or contending with the children, and ultimately unable to hear the commentators. Hence I always place a huge emphasis on the value of graphics and consequently the amount of time devoted to inserting the graphical information on the screen so that the audience has sufficient time to digest the information.
Brian Douglas, Director
Graphics were initially introduced to enhance the dialogue of the commentators with text; they evolved into images, GPS or data-driven course analysis, animations, and more. In many situations, as they have evolved, the industry has changed to a point where they have almost replaced the audio track as the primary means of communication for information and statistics.

Figure 10.1
3D graphics.
Television graphics can be divided into two basic types—text graphics and illustrative graphics. Both these types of graphics contain some of the same elements but they are generally produced for separate purposes, often by separate types of operators and sometimes by separate departments.
Text graphics are usually composed in either 2D or 3D character generators. They can be static or they can be animated. They usually contain a dense amount of information—in fact, their whole purpose is to communicate as much information as possible. The screen can contain some graphic elements but the whole focus is the information, not the pretty background or the design elements, which usually come out of the standard library for the particular look or show. The person composing this type of graphic is generally called a character generator operator (see Figure 10.1).
Illustrative graphics are much less predictable on a day-to-day basis. This type of graphic must also adhere to the design concepts defined as being correct for the look or show but the type of requests depend on the needs of that day’s stories. This type of graphic can include over-the-shoulder graphics to illustrate the story being talked about by the person on the screen, static or animated backgrounds for text from the graphics equipment, maps that illustrate story locations, animations to illustrate what happened in the story being covered, logo designs, promotional material for print or air, introductions to a show or segment, and bumpers in and out of the show. Illustrative graphics can be composed in many different systems. These systems can range anywhere from a simple and inexpensive system where a PC runs a paint program to the large and hugely expensive systems where masses of extremely high-end computers are running 3D real-time animation programs. The person composing this type of graphic varies from place to place; in general, they are designated as a composer, animator, or graphic artist.
Television Graphics Goals
Design for design’s sake is useless. We haven’t reached our objectives if viewers only talked about our new graphics. We want people to appreciate the graphics as part of a more pleasurable way to see the whole. .. information package that we present.
Noubar Stone, Creative Director, ESPN
- Convey information clearly and directly.
- Establish the show’s overall mood and tone through the graphic style.
- Present facts, concepts, or processes visually so the viewer will understand the program content.
- Prepare for maximum communications impact.
The design process begins, of course, with the need for a particular graphic. The needs vary, but basically the graphic is to impart information identification, results, statistics, time or speed, position, titles, etc. Once the need is known, the graphic artist goes to work on the design concept, then a graphic operator converts the design to a digital format. A digital format allows the image to be manipulated into a number of variations. The image might be titled, reversed, flipped, zoomed, squeezed, folded, and, using colors, the image can be provided in a 3D effect.
Olympics Television Production
Television as a format has an aspect ratio that is defined as the ratio of the proportions of the height to the width of the television image. Historically, television had an aspect ratio of 4:3. However, HDTV has an aspect ratio of 16:9. It is important to understand the ratios so that graphics can be designed to fit the format of the production. Graphics created for 4:3 should be different than those created for 16:9 (see Figure 10.1). The scanning area is the image seen in the camera viewfinder or in the graphics or on-air monitor.
In many cases, home televisions do not have the same scanning area as the production equipment. As a result, the graphic should not fill the scanning area as it may not be seen on home television sets. For this reason, a safe title area has been created that allows a graphic designer or operator to create graphics within a set area that has been designed to be seen, roughly the center 80 percent of the scanning area, is where all graphics should be placed to ensure the goals for television graphics are met (see Figure 10.2).
Most companies or events have created their own graphic look for events. Stations and networks have created graphic standards that identify specific colors, font styles, sizing, presentation, and specific animations that are to be used for programming. These graphics are used to create a television brand. The idea is that whenever anyone sees the combination of font, color, and presentation, they will immediately know what event, network, or station they are watching.
HD graphics brought new challenges to the graphic designer. Unlike television images of the past, the quality of the HD image allows every detail of the graphic to be scrutinized. That means that every bit of design has to be specifically created or it will look like a mistake.
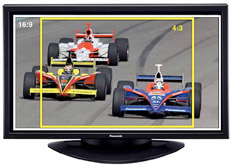
Figure 10.2
Television aspect ratios.
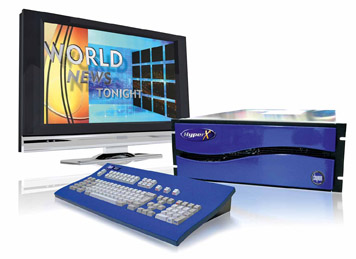
Figure 10.3
Character generator used for creating graphics.
Source: Photo courtesy of Chyron.
According to the International Amateur Athletic Federation Television Guidelines, graphics must be bold and clear, because satellite transmissions will cause a down-grading of quality. For full screen graphics, “freezing” the background helps marginally, but even more effective is to put the graphics against a clear background (e.g., grass rather than crowd), increase the size of the lettering, and add a drop shadow to prevent bleeding. In addition, brighten the colors. A defocused, soft background gives greater texture to the superimposed image and greatly improves legibility.
Where time allows, all competitors need to be identified, including name, number, country, and vital biographical information.
A variety of equipment is used to create the different graphic looks that are seen on television. Stand-alone systems (character generator/paint boxes) are slowly giving way to graphic production software that can run in almost any high-end desktop computer (see Figure 10.3).
In most cases, the actual design of the graphics has been determined weeks or months before the sports event. Depending on the rules of that particular graphics pack age, the operator will have either little or no input into which graphics are used and in what manner. The use of these “shells” should be laid out in the graphic package rulebook, or outlined by the font coordinator if that position exists in the crew and the person has worked with the package before. In all cases, preparation time consists of inputting data and statistics that will be used during the game, locating and documenting locations and usage of formats that will be updated with statistics during the game, as well as making backup copies of everything that could be needed. There will be no time during the game to stop and look it up and no chance to rebuild something that was accidentally erased. There may be some circumstances when an operator is required to create or modify a shell because no available formats fit the usage. In this case, the pack age rulebook should include guidelines on how to do this while still following the format.
Preparing for an Event as a Graphics Operator
- Develop an understanding of the sport or event. The more you know about the official rules and participants, the more valuable you are to the production team.
- Gain a deep knowledge of the graphics package being used. You contribute greatly if you know the capabilities of the system and can recall specific items with minimal use of reference material. Reacting quickly, accurately, and decisively to the needs of the production is important.
- Organization actually impacts everything and is the key that allows everything to be used to its full potential.
- Gain knowledge of the hardware. It helps with communication and teamwork between coordinator and operator. Knowledge is power.
- Know how to reach support services for your equipment. Learn to recognize system problems. Know alternative information sources and keep handy the reference that gives emergency procedures and contact methods for support personnel.
- Think teamwork. When everyone works together as a cohesive unit the capability of the unit becomes something greater than anyone would think possible.
Maria Persechino-Romero, Graphics Coordinator
Sports Data for Graphics
Character generators can be connected to an official scoring/data system. This type of interface has significantly improved the accuracy of broadcast graphics, allowing for automatic changes that are updated by the official scoring system.
In the case of a system using a sports data interface, rules for usage and the “do” and “don’t” of the system should be well documented. This includes any warnings or standard procedures that must be followed. All interfaces should be tested to see that they are working correctly well before the event begins. It should be noted that in many data interface systems, things such as page numbers and content of pages are strictly defined by the system. Usually, pages cannot be deleted, modified, or moved without causing problems with the system. Pages added by the operator may or may not be supported by the data interface system. Safe record locations for operator-defined pages should also be documented.
Tips on Making Great TV Graphics
Graphics exist to help explain what is happening on screen, not to replace or detract from what is being seen. The graphics must accent the action on the screen and not overwhelm the competition. Our duty is to inform clearly and concisely.
Olympic Broadcast Graphic Guidelines
Effective graphics take time to create. The graphic artist needs to think through a number of stages in the process (see Figure 10.4). Al Tompkins, from the Poynter Institute, has the following suggestions about creating great television graphics. We have adapted them a bit to fit our context:
- What is the context of the graphic? Is the information something that is important to the viewer? How does this statistic relate to others? Does it help the viewer understand the game better?
- Think clearly about the purpose of the graphic. Ask yourself, what exactly do I want the viewer to learn from this graphic?
- Does an image convey the message better than words or numbers? Consider the Olympics where pictograms are used to illustrate sports instead of words.
- Movement is good, but do not overuse it. Do not overwhelm the viewer with a constant variety of movement.
- When creating a new graphic design, get someone else to look at it. Let them tell you what the graphic conveys to them.
Viewer Enhancement Tools
Viewer enhancement tools provide television with an innovative tool to upgrade their sports programs for major sports events in the near future.
Hartmut Hiestermann, Global Sportsnet, Germany
As directors and producers continue to look for tools and techniques that will lead to a more informed viewer, they are increasingly turning to computer-based viewer enhancement tools. These are a type of graphics but may be part of a specialty graphics system. These tools are often not operated by inside television network personnel. They are often operated by the company that created the system.
Figure 10.4
Effective graphics take time to create. The graphic artist needs to think through a number of stages in the process.
These viewer enhancement tools cover a wide range of options. Some of them have been successful, some not. Just as computer graphics were considered gimmicks at one point, some of these technologies will be normal in the future. Below is a review of some of the past technologies, as well as some of the newest ones.
The FoxTrax
One of the original technological enhancements to television sports was the glowing hockey puck created by Fox Sports called the FoxTrax. “The goal was simple. Make the televised image of a hockey puck glow so it’s easier for the viewer to spot, and, when it’s going really fast, put a tail on it showing its path.” The company hoped the system could overcome the main complaint about televised hockey: the trouble that casual views have in following the fast-moving puck on television screens. To track the puck, a number of parameters had to be fed into a computer system and updated continually. First, the system had to know exactly where the broadcast cameras were focused. It also had to have some idea of how each camera lens distorts the image; different brands of lenses vary. It then had to figure out which camera’s feed was being displayed to viewers at any moment. Meanwhile, the system had to know where the puck was and how fast it was traveling, and then it had to create a graphic based on that data and overlay it onto the video image 60 times a second. All of these things had to be exactly synchronized, as the cameras were zooming and panning and the puck was traveling at up to 160 km an hour. Making it work required putting infrared transmitters into each hockey puck (see Figures 10.5 and 10.6). Technically, the project was a success. But serious hockey fans hated it. After three years, pro hockey broadcasts in the United States switched networks, and the system died a quiet death. The FoxTrax system’s tech nology has now been adapted and is used to highlight race cars during a motor sports events. The glow technology allows a commentator to illustrate a specific car’s place on the track when it is amid other cars.
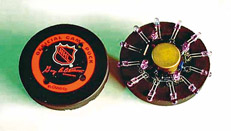
Figure 10.5
Transmitters were installed in a hockey puck to allow viewers to follow the puck on television.
Source: Photo courtesy of Sportvision.
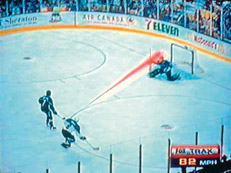
Figure 10.6
The transmitters in the hockey puck, shown in , created a comet tail on the puck for television viewers.
Source: Photo courtesy of Sportvision.
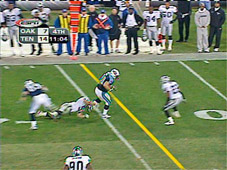
Figure 10.7
The virtual line on the field of play was quickly embraced by sport fans.
Source: Photo courtesy of Orad.
Virtual Information Graphics
A number of companies have now created virtual lines on the field of play of different sports and they have become almost the norm. The virtual line on the field of play was more difficult to develop than the hockey puck since the line needed to be perfectly straight (which is difficult with the variety of lenses used), had to look realistic when located on rough ground next to the actual field lines and must appear under the players. This technology was almost immediately accepted by the viewers in sports such as American football, football/soccer, and cricket (see Figure 10.7).
Virtual Ads
A number of companies provide virtual ad services. These services generally use a type of “green screen” or chroma-key technology to place the ads on the screen. The systems electronically replace existing advertising signs and banners or insert graphics right on the field of play with advertising that has been sold to television program sponsors. The images can also be inserted into the natural landscape of the field or on a racetrack. While the virtual ads are not seen if you are at the venue, they are added to the broadcast output for the viewing audience (see Figure 10.8).
RACEf/x
Global Positioning System (GPS) technology is now used in race cars in conjunction with computer graphics to give the viewer detailed information about the driver’s name, car’s position on the course, speed, brake status, and tachometer (see Figure 10.9).
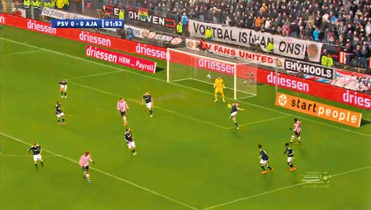
Figure 10.8
Virtual ads have become commonplace on many networks.
Source: Photo courtesy of Orad.
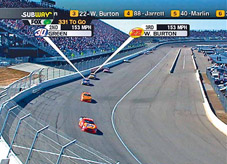
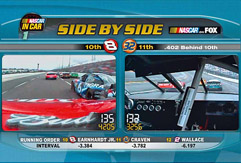
Figure 10.9
Global Positioning System (GPS) technology allows more data to be transmitted to the viewer real time.
Source: Courtesy of Sportvision.
Transposition Replay Systems
SimulCam transposes a live athlete’s performance with the previous or record holder’s performance. This simultaneous broadcast of the two performances looked so real that unknowing viewers during a Winter Olympics voiced concern that the two athletes should not be skiing so close together (see Figure 10.10). This computer transposition system allows the audience the opportunity to compare two performances, allowing them to observe the minute differences in the athletes’ movements. This technology can be used with any sports that included individual performances within certain constraints on the field of play.
Another transposition technology, Cyber-Sport, creates a virtual runner that moves at a world record pace around an athletics track as a race unfolds. Like SimilCam above, the virtual runner adds to the drama of the race, allowing the viewer to understand how the current race compares to others.
StroMotion
StroMotion was first used by ABC Sports to allow the viewer to analyze the quadruple jump in figure skating. The technology shows individual video frames of the athlete’s performance within one visible frame. Since some sports occur so rapidly that the viewer cannot see the detailed action, StroMotion can break the action down to show key frames, compiling them into one frame, allowing the viewer to analyze the athlete’s action (see Figure 10.11).
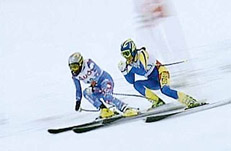
Figure 10.10
Transposition systems allow the viewer to compare athletes.
Source: Courtesy of Dartfish/Sportvision.
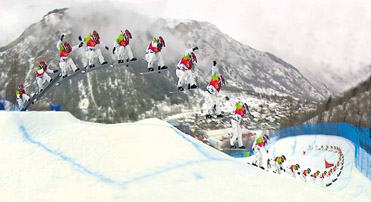
Figure 10.11
StroMotion is used to analyze the athlete’s movements.
Source: Courtesy of Dartfish/Sportvision.
Technology Summary
The biggest challenge with new technology is to overuse them. At the end of the show, you want them to remember the game, not the technology. The difference between using new technology as “electronic toys” and using them responsibly is when they are selected on the basis of whether they contribute to the viewer’s understanding and enjoyment of the sport being covered:
.. . this is about content. .. it’s factually easy to become mesmerized by new technology for its own sake. But technology is only a means to an end—and the end is great content.
Michael Grade, Chairman, BBC, United Kingdom