
8.3. Capturing Performance Requirements
The term performance is such a subjective term that it's important to receive input from all the project stake holders on what is considered "good" performance. Earlier in this chapter you learned what is considered to be "good" performance times, but these times may not match the project stake holder's thoughts. Reaching out to business stake holders such as Domain Experts and users of the system will give you an idea of how they expect the application to perform. Also include developers, architects, and network administrators for their input into how they expect the system to perform.
Most of the time if you ask project stake holders how the application should perform they will reply with "fast." Testing a web application that is intended for use on an intranet and is only expected to support 10 users at a time is a bit different than testing a web application intended to be open as a public service on the Internet that might receive more than 100,000 concurrent users at a time. Knowing how the application will be used will help you design a performance test that is effective.
8.3.1. What to Ask First
To get the proverbial requirements ball rolling, the following three questions can be asked to help break the ice or cause a discussion that may last the entire day in some cases.
8.3.1.1. Availability
Is it acceptable for the application to have any downtime? The most common answer to this question is "No." Clients do not realize what goes into creating an infrastructure that allows a system to truly be available all the time. When you start explaining the cost associated with the many systems required — such as duplicate data centers in different regions of the world — to ensure the application would survive a natural disaster, clients start to realize this could get expensive. Their answer often changes after this and the real requirements can be flushed out.
When discovering how available the site needs to be, there is often a cost associated with each minute of downtime that occurs in the application. Using these numbers to weigh the cost of a performance test can often persuade customers that the upfront testing to ensure the application will perform as expected is worth the cost.
8.3.1.2. Scalability and Concurrency
Simply put, how many concurrent users will be using your application at a given time? Again, this question often confuses clients and they will give you a number that represents the total number of users for the application. Business rules often dictate the number of concurrent users. Although the application may have 200 named users, only two of them may be accessing the system at a given time because they only have two computers.
Having an idea about how large a web application may grow will also help define how many users should be used. A good rule of thumb is to add 10 percent to the number of users to allow for a little leeway.
8.3.1.3. Response Time
During peak hours, how fast should certain pages respond? A baseline of how fast each individual page loads should be created before collecting the requirements for the response time of each page under load. Clients will require some pages to have fewer than two-second load times, and understand if some pages that execute long-running queries take 10 seconds to load.
After the baseline is established, collecting the expected response time for when the application is under load will be helpful in determining when a performance test failed. Having collected concurrency requirements, you may find that your performance test needs to have a response time of two seconds for all pages with a concurrent load of 100 users.
8.3.1.4. Other Questions to Ask Clients
Where will the application be hosted and where will the majority of the users access the site from?
How many users will the application support when it's released? Will this number increase in one year, how about two years?
When do you expect the busiest time of your application to be?
What functionality will be changing between iterations?
How many servers do you initially plan on needing for the application? Where will the servers be located? What are the specifications for each server?
What are the throughput and latency goals for the application? You may establish a goal of satisfying 90 percent of HTTP requests for file sizes of less than 25k at a rate of three seconds or faster.
8.3.1.5. Setting Performance Testing Objectives
Setting objectives for a performance test can be helpful to keep the team on target with what they are looking to accomplish with the test.
Ensure that the application will maintain availability during peak usage.
Find the page with the slowest response time.
Determine how the application will perform with 100 users.
Determine when a load balancer is needed.
Detect bottlenecks and provide insight on how to fix them.
Determine how many transactions to the database it will take until the hard disk is full.
Determine how many concurrent users the site will support.
Help the development team in determining how the application performs under various configuration options.
Provide input for scalability and capacity planning.
Leading clients to set realistic and appropriate performance targets can be a difficult task, but a task of necessity. Without knowing how the system should perform, how do you know if the performance test has passed? The questions you have examined thus far may appear to be common sense questions, but are important in creating a performance test that is effective.
8.3.2. Load Test Architecture
Figuring out an effective testing architecture for a load test can be a difficult task. When you are new to load testing you spend a great deal of time focusing on architecture and figuring out exactly how many machines and what needs to be installed on each machine to create an effective load test. In most load tests there are two systems to plan the architecture for the performance test environment and the application under test. This type of architecture is shown in Figure 8-1.
Figure 8-1. Sample performance test environment
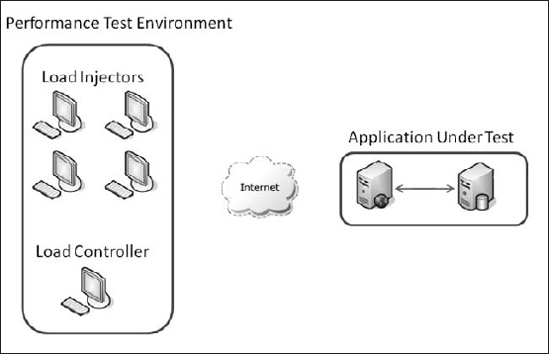
8.3.2.1. Performance Test Environment
The terminology will be different depending on which testing tool you have selected to perform the load test, but the basic concepts will be the same.
Load Injectors. Load injectors (also known as agents) will run a performance test and report the results to the load controller. The number of load injectors configured for a performance test will vary depending on how much traffic is required to meet the performance requirements. The more load injectors, the more traffic you will be able to generate. The amount of traffic a load injector can generate is related to the hardware specifications of the individual machines and the amount of bandwidth available. If you are using older hardware in your performance test environment, you may need a greater number of load injectors than if you where using newer hardware for the load injectors.
Load Controllers. The load controller (also known as the Analysis module) is responsible for controlling the load injectors and recording the performance information collected from the load injectors. The load controller of many popular performance testing suites contain real-time analysis tools to see each metrics from each load injector as well as a total metrics combined from all load injectors. In most performance testing environments there is only one load controller.
8.3.2.2. Application under Test
This is the architecture of the application you are testing. Most likely you have heard that the environment you are testing on should match the production environment as closely as possible, and we're not going to tell you any different. This is extremely important when executing performance tests. The ideal situation is to be able to perform the testing on the production server, where the application plans to reside when development has been completed. This option is more common in green field application development (newly created applications) — clients plan on purchasing new hardware, after it is set up, your team can move in and start pushing the new hardware to its limits.
You don't live in an ideal world, and most of the time you're stuck using retired machines that are much slower than their production counterparts. If you are in this situation, it's still important to execute a performance test, but adjust your requirements. If you are not meeting a lower performance expectation on the slower hardware, more than likely you will not meet your original requirements on the production server. Also try to make an effort to match any hardware configuration that you can. If the production server has a RAID array where the SQL Server Transaction log file is stored, try to replicate this as closely as possible.
Another common area that is overlooked is the size of data being used in the performance test. If you have production data it's recommended that you obfuscate any personal data or confidential data and use this subset of data for your performance test. Duplicating all aspects of the production machine is important.
Virtual machines are becoming a very popular solution for network administrators to easily provide production and development environments to users.
In a recent stress test that I performed, the client wanted to stress a newly created web application on their production servers. The new application was created on an open source .NET CMS system that had gotten a bad reputation for poor performance. The requirements stated that the application needed to respond in less than two seconds with a constant load of 3,000 users. The client wanted to make sure these numbers were met, so it was decided the best place to perform the stress was on the production server.
The great part about this stress is that the production environment was set up in all virtual machines with the SQL Server and Web Server separated. We looked through the existing web applications' log files, and determined that the site was slow on Sundays between 11:00 A.M. and 4:00 P.M. We scaled back the existing resources allocated to the current web applications virtual machine and brought up a new virtual machine with resources allocated to the new virtual machine that matched what it would look like when the application was completed.
We completed our stress test, and had no issues with the existing users accessing the current website.
8.3.3. Designing an Effective Performance Test Environment
After a thorough requirements analysis, the next phase of the performance test is designing a testing environment that will ensure you are able to satisfy that the performance requirements have been collected. You have learned about the performance testing architecture, but what other aspects go into creating an effective performance test?
8.3.3.1. Data Size and Quality
Ensure that you are testing with a set of data that is representative of what you would expect the production system to be. Try to design load tests that replicate an actual work load during normal and peak access time for the application under test. The best type of data is production data with personal data obfuscated. New applications may not have this luxury, but tools such as the SQL Data Generator from Red Gate will help you generate data that is very realistic.
8.3.3.2. Testing the Performance Test
Most performance tests run over the course of a few hours, and depending on the load you need to generate, access to the testing hardware may only be available for short scheduled times. Performance tests can be like a stack of cards; because of the many layers that are involved, if one layer starts to fail, the performance test tends to collapse in on itself. Try to test things on a small scale before ramping up to your fully intended load.
Take the time to ensure each layer of the performance test is working correctly. It would be a shame to run a performance test for a few hours only to realize you forgot to record a few key performance metrics, and had to start the test all over again.
8.3.3.3. Stability of the Application under Test
We have stressed the fact that it is important for you to test for performance from the beginning of the application development cycle, but there is a catch 22 in there. If your application is throwing errors on every other page, a performance test is not going to be of much use. Before you can execute a performance test, your application must meet certain quality standards. These quality standards should be created by the development team.
8.3.3.4. Bandwidth Considerations
A common aspect to performance testing that is often forgotten until the last minute is bandwidth. Having the Internet between the load injectors is an important aspect to performance testing. Performing the test with all layers on the same LAN will not be as effective. Most load tests will generate a great deal of bandwidth, and it's imperative that you ensure that the location where the test injectors reside can handle this stress.
In past years it was common to see load injectors at different locations to accommodate for bandwidth limitations, but with bandwidth decreasing in cost from year to year this is becoming less common. Running the test on a small scale will help you estimate exactly how much bandwidth will be needed for the full scale performance test.
8.3.3.5. Ensuring Accurate Performance Test Design
The tests that are executed during the performance test should represent behaviors that you would expect a user to perform on your web application. Testing key pages, such as login pages, or testing paths a user may follow, such as a checkout process are important behaviors. There are some behaviors that are commonly overlooked but are also important for creating effective performance tests.
Simulating different modem speeds. Testing how the web application performs over different connection speeds is extremely important for external-facing web applications. Don't assume that everyone has a broadband connection.
Browser cache simulation. Many performance testing suites allow you to simulate if the browser is caching page requests. Having a good mix is a good idea.
User sessions. Most performance testing suites have functionality to "spoof" IP addresses — to simulate traffic from different sources. This is useful for applications that limit user sessions or filter connections based on IP addresses.
Load injection. How should the load be applied to the site, should it happen all at once, should it "ramp-up" slowly over a time period, or should it ramp back down?
8.3.3.6. Load Injector Hardware
Do you have sufficient hardware resources to generate the required load to meet the requirements for the performance test? Hardware is getting cheaper and cheaper every year, but it's still worth mentioning to ensure that your current hardware will be able to generate the required load. Again, running the test on a small scale will help you flush out these issues.
If the load injectors become overloaded, the performance test no longer represents real-life behavior. The performance test may then have invalid results thus rendering the performance test useless.
8.3.3.7. Measuring Performance
Ensure you have identified the Key Performance Metrics and that performance counters have been set up to collect this data. KPIs such as server errors, server utilization, memory usage, disk usage, and processor usage are all important metrics to monitor as your performance test is running.
Have you decided how these KPIs will be summarized — visually through a chart or perhaps raw numbers via tabular data?
8.3.3.8. SSL-Increased Overhead
The use of SSL certificates on websites will slow performance between web servers and browsers. The overhead can vary greatly depending on the type of certificate that is used, so it's imperative that the application under test have a similar SSL certificate installed during load testing. SSL certificate overhead is such a problem with large applications that companies have begun to sell hardware SSL acceleration solutions that will offload the public key encryption from the web server's hardware.
8.3.3.9. In-House Testing or Outsourcing?
Performance testing can be a very expensive task depending on the experience of your testers/developers, which tools have been selected, and the amount of load that is required. In some situations companies need to purchase new hardware to generate the loads specified in the performance requirements. It's common that companies feel this is too large a task to take on and will outsource the testing. Companies that are experienced with performance will have labs set up that can generate a great deal of load without issues. If you decide to outsource performance testing, remember to think of performance as a feature and continue to have your testers/developers execute their own performance tests, but on a smaller scale.
8.3.4. Performance Monitoring
An important aspect of performance testing is monitoring the health of the application under test along with the servers the application is running on. Performance can be measured by using monitoring tools that record specific behaviors related to hardware or software functions, and report these metrics to the tester. Many performance testing suites include tools to monitor the system while the test is running. While these tools provide invaluable information there are other monitoring tools that should be used along with the tools included in the testing suite.
8.3.4.1. Real-Time Analysis
It's important to note that after your performance test is running, you can't just walk away. Although some performance tests may be scheduled to run for upward of 24 hours, it's important that you monitor the test and keep a watchful eye on how the application and servers are performing. Although all the performance metrics will be logged, many issues can be resolved by just watching the system metrics while the test is being performed. Real-time analysis can be a very boring task. Essentially you are waiting for something to happen and a good portion of the time nothing happens.
Thorough real-time analysis can be accomplished with a variety of tools. Your performance testing suite is a starting point, but sometimes basic tools such as the Windows Task Manager will provide enough information to realize something is wrong with the performance test.
It's common for testers to only monitor the big three key performance indicators during real-time analysis and save the in-depth analysis until the test has completed.
CPU
Memory
Disk input/output
Performance counters are invaluable tools for collecting performance metrics while the application is under test. A very common question we are asked is, what performance counters should be monitored and what do they do? The list of counters you'll be learning about in the next sections can be found in the Microsoft Performance Monitor tool included in all Microsoft Operating systems.
8.3.4.2. Memory Performance Counters
It's important to monitor memory counters while performance testing to ensure that memory is being released as expected. Many performance tests find that over a time period with a constant load of users, the server's performance will degrade over time, issues that can be attributed to memory leaks. Memory leaks are caused by processors that are not releasing their hold on memory correctly. In .NET the Garbage Collector prevents many memory leaks from occurring, but they still tend to happen.
Page Faults/Sec. Average number of pages faulted per second. A page is a fixed-length block of memory that is used to transfer data between physical memory and hard disk. A page fault is a software exception raised by the hardware when a program accesses a page that is mapped in address space, but not loaded in physical memory.
Available Bytes. Provides the value of the total bytes of memory that are currently available for use by the processor.
Page Reads/Sec. Rate at which the disk was read to resolve hard page faults. Hard page faults occur when a process references a page in virtual memory that is not found in the physical memory and must be read from disk.
Page Writes/Sec. Page writes/sec is the measurement of pages that are written to the disk to free up space in physical memory.
Pages/Sec. Rate in which pages are read or written to the disk to resolve hard page faults.
8.3.4.3. Disk Performance Counters
Performance issues relative to hard disks are almost always related to time, not space. Hard disks account for many of the bottlenecks that are found during performance testing. When the hard disk becomes the limiting factor in the server your application is running on, it's because the components involved with reading and writing to the disk cannot keep pace with the rest of the system.
Average Disk Queue Length. This is the average number of reads and writes that were queued for the selected disk during the sample interval.
Average Disk Read Queue Length. Average number of disk reads that were queued for the selected disk during the sample interval.
Average Disk Write Queue Length. Average number of disk writes that were queued for the selected disk during the sample interval.
Average Disk Sec/Read. Average time, reported in seconds, of average reading of data from the selected disk.
Average Disk Sec/Transfer. Time, reported in seconds, of the average transfer of data for the selected disk.
Disk Reads/Sec. Rate of disk reads on the selected disk.
Disk Writes/sec. Rate of disk writes on the selected disk.
8.3.4.4. IIS Performance Counters
When Microsoft Internet Information Services (IIS) is installed, a number of performance counters related to IIS are installed also. IIS includes performance counters for seeing how many concurrent users are hitting the site at a given time to monitor caching features.
Web Service: Bytes Total/Sec. Bytes Total/Sec reports the total number of bytes sent/received by the IIS web server. Low numbers may indicate IIS is transferring data at a low rate.
Web Service: Connection Refused. This metric will report the number of refused connections to IIS. Connections can be refused for various reasons, most commonly though, connections are refused because the server is too busy — the lower the number the better.
Web Service: Not Found Errors. Not found errors are HTTP Status Code 404 errors. Having a high number here could mean your performance test is not set up correctly, or the application under test was not installed correctly to the test servers.
8.3.4.5. ASP.NET Performance Counters
The ASP.NET Performance Counters contain a set of counters that monitor the state of ASP.NET. Many of the useful counters in this set involve information in regards to the ASP.NET requests.
Request Queued. The Request Queued metric indicates the number of requests waiting for service from the queue. When this metric starts to increment linearly with the client load, this is an indication of the web server reaching the limit of concurrent requests in which it can process.
Requests Rejected. This metric is a representation that an HTTP 503 Status Code Server is too busy. Requests are rejected due to insufficient resources on the server to process the request. During stress testing, this is a useful metric to keep your eye on.
Request Wait Time. Number of milliseconds that the most recent request waited for processing in the request queue. Requests should not wait in the queue very long. Longer wait times could indicate server performance issues.
Cache Total Turnover Rate. Count of the items added and removed from the cache per second. A large turnover number indicates caching is not being used effectively.
Errors Total. This metric is a count of the total runtime, parser, and complication errors have occurred. Expect low numbers, but this metric can be misleading. The Response.Redirect command will cause the .NET runtime to throw an error, which is caught and handled by processing the redirect. In sites that use Response.Redirect, often this number can be large.
Request Execution Time. Request Execution Time performance counter will report the last time it took for the last request to complete execution. This number should be a stable number — sharp increases or decreases could indicate performance issues.
Requests Timed Out. Total number of requests that have timed out. The most common reason that requests time out is because of insufficient resources on the server to process the request.
Requests/Sec. Total number of requests made to the IIS server per second. This number should fall into the range that was determined during the performance requirements' collection phase.
8.3.4.6. .NET Performance Counters
There are many performance counters that are included in the .NET Framework that allow you to monitor the performance of the framework and your managed code. This section will not talk about all of the counters, just the counters that are most important in regards to monitoring performance during performance testing.
8.3.4.6.1. .NET CLR Memory
One of the most useful, most hidden, most loved, and most hated feature of the .NET Framework is the automatic memory management, the Garbage Collector. Numerous books contain chapters that discuss in depth the Garbage Collection/Memory management in .NET. We are going to tip-toe through this subject and only discuss a few basics of Garbage Collection to help give you a good idea of why the following .NET CLR memory counters are important.
The Garbage Collector in .NET sorts objects into three categories known as generations. Generations are numbered 0, 1, and 2 and each generation contains a heap size, which is the total number of bytes that can be occupied by all objects in the generation. The heap sizes of generations can grow but start off around 256KB for generation 0, 2MB for generation 1, and 10MB for generation 2.
The objects contained in generation 0 are the youngest. When an application creates a new object it starts in generation 0, if there is not enough room for the object to be placed in generation 0 then Garbage Collection occurs on generation 0. During Garbage Collection, every object in the generation is examined and if it's no longer in use, it is destroyed. The objects that are not destroyed are promoted to the next generation, generation 1. If an object is too large to fit into generation 0, they are placed on a special heap known as the object heap.
During the promotion of objects from generation 0 to generation 1, the Garbage Collector ensures there is enough room to store the promoted objects in generation 1. If enough room exists then the Garbage Collector is complete. If there is not enough room in generation 1 for the objects then Garbage Collection will occur on generation 1, destroying objects that are no longer in use and promoting objects that are in use to generation 2. As with the other generations, Garbage Collection will occur in generation 2, destroying objects that are no longer in use, but generation 2 objects that are in use will stay in generation 2.
Some objects may need to store a reference to an unmanaged resource such as a mutex. In many situations, destroying those types of objects through the Garbage Collector would defeat their purpose. Developers can indicate that the Garbage Collector must cause the object to clean up after itself before it can be destroyed; this process is called finalization.
#GC Handles. This performance counter displayed the current number of Garbage Collection handlers in use. Garbage Collection handles are handles to resources outside the CLR environment. This performance counter does not update each time the Garbage Collector is called like most CLR memory counters do. This counter is updated when a GC handle is requested. When web applications are under heavy load they can create a large number of Garbage Collection handlers and possibly make the application unstable.
#Gen 0 Collections. This counter indicates the number of times generation 0 objects have been garbage collected since the start of the application. This counter is useful to help track down memory leaks and ensure that memory is being cleaned up correctly.
#Gen 1 Collections. This counter indicates the number of times generation 1 objects have been garbage collected since the start of the application.
#Gen 2 Collections. This counter indicates the number of times generation 2 objects have been garbage collected since the start of the application.
#Total Committed Bytes. This counter displays the total amount of virtual memory committed by your application.
%Time in GC. This counter displays the amount of time the Garbage Collector has spent on your application collecting memory.
Gen 0 Heap Size. Generation 0 heap is the maximum bytes that can be allocated in generation 0. Smaller heap sizes indicate the application is using memory effectively and allowing the Garbage Collector to collect unused resources.
Gen 0 Promoted Bytes/Sec. This counter displays the number of bytes promoted per second from generation 0 to generation 1.
Gen1 Heap Size. Generation 1 heap is the maximum bytes that can be allocated in generation 1.
Gen 1 Promoted Bytes/Sec. This counter displays the number of bytes promoted per second from generation 1 to generation 2.
Gen 2 Heap Size. Generation 2 heap is the maximum bytes that can be allocated in generation 2.
8.3.4.6.2. .NET CLR Loading
The performance counters included under the .NET CLR Loading counter set, include a group of counters that will enable you to have to have a detailed understanding of how system resources are affected when .NET applications are loaded.
Total Assemblies. The total number of assemblies displays a count of the total number of assemblies that have been loaded since the start of the application. This counter is useful for finding assemblies that are referenced in applications but are not used.
Total Classes Loaded. This counter displays the total number of classes that have been loaded in all the assemblies since the start of the application.
8.3.4.6.3. .NET CLR LocksAndThreads
The counters included in the .NET CLR Locks and Threads counter set, include counters that will help you track down bottlenecks related to process or thread contention.
Contention Rates/Sec. Rate at which threads in the runtime attempt to acquire a managed lock unsuccessfully.
Total #of Contentions. This counter displays the total number of times threads in the CLR have attempted to acquire a managed lock unsuccessfully.
Current Queue Length. This counter displays the total number of threads currently waiting to acquire some managed lock in the application. This counter is not an average over time; it displays the last observed value.
8.3.4.6.4. .NET CLR Exceptions
.NET exceptions are resource intensive, as such web applications that throw excessive exceptions can have performance issues. The counters contained in the .NET CLR Exceptions counter set will help monitor the number of exceptions being thrown.
# of Exceptions Thrown. This counter displays the total number of exceptions thrown since the start of the application. These include both .NET exceptions and unmanaged exceptions that get converted into .NET exceptions.
# Exceptions Thrown/Sec. This counter displays the number of exceptions thrown per second. These include both .NET exceptions and unmanaged exceptions that get converted into .NET exceptions. Exceptions should only occur in rare situations and not in the normal control flow of the program. High numbers indicate issues with the application under test.
8.3.5. Performance Analysis
When analyzing the results of a performance test, many developers/testers may find there is no clear failure during the performance test. How do you know when a performance test failed? Previously in this chapter you learned that performance testing is subjective, and results may mean different things to different people, but when page response times degrade from four seconds in your baseline test to fifteen in a future performance test, it's unacceptable and it's time to figure out what exactly is causing these issues.
To help figure out exactly what is going on you use the metrics to help narrow down problems. The performance counters that were previously discussed are a good place to start.
8.3.6. Key Performance Indicators
A good place to start analyzing data is to look at the Key Performance Indicators (KPI). KPIs are collected during the requirements gathering of the performance test. Many performance tests include the same set of KPIs such as response time, memory usage, and disk usage but may vary from application to application.
If the KPIs that have been determined are not what you expected, then it's time to start drilling to more advanced performance counters to help find out exactly what is going on.
8.3.7. Root Cause Analysis
Root Cause Analysis indentifies the underlying factors that have contributed to the performance issue, and then traces the symptoms back to the root cause of the issue which must be addressed. Root Cause Analysis is a concept not a tool, but using the KPIs is a great way to start tracing issues.
Some performance issues are obvious to some, while others require a great deal of digging to resolve the issues. Each skill set will have a set of tools (such as code profilers for developers) that will help them trace their particular issues. When analyzing the results of the performance test, ensure that you have access to the developers, testers, network administrators, database administrators, and architects to discuss possible solutions to performance issues found.
8.3.8. Performance Analysis Checklist
When analyzing the results of a performance test, it's useful to keep the following items in mind:
Did any test fail?
Was enough user load generated?
Does the application meet all performance requirements?
Are there any performance counters that are high?
Do you trust the results of the performance test?
Can you repeat the results?