
10
Advanced Protractor topics
- Protractor configuration files
- Screenshot testing
- Debugging tests
Protractor is a powerful tool, and, like any powerful tool, you can use it in more creative ways than you’ll find written in the manual. As developers working on Protractor, we’ve found that people tend to ask about certain common scenarios. Some common questions are “How do I extend Protractor’s behavior with plugins?” and “How do I create screenshots when my tests fail?” We’ve collected our best tips for working with Protractor in this chapter to help you get the most out of your end-to-end tests. You can find the examples in this chapter at http://mng.bz/83kr.
10.1 Configuration file in depth
Protractor provides many knobs and levers that change how it launches based on configuration options. In chapter 8, you used one way to run Protractor tests. You started Protractor from the command line, using a Chrome instance running on your own machine. This configuration is fine for testing during development, but what if you need to test on a different browser or a set of browsers? How can you set up tests to run in a continuous integration environment without a GUI?
10.1.1 Driver provider options
In the Protractor examples in chapter 8, you used the directConnect flag to launch Chrome with the chromedriver binary. Protractor has other ways it can launch a new browser instance to run tests. The Protractor repository refers to these WebDriver options as driver providers. You can set different driver providers in your Protractor config file using the settings listed in table 10.1.
| Setting | Comments |
directConnect | Launching a browser with directConnect is great when you’re developing your Protractor test suite because it allows you to work without having to start up a Selenium Standalone Server. Using directConnect is limited to launching tests for Chrome with the chromedriver binary and for Firefox with the geckodriver binary.You can limit your download to only these binaries by using the webdriver-manager npm package. To get these binaries, run webdriver-manager update --standalone false. Specifying —standalone false prevents webdriver-manager from downloading the Selenium Standalone Server jar file.By default, Protractor uses the binaries in the webdriver-manager npm folder. But if you need to bypass the webdriver-manager downloaded binaries, you can specify the path to your driver in the configuration file with the chromedriver and geckodriver options. |
seleniumAddress | Setting seleniumAddress will tell Protractor to start browsers using the Selenium Standalone Server. Using the Selenium Standalone Server allows you to run tests that control browsers running on a different machine. This is helpful if the machine you’re using is headless or without a desktop environment. The typical value for the seleniumAddress is 'http://127.0.0.1:4444/wd/hub' when launching the standalone server locally using the default port.Typically, you run webdriver-manager update and then launch the Selenium Standalone Server with webdriver-manager start. If you need more control over Selenium, you can launch it manually like so:java -Dwebdriver.gecko.driver=/tmp/geckodriver -Dwebdriver.chrome.driver=/tmp/chromedriver -jar /path/to/selenium-server-standalone.jar-port 4444 |
browserstackUser, browserstackKey | BrowserStack is a cloud service for Selenium testing on desktop and mobile browsers. To use BrowserStack, set the browserstackUser and browserstackKey options in the configuration file. BrowserStack is a paid service and is out of the scope of this book, but you can find more information at https://www.browserstack.com. |
sauceUser, sauceKey | Sauce Labs is another cloud service for Selenium testing on desktop and mobile browsers. Configure Sauce Labs by setting the sauceUser and sauceKey in the configuration file. Sauce Labs is another paid service and is also out of the scope of this book, but you can find more information at https://saucelabs.com/. |
seleniumServerJar | If you set seleniumServerJar or don’t set any driver providers in the config file, Protractor will start and shut down the Selenium Server for you. If seleniumServerJar isn’t defined in the configuration file, Protractor will use binaries downloaded to your project’s node_modules/webdriver-manager/selenium directory. To download the binaries, you need to run webdriver-manager update. After you have these binaries downloaded, running Protractor will also launch the Selenium Server locally.When the path to seleniumServerJar is defined in the configuration file, it will use the absolute path to launch the Selenium Server.In addition to specifying seleniumServerJar, you can specify the chromedriver path. Similarly, for tests using the Firefox browser, you could specify the geckodriver path. If you don’t set the paths for either chromedriver or geckodriver, Protractor will use the default locations specified by the locally installed webdriver-manager module. |
Note that multiple driver providers set in the same configuration file have an order of precedence. It’s the same as the order shown in table 10.1: direct connect, Selenium Standalone Server, Browser Stack, Sauce Labs, a specified seleniumServerJar file, and then, finally, local launch. In this section, we've hinted that you can use browsers other than Chrome. In the next section on capabilities, we’ll show you how to run tests against other browsers.
10.1.2 Desired capabilities
Let's say you want to test against Firefox instead of Chrome. All you need to do is change the browserName in your Protractor config, as shown in listing 10.1. You also could launch the browser using driver providers: seleniumAddress, seleniumServerJar, or the local driver option. In addition to Firefox, you can use browsers like Safari, Microsoft Edge, or Internet Explorer. Only Chrome and Firefox support directConnect, so for other browsers, you should set seleniumAddress.
Listing 10.1 Specifying capabilities for Firefox
exports.config = {
  directConnect: true,
  capabilities: {
    browserName: 'firefox'
  }
};
You can change other browser settings beyond the browser name. But if you set a desired capability that the browser driver doesn’t implement, you won’t see an error during the test. When using a browser driver, it’s important to check that you’re using capabilities that it supports.
One good use case for desired capabilities is running Chrome in headless mode, which doesn’t require a desktop UI. Headless Chrome is available in versions 59+ (60+ for Windows machines). Because you're running Chrome without a user interface, being able to log network traffic helps you validate that the test is working. With network traffic logging enabled, you might want to extend your test to track how long each JavaScript dependency takes to load. In the following listing, you set the headless chromeOption as well as loggingPrefs. When you enable performance logging in loggingPrefs to true, you’ll be able to access each browser session’s log in an afterEach method.
Listing 10.2 Configuration using headless Chrome—test_capabilities/protractor.conf.js
exports.config = {
  directConnect: true,
  capabilities: {
    browserName: 'chrome',
    chromeOptions: {
      args: ['--headless', '—disable-gpu']    ①    ②
},
loggingPrefs: { ③
performance: 'ALL',
browser: 'ALL'
}
},
baseUrl: 'https://testing-angular-applications.github.io',
specs: ['e2e/**/*.e2e-spec.ts'],
onPrepare: () => {
require('ts-node').register({
project: 'e2e'
});
},
};
After every test, you check that the browser is getting traffic and log that information to the console, as shown in the following listing.
Listing 10.3 Test using headless Chrome—test_capabilities/e2e/test.e2e-spec.ts
import { browser, by, element } from 'protractor';

describe('listing example', () => {
  it('load /', () => {
    console.log('get /')
    browser.get('/');
    expect(browser.getCurrentUrl()).toEqual(browser.baseUrl + '/');
  });

  it('click "+" button -> /add', () => {
    console.log('click "+" button -> /add')
    element(by.id('add-contact')).click();
    expect(browser.getCurrentUrl()).toEqual (browser.baseUrl + 'add');
  });

  afterEach(() => {    ①
    browser.manage().logs().get('performance').then((browserLogs) => {
      expect(browserLogs).not.toBeNull();    ②
      browserLogs.forEach((browserLog) => {
        let message = JSON.parse(browserLog.message).message;
        if (message.method == 'Network.responseReceived') {
          if (message.params.response.timing) {    ③
            let status = message.params.response.status;
            let url = message.params.response.url;
            console.log('status=' + status + ' ' + url);
          }
        }
      });
    });
  });
});
Instead of using a single set of capabilities to launch a browser, what if you want to run the exact same test against other browsers? To launch against multiple browsers, you’ll need to use multiCapabilities. You can specify multiCapabilities as an array of desired capabilities, as shown in the following listing. Using multiple capabilities requires running against a Selenium Server, so you need to set the seleniumAddress in the configuration file.
Listing 10.4 Multicapabilities—test_multicapabilities/protractor-chrome.conf.js
exports.config = {
  multiCapabilities: [ {
    browserName: 'chrome'    ①
  }, {
    browserName: 'firefox'    ①
  } ],
  seleniumAddress: 'http://127.0.0.1:4444/wd/hub',
  baseUrl: 'https://testing-angular-applications.github.io',
  specs: ['e2e/**/*.e2e-spec.ts'],
  onPrepare: () => {
    require('ts-node').register({
      project: 'e2e'
    });
  }
};
The main reason to run tests over a set of browsers is to make sure your app is compatible with those browsers. For example, imagine some of your users have noticed navigation issues with a particular feature when they use Microsoft Edge. You might want to use a subset of tests to validate this feature with both Chrome and Microsoft Edge browsers.
It’s also important to consider how many tests to run in parallel browsers. If you run your tests with multiple browsers, you could run into CPU- or RAM-resource limitations.
10.1.3 Plugins
Protractor allows you to use lifecycle hooks during test execution. (See chapter 7, section 7.1, for how to use them with Angular.) Lifecycle hooks let you insert custom functionality that executes at different points when you’re executing a test. Some lifecycle hooks can gather test results or modify the test output. Protractor lets you use these lifecycle hooks by adding plugins to the configuration file. One such lifecycle hook is onPrepare, which is called after the test framework has been set up but before tests are run. In chapter 8, you specified an onPrepare function in your config file so you could load TypeScript spec files using the ts-node npm package. This lifecycle hook is unique in that you can specify it both as a config option and as part of a plugin.
Another good reason to use the onPrepare lifecycle hook is to create custom report artifacts. A typical report artifact is an xUnit report, which is a test report format defined in the JUnit test framework. To create JUnit-style test reports, you’ll need to override Jasmine's reporter with the jasmine-reporters node module shown in the following listing.
Listing 10.5 JUnit-style reports using onPrepare function
exports.config = {
  directConnect: true,
  capabilities: {
    browserName: 'chrome'
  },
  baseUrl: 'https://testing-angular-applications.github.io',
  specs: ['e2e/**/*.e2e-spec.ts'],
  onPrepare: () => {
    let jasmineReporters = require('jasmine-reporters');
    let junitReporter = new jasmineReporters.JUnitXmlReporter({

      savePath: 'output/',    ①
      consolidateAll: false    ②

    });
    jasmine.getEnv().addReporter(junitReporter);    ③
    require('ts-node').register({
      project: 'e2e'
    });
  },
};
You also could define this lifecycle hook as part of a plugin definition. This setting takes an array of objects with each object defining a plugin. The following listing shows the same example as in listing 10.5 but this time using a plugin configuration.
Listing 10.6 JUnit-style reports using plugins configuration setting
exports.config = {
  directConnect: true,
  capabilities: {
    browserName: 'chrome'
  },
  baseUrl: 'https://testing-angular-applications.github.io',
  specs: ['e2e/**/*.e2e-spec.ts'],
  plugins: [{
    inline: {
      onPrepare: () => {
        let jasmineReporters = require('jasmine-reporters');
        let junitReporter = new jasmineReporters.JUnitXmlReporter({
          savePath: 'output/',
          consolidateAll: false
        });
        jasmine.getEnv().addReporter(junitReporter);
        require('ts-node').register({
          project: 'e2e'
        });
      }
    }
  }],
};
Why use one or the other? Plugins can define more lifecycle hooks than just onPrepare (table 10.2). Defining multiple hooks in the same plugin allows you to share variables between them. You also don’t have to define plugins in your config file—you can import them in a separate JS file and share them between multiple projects. All of these lifecycle hooks can return a promise—if they do, Protractor will wait for that promise to be resolved before proceeding.
| Lifecycle hook | When it’s called |
setup | After the WebDriver session has started, but before Jasmine is set up. |
onPrepare | After Jasmine is set up. |
teardown | After tests have run, but before the WebDriver session is stopped. |
postTest | After each it() block completes. |
onPageLoad | After the page loads, but before Angular bootstraps. |
onPageStable | After the page has loaded and Angular is ready and stable. |
waitForPromise | After every WebDriver command. You can use this hook to change how Protractor waits for Angular to be stable. |
Until now, all your tests have run on a single machine, but you might need to change the behavior depending on your testing environment. In some situations, for example, you might not want to create JUnit-style reports using plugins. In the next section, we’ll look in depth at how to set environment-specific configurations.
10.1.4 Environment variables
In previous sections, you created configuration files with different options. For example, you might have Chrome installed on one machine and Firefox on another. Or in some environments, you might need to produce JUnit-style reports, whereas in others you might not want to have reports generated.
How can you change Protractor’s behavior based on the environment in these use cases? One way is by setting environment variables. In listing 10.7, you set environment variables to determine which browser the test will use, and whether to use directConnect or Selenium Standalone Server. Remember that if you set DIRECT_CONNECT to true, as in the following listing, and SELENIUM_ADDRESS to http://127.0.0.1:4444/wd/hub, the test will launch with directConnect based on how Protractor handles these driver providers.
Listing 10.7 Setting environment variables
export BROWSER_NAME='chrome'
export DIRECT_CONNECT=true    ①
export SELENIUM_ADDRESS=''    ②
Now that you’ve exported the environment variables, you can modify the Protractor configuration file to change behavior based on them. In listing 10.8, you set directConnect and seleniumAddress based on environment variables Node.js makes available in process.env. If you don’t define process.env.DIRECT_CONNECT and process.env.SELENIUM_ADDRESS, Protractor will launch the Selenium Standalone Server using a local driver. When you set the browserName, if you don’t set process.env.BROWSER_NAME, Protractor will default to using Chrome.
Listing 10.8 Using environment variables—test_environment/protractor.conf.js
exports.config = {
  directConnect: process.env.DIRECT_CONNECT,    ①
  seleniumAddress: process.env.SELENIUM_ADDRESS,    ②
  capabilities: {
    browserName: (process.env.BROWSER_NAME || 'chrome')    ③
  },
  baseUrl: 'https://testing-angular-applications.github.io',
  specs: ['e2e/**/*.e2e-spec.ts'],
  onPrepare: () => {
    if (process.env.BROWSER_NAME == 'chrome') {    ④
      let jasmineReporters = require('jasmine-reporters');
      let junitReporter = new jasmineReporters.JUnitXmlReporter({
        savePath: 'output/',
        consolidateAll: false
      });
      jasmine.getEnv().addReporter(junitReporter);
    }
    require('ts-node').register({
      project: 'e2e'
    });
  },
};
Instead of setting environment variables, you also can create separate Protractor configuration files. Although having multiple Protractor configuration files for each environment might be an easy solution, it requires maintenance if you need to make a change that affects all the configuration files.
Now that you know how to configure Protractor in depth, let’s use this knowledge to create a new kind of test. In the next section, you’ll create a custom plugin and config that will let you compare browser screenshots in your tests.
10.2 Screenshot testing
You write tests to prevent your mistakes from becoming user-facing issues. Up until now, you’ve been testing only the logic of your application. But the appearance of your web app is also important. One way to verify that the appearance of your app is correct is to have a test that fails when a screenshot changes.
You might think that such a test would be fragile, and you’d be right. This test will fail whenever the look of your app changes, intentionally or not. But it’s a useful safeguard to catch unintentional CSS regressions, which can be easy to introduce and hard to check. After all, who wants to spend all day before a release clicking through each page in your app, verifying that no awkward CSS errors have slipped through? This test will guard against unintentional style errors, but the price is that you need to update it whenever you intentionally change your app’s CSS.
10.2.1 Taking screenshots
Taking screenshots in Protractor is easy; you can call browser.takeScreenshot() to take a screenshot. Unlike the other WebDriver commands you’ve seen so far, takeScreenshot() returns a promise. As mentioned in earlier chapters, a promise represents the future value of an asynchronous operation. The important thing to know is that to get the screenshot image, you need to call .then() on the result of takeScreenshot() and pass it a function that does something with the data. The following listing is an example of taking a screenshot in a test.
Listing 10.9 test_screenshot/e2e/screenshot.e2e-spec.ts
describe('the contact list', () => {
  beforeAll(() => {
    browser.get('/');
    browser.driver.manage().window().setSize(1024,900);    ①
  });

  it('should be able to login', (done) => {
    const list = element(by.css('app-contact-list'));
    browser.waitForAngular();    ③

    browser.takeScreenshot().then((data) => {
      fs.writeFileSync('screenshot.png', data, 'base64');
      done();    ④
    })
  });
});
Also unlike other WebDriver commands, Protractor won’t automatically wait for Angular before executing takeScreenshot()—it’ll take a screenshot immediately, which is useful when using screenshots for debugging. If you want to take the screenshot after Angular is done updating the page, you’ll have to manually call browser.waitForAngular().
This test is different from the previous Protractor tests in a couple of ways. As mentioned, the takeScreenshot() command returns a promise. In fact, all WebDriver commands return promises, but Protractor has some hidden magic that lets you ignore that and write your tests as if they were synchronous.
The other important difference is that the test is now asynchronous; it needs to wait until Node.js has written the screenshot to disk before finishing. You can make any Jasmine test asynchronous by accepting a 'done' callback in the function you define for your it() block. Jasmine will wait until you execute that callback before finishing the test. This allows you to write tests with asynchronous behavior, like calling setTimeout() or making network calls—or, in this case, waiting for the screenshot data.
10.2.2 Taking screenshots on test failure
Previously, you saw how you can use plugins to extend Protractor’s behavior. The plugin API provides hooks that you can use to add custom logic to your Protractor tests. Next you’ll use the plugin API to take a screenshot of the browser when a test fails. First, you can add a plugin to your test’s config by adding a plugin section, like this:
plugins: [{
  path: './screenshot_on_failure_plugin.ts'
}],
This loads the plugin, which you define in a separate TypeScript file. Protractor calls the plugin’s lifecycle hooks at different points in the test process. In your case, you need to define a postTest() function, as shown in listing 10.10. Protractor calls the postTest() function after each it() block finishes. The function receives two arguments—whether the test passed and an object containing a description of the test. If the test fails, you take a screenshot and save it to a file based on the name of the test that failed. This produces a screenshot at the moment of failure for each failing test in your test suite.
Listing 10.10 test_screenshot/screenshot_on_failure_plugin.ts
import {browser} from 'protractor';
import * as fs from 'fs';

export function postTest(passed: boolean, testInfo: any) {    ①
  if(!passed) {
    const fileName = `${testInfo.name.replace(/ /g, '_')}_failure.png`    ②
    return browser.takeScreenshot().then((data) => {
      fs.writeFileSync(fileName, data, 'base64')    ③
    });
  }
}
You can find this plugin and config file in the Chapter 10 code repo on GitHub (http://mng.bz/0OPs). Try it for yourself—make a failing test and verify that you get a screenshot of the browser at the time of failure. If you want to learn more about writing plugins, check out the official docs in the Protractor repo (http://mng.bz/bSLE). This simple plugin will help debug why a test failed, but you also can use screenshots as part of your tests, as you’ll see in the next section.
10.2.3 Comparing screenshots
It can be hard to make an automated test that verifies how an application looks. But you can make a simple screenshot test that will fail when any major, unintended changes show up in your application’s appearance. You can use the looks-same npm package to compare a screenshot of the browser against a reference image.
Listing 10.11 shows a couple of helper functions that use the looks-same library to compare a screenshot to a reference image. The writeScreenshot() function encapsulates some of the boilerplate around writing a screenshot to disk. The compareScreenshot() function takes the callback-oriented API of looks-same and wraps it in a promise that’s resolved with the value of the screenshot comparison.
Listing 10.11 test_screenshot/e2e/screenshot_helper.ts
function writeScreenshot(data) {    ①
  return new Promise<string>(function (resolve, reject) {
    const folder = fs.mkdtempSync(`${os.tmpdir()}${path.sep}`);
    let screenshotFile = path.join(folder, 'new.png');
    fs.writeFile(screenshotFile, data, 'base64', function (err) {
      if (err) {
        reject(err);
      }
      resolve(screenshotFile);
    });
  });
}

export function compareScreenshot(data, golden) {
  return new Promise((resolve, reject) => {
    return writeScreenshot(data).then((screenshotPath) => {
      if (process.env['UPDATE_SCREENSHOTS']) {    ②
        fs.writeFileSync(golden, fs.readFileSync(screenshotPath));
        resolve(true);
      } else {
        looksSame(screenshotPath, golden, {}, (error, equal) => {
          if (!equal) {
            looksSame.createDiff({    ③
              reference: golden,
              current: screenshotPath,
              diff: 'diff.png',    ④
              highlightColor: '#ff00ff'
            }, function (error) {
              resolve(equal);
            });
          } else {
            resolve(equal);
          }
        })
      }
    });
  });
}
The compareScreenshot() helper has a couple of useful features. First, you can easily update the golden image if you set the environment variable UPDATE_SCREENSHOTS. For example, if you run your tests with UPDATE_SCREENSHOTS=1 protractor screenshot_test.conf.js, the test will run, but instead of comparing the screenshot to the reference, it overwrites the reference image with the new screenshot. You can then commit the updated reference images in your git repo. It’s helpful to keep these screenshots in version control along with your source code so you can track how they change.
If the images are different, compareScreenshot() automatically calls looksSame.createDiff(). This creates an image showing the difference between the current screenshot and the reference image so you can easily see what went wrong.
Listing 10.12 shows a test that uses these helpers. Note that in the test you need to explicitly call browser.waitForAngular(). Usually, when you turn on waiting for Angular with browser.waitForAngularEnabled(true), Protractor waits for Angular to be ready before executing each WebDriver command. But screenshots are taken immediately, so you’ll need to manually wait for the contact list to load.
Listing 10.12 An example screenshot test
  it('should be able to login', (done) => {
    const GOLDEN_IMG = path.join(__dirname,'contact_list_golden.png');    ①
    const list = element(by.css('app-contact-list'));
    browser.waitForAngular();

    browser.takeScreenshot()
      .then((data) => {
        return compareScreenshot(data, GOLDEN_IMG);    ②
      })
      .then((result) => {
        expect(result).toBeTruthy();    ③
        done();
      })
  });
You call then() on a promise to handle the result—the callback you pass to then() will be invoked when the asynchronous operations the promise represents finish. If, when handling the result of a promise, you need to make a new asynchronous call, you can return a promise and add another then() block. This is called promise chaining because you chain your then() blocks together, one per asynchronous operation. In listing 10.12, you chain together two asynchronous operations—taking the screenshot and comparing the screenshot to the reference—so you have two then() blocks.
Let’s look at an example showing screenshots. Say your contacts list looks like figure 10.1.

Figure 10.1 The reference screenshot image
Suppose you accidentally broke your application’s CSS by adding the following to contact-list.component.css:
.add-fab {
  float: right;
  cursor: pointer;
  position: absolute;
}
Now the list looks like figure 10.2.
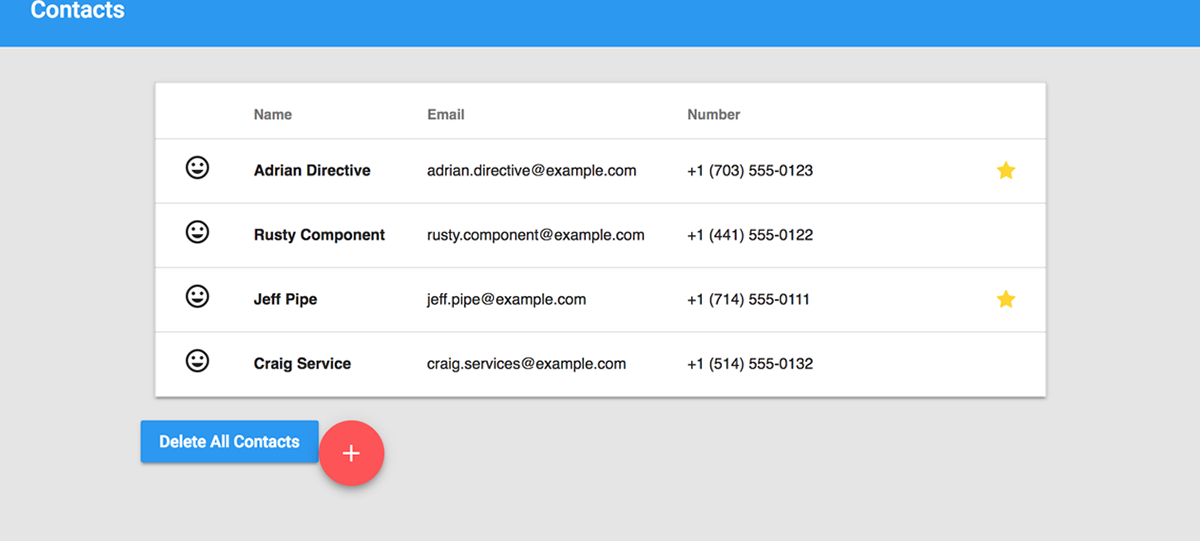
Figure 10.2 The contact list with broken CSS
Your tests might still pass, despite the page being obviously broken. But your screenshot test will fail and produce the diff image in figure 10.3.
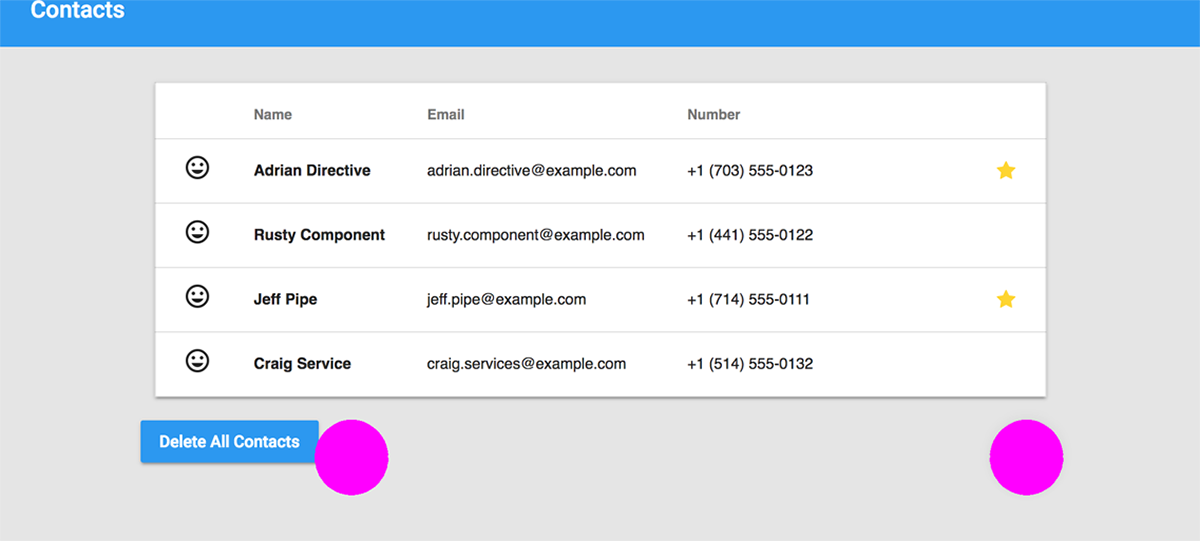
Figure 10.3 The difference image highlighting where the current screenshot differs from the reference
Notice how the diff image highlights the part of the screenshot that changed. You can change the highlight color if pink isn’t your thing. The important part is that when your screenshot test fails, you can check the diff image to see what went wrong. If the change is expected, you can rerun the test with UPDATE_SCREENSHOTS=1 to update the reference image.
10.3 Experimental debugging features
It can be hard to know what might have caused a Protractor test to fail. Fortunately, some experimental features recently added to Protractor can make it easier to debug failing tests. In this section, you’ll use these new features to debug a test in the chapter10/test_experimental directory of the book’s repository (which, as mentioned, you can find at http://mng.bz/z22f).
The following listing shows the test you’ll be working with in this section.
Listing 10.13 test_experimental/e2e/add-contact.e2e-spec.ts
import {browser, by, element, ExpectedConditions as EC} from 'protractor';

describe('contact list', () => {
  beforeAll(() => {
    browser.get('/');
  });

  it('should be able to add a contact', () => {
    element(by.id('add-contact')).click();    ①

    element(by.id('contact-name')).sendKeys('Ada Contact');    ②
    element(by.css('.create-button')).click();    ②

    expect(element(by.css('app-contact-list')).getText())    ③
            .toContain('Ada Contact');    ③
  });
});
This is a simple test, but because it moves between two different pages (the contact list and the add contact view), it can be a little difficult to debug when things go wrong. Let’s look at some tools to help with that.
10.3.1 WebDriver logs
When a Protractor test runs, it sends commands to the browser telling it what to do. These are commands like find an element, click an element, or get the text of an element. Even if you watch the browser as your test runs, it can be hard to know exactly what’s going on. Instead, you can have Protractor create a log of the WebDriver commands it sends using the –webDriverLogDir option.
This option specifies a directory where Protractor will create a log of the WebDriver commands it sends during a test run. Protractor will name each log file webdriver_log_<sessionId>.txt, with a different sessionId for each test run. Each line of the log file shows when the command was sent, how long it took, and what the command was. It looks like figure 10.4.

Figure 10.4 The structure of a WebDriver log line
Now run your add contact test with WebDriver logging. Unlike the other examples so far, logging WebDriver commands requires running a Selenium Server. (We’ll explain why in a bit, don’t worry.) To run the test in chapter10/test_experimental and generate a WebDriver log, first start a Selenium Server:
webdriver-manager start
Then, in another terminal, start the test like so:
protractor –-webDriverLogDir ./
After the test runs, Protractor will create a log of WebDriver commands in the current directory. The entire log is a bit long, but the following listing shows a sample of the end of the log after running the example test.
Listing 10.14 Excerpt from WebDriver log
01:45:06.984 |  520ms | 26ac2a | Waiting for Angular    ①
01:45:06.984 |   14ms | 26ac2a | FindElements    ①
  Using css selector '*[id="contact-name"]'
  Elements: 0.21665478589924247-2
01:45:07.009 |    9ms | 26ac2a | Waiting for Angular    ①
01:45:07.009 |  131ms | 26ac2a | ElementSendKeys (0.21665478589924247-2)
  Send: Ada Contact    ①
01:45:07.165 |   23ms | 26ac2a | Waiting for Angular
01:45:07.166 |   18ms | 26ac2a | FindElements    ②
  Using css selector '.create-button'    ②
  Elements: 0.21665478589924247-3    ②
01:45:07.194 |    8ms | 26ac2a | Waiting for Angular
01:45:07.194 |   81ms | 26ac2a | ElementClick (0.21665478589924247-3)
01:45:08.306 |   1028ms | 26ac2a | Waiting for Angular    ③
01:45:08.306 |   15ms | 26ac2a | FindElements    ④
  Using css selector 'app-contact-list'    ④
  Elements: 0.21665478589924247-4    ④
01:45:08.331 |    9ms | 26ac2a | Waiting for Angular    ④
01:45:08.331 |   47ms | 26ac2a | GetElementText (0.21665478589924247-4)    ④
  Name Email Number
mood Adrian Directive [email protected] +1 (703) 555-0123 edit ➥delete
mood Rusty Component [email protected] +1 (441) 555-0122 edit ➥delete
mood Jeff Pipe [email protected] +1 (714) 555-0111 edit delete
mood Craig Service [email protected] +1 (514) 555-0132 edit delete
mood Ada Contact edit delete

Delete All Contacts
add
01:45:08.388 |   54ms | 26ac2a | DeleteSession
You might have noticed all the Waiting for Angular log lines. What do they mean? Remember from chapter 9 that Protractor waits for Angular to be stable before sending a WebDriver command—every time it does so, it adds Waiting for Angular to the log. The log also shows the amount of time that each step takes to complete—you can see that after clicking the Create button, Protractor waits for Angular for 1028 ms while the contact list loads.
The WebDriver log is handy for knowing after the fact what happened in a test, but sometimes it would be nice to be able to watch the browser while the test runs. Usually, the test runs too quickly for you to see what’s happening, but you can slow it down using highlight delay.
10.3.2 Highlight delay
When Protractor tests run, they execute WebDriver commands as fast as possible. If you’ve ever tried to debug a Protractor test by watching the browser window, you’ve seen what this looks like. Buttons are clicked so fast, it’s as if the browser is being controlled by a hyperactive poltergeist. It’s normally impossible to follow what’s happening.
You can fix this with the –highlightDelay flag. This tells Protractor to add a delay, specified in milliseconds, before sending WebDriver commands to the browser. Protractor also will highlight the element it’s about to touch with a light blue rectangle, so you can tell which element is about to be clicked. For example, if the test is about to enter text in a field, first it’ll highlight the text field with a blue rectangle (figure 10.5), then it’ll wait the specified delay time before proceeding.

Figure 10.5 Protractor highlights the name input field before entering a name.
Adding a highlight delay can be a quick and easy way to see what’s going on during a Protractor test. You can slow things down as much as you like, and the highlight lets you know which part of the page Protractor will touch next.
10.3.3 Blocking proxy
A new component in Protractor called blocking proxy makes experimental new features like highlight delay and WebDriver logs possible. This proxy sits between your test and the browser driver. This proxy can intercept and optionally delay any command that your test sends to the browser. As a result, it can create a log of commands or delay them.
One benefit of having this functionality in a proxy is that you can use it with any WebDriver test. This means you don’t have to be using Protractor to use it—even if you have WebDriver tests written in Java or Python, you could still use blocking proxy to add a highlight delay to your tests. It even implements the same waitForAngular logic that Protractor uses. If you don’t feel like writing your tests in TypeScript and running them on Node.js, you could write them in any language that WebDriver supports and use blocking proxy to get the same waitForAngular behavior as Protractor.
Blocking proxy is still an experimental feature in Protractor. If you’d like to learn more about it or use it in other projects, check it out at https://github.com/angular/blocking-proxy.
10.4 The control flow and debugging with Chrome DevTools
Debugging a failing Protractor test can be frustrating, mainly because there’s no obvious way to step through the test and see what it’s doing. Fortunately, recent changes to WebDriver, Node.js, and Protractor can make debugging Protractor tests as easy as debugging any traditional application. To better understand how important these changes are, and why Protractor tests are difficult to debug, you need to understand asynchronous programming in JavaScript, specifically how the async/await feature added in ES2017 makes asynchronous programming easier.
If you’re already familiar with asynchronous programming in JavaScript, feel free to skip to the last section, where you’ll see how easy it is to step through Protractor tests using Chrome DevTools.
10.4.1 Asynchronous functions and promises
In a language with threads, like Java or C#, you can write code that will block until an I/O operation (reading from the file system, sending data over the network, and so on) finishes. But in JavaScript, when you have an I/O operation, you typically pass a callback that will be invoked when the operation finishes.
Let’s imagine a simple function that makes two API calls and writes some result to disk based on the responses. In Java, your imaginary function might look something like the following:
responseA = callServiceA();
responseB = callServiceB(responseA);
resultFile = writeResponseData(responseB);
doSomethingWithResult(resultFile);
Each function blocks until it finishes, running line by line in an imperative (or some might say synchronous) manner. In JavaScript, you can’t make blocking calls; instead, you pass a callback that will be invoked when the function is done. The preceding imaginary example might look like the following in JavaScript:
callServiceA((responseA) => {
  callServiceB(responseA, (responseB) => {
    writeResponse(responseB, (resultFile) => {
      doSomethingWithResult(resultFile);
    })
  })
})
Depending on when the JavaScript runtime invokes your callbacks, your code may not execute the same way it reads. Asynchronous programming is kind of like being a time traveler; things don’t necessarily happen in the order you expect. This can be confusing for people learning about callbacks for the first time.
For the code in listing 10.15, the first line that prints something to the console is the last line in the listing. The order in which the callbacks are invoked and printed to the console depends on when the different setTimeout calls are scheduled. This code may not necessarily run in the same order you see when reading it from top to bottom.
Listing 10.15 Asynchronous program flow example
setTimeout(() => {
  console.log('Event C');    ③
},1000);

setTimeout(() => {
  console.log('Event B');    ②
  setTimeout(() => {
    console.log('Event D');    ④
  },1000);
},500);

console.log('Event A');    ①
Having to pass a callback every time you want to do something with the result of an asynchronous call can lead to the pyramid of doom; a long list of nested callbacks can end up yielding deeply indented code that’s hard to read. One fix for this is to use promises. Instead of passing a callback to be invoked when the operation is done, you can return a promise that eventually will resolve to the result of the operation. The result is much easier to read:
callServiceA().then((responseA) => {
  return callServiceB(responseA)
}).then((responseB) => {
  return writeResponse(responseB)
}).then((resultFile) => {
  doSomethingWithResult(resultFile);
});
The WebDriver commands in Protractor tests are asynchronous calls; your test is making an API call to Selenium to send the command to the browser. But you normally can write Protractor tests without worrying about callbacks and promises, thanks to a helpful feature of WebDriver called the control flow.
10.4.2 The WebDriver control flow
Most of the tests you’ve written so far seem to be synchronous, even though they execute WebDriver commands. How is this possible? The trick is that WebDriver commands return a special kind of promise (called a managed promise) that’s executed later. Unlike a normal promise, a managed promise doesn’t run an asynchronous task. Instead, it schedules a command to run on Webdriver’s control flow. At the end of your test, the control flow runs, and all the scheduled browser commands execute. As a result, you can write your tests as if you were writing asynchronous code, without worrying about promises. The following listing shows how you might write a test relying on managed promises.
Listing 10.16 Test using control flow
  it('should open the dialog with waitForAngular', () => {
    let feedButton = element(by.css('button.feed-button'));
    let closeButton = element(by.css('button[mat-dialog-close]'));
    let dialogTitle =
        element(by.css('app-contact-feed h2.mat-dialog-title'));

    feedButton.click();    ①
    expect(dialogTitle.getText())
        .toContain('Latest posts from Craig Service');
    debugger;    ②

    closeButton.click();
    browser.wait(EC.stalenessOf(dialogTitle), 3000,
        'Waiting for dialog to close');
    expect(dialogTitle.isPresent()).toBeFalsy();
  });    ③
Unfortunately, using the control flow prevents you from debugging Protractor tests with standard Node.js tools. If you’ve ever used the debugger keyword in a Protractor test, you’ve seen this. When the debugger hits the breakpoint, the browser isn’t executing commands; instead, the test synchronously defines a list of commands to run (the control flow). As a result, in listing 10.16, when you hit the debugger breakpoint, the Feed button hasn’t actually been clicked yet. Instead, Protractor automatically runs those commands after each it() block, which is why you don’t see the commands running if you set a breakpoint in your test.
You don’t have to use the control flow. You also can treat managed promises as if they were regular promises. You can schedule callbacks to run when the command is executed using .then(), as in the following listing.
Listing 10.17 Explicitly using WebDriver promises
  it('should open the dialog with waitForAngular', (done) => {
    let feedButton = element(by.css('button.feed-button'));
    let closeButton = element(by.css('button[mat-dialog-close]'));
    let dialogTitle =
        element(by.css('app-contact-feed h2.mat-dialog-title'));

    return feedButton.click().then(() => {
      return dialogTitle.getText();
    }).then((dialogText) => {
      expect(dialogText).toContain('Latest posts from Craig Service');
      debugger;    ①
      return closeButton.click();
    }).then(() => {
      return browser.wait(EC.stalenessOf(dialogTitle), 3000,
          'Waiting for dialog to close');
    }).then(() => {
      return dialogTitle.isPresent();
    }).then((dialogTitleIsPresent) => {
      expect(dialogTitleIsPresent).toBeFalsy();
      done();
    });
Notice that any interaction at all with the browser is an asynchronous action—this includes clicking buttons, getting text, waiting on expected conditions, or waiting for elements to be present. Without the control flow, you’ll need to chain all of these promises; otherwise, the browser actions won’t run in a defined order. Also, because the test is now asynchronous, you need to call done() to signal to Jasmine that it’s done. Because you’re not using the control flow in listing 10.17, the debugger breakpoint works as expected—when you hit it, the Feed button has been clicked.
Even though the tests in listings 10.16 and 10.17 do the same thing, the test that uses the control flow (in listing 10.16) is much easier to read. You can see why the authors of Selenium WebDriver added the control flow. But the new async/await feature coming to JavaScript (and available in Node v8) makes asynchronous code that uses the feature much more readable than code that uses promises. That’s why the Selenium team has decided to deprecate the control flow (see GitHub issue: https://github.com/SeleniumHQ/selenium/issues/2969), and why they won’t use the control flow in Selenium 4.x and greater. When using these versions of Selenium, you’ll no longer be able to write tests as in listing 10.16. Instead, you’ll need to explicitly write asynchronous tests. But without the control flow, your tests also will be much easier to debug.
10.4.3 The future: async/await
The async and await keywords are a new addition to JavaScript that makes asynchronous code much more readable. The details of async/await are beyond the scope of this book. All you need to know is that it’s a special syntax that makes waiting on promises easier.
You can disable the WebDriver control flow by adding SELENIUM_PROMISE_MANAGER: false to your Protractor config. As of Selenium 4.x, running without the control flow will be the only option, but setting this flag gives you a way to get your tests ready for control flow deprecation. Using async/await, you can rewrite the test from the example, as shown in the following listing, to be much more readable, even though it doesn’t use the control flow.
Listing 10.18 Test using async/await
  it('should open the dialog with waitForAngular', async () => {    ①
    let feedButton = element(by.css('button.feed-button'));
    let closeButton = element(by.css('button[mat-dialog-close]'));
    let dialogTitle =
        element(by.css('app-contact-feed h2.mat-dialog-title'));

    await feedButton.click();
    let dialogText = await dialogTitle.getText();    ②
    expect(dialogText).toContain('Latest posts from Craig Service');
    debugger;    ③

    await closeButton.click();
    await browser.wait(EC.stalenessOf(dialogTitle), 3000,
        'Waiting for dialog to close');
    let dialogTitleIsPresent = await dialogTitle.isPresent();
    expect(dialogTitleIsPresent).toBeFalsy();
  });
In listing 10.18, you declare the body of your test to be async. This lets you wait for and get the results of each promise using await. Adding a breakpoint with debugger works as it did in listing 10.17 with promise chaining. Also, because your test body is async, Jasmine knows to wait for it—there’s no need to explicitly call done(). Notice how using async/await makes your test much more readable, compared to waiting on promises using .then(). That’s why the Selenium team feels comfortable removing the control flow in Selenium 4.x—JavaScript has finally evolved to the point where writing asynchronous code is easy. Disabling the control flow lets you do something that hasn’t been possible until now—debug your tests using the Chrome Inspector!
10.4.4 Using Chrome DevTools
Node.js v6 added the ability to debug Node.js programs using Chrome DevTools. The test in listing 10.18 has a debugger statement to set a breakpoint right before the Close button is clicked. You can debug your test by starting Protractor with the following command:
node --inspect --debug-brk
  ./node_modules/protractor/bin/protractor  ./debugging_test.conf.js
If you start Protractor with Node.js debugging enabled, you’ll see something like figure 10.6.

Figure 10.6 Starting Protractor with debugging enabled
In Chrome 60 or later, you can debug Node.js programs by opening about://inspect. Any Node.js programs ready for debugging will automatically appear in a list. Figure 10.7 shows what this looks like.

Figure 10.7 Opening DevTools in Chrome
If you select Open Dedicated DevTools for Node, you’ll get a debugger attached to your Protractor test. You can step through to the breakpoint you set with the debugger statement. Figure 10.8 shows what this debugger looks like.
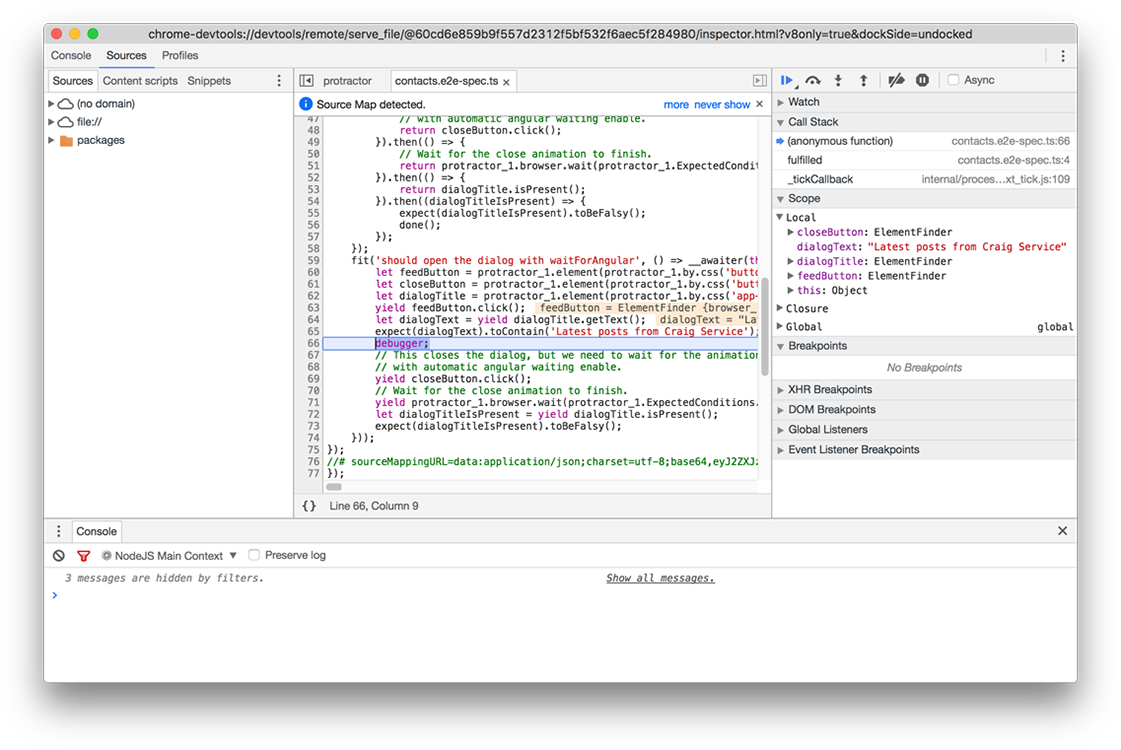
Figure 10.8 Debugging a Protractor test with the Chrome Inspector
If you have some experience writing Protractor tests, you might have seen old debugging tools like ElementExplorer or browser.pause(). These tools were necessary when WebDriver’s control flow prevented debugging a Protractor test like a normal Node.js program. But now that the Selenium team has deprecated the control flow, you can use the much more powerful Chrome DevTools and throw away the old tools.
Summary
- You can pass command-line flags to the browser using the capabilities section of your Protractor config. For example, you can pass
'--headless'to Chrome to start it in headless mode. - Plugins let you add features to Protractor, like changing how test results are reported or taking screenshots on test failure.
- Protractor can take screenshots of your application during a test, and you can use them to create tests that verify if your application web interface looks right.
- New Protractor features like
highlightDelayandwebDriverLogDirmake it easier to understand what your test is doing as it runs. - The WebDriver control flow is deprecated and won’t be in Selenium 4.x, so you should start using
async/awaitin your tests. - It’s easy to debug tests using Chrome DevTools.