
|
|
Chapter 12
|

Some people try to find things in this game that don't exist but football is only two things – blocking and tackling.
Vince Lombardi
In Chapter 11, you gained an overall appreciation for Extract, Transform, and Load (ETL). You learned how data is loaded into the data mart so that it can be accessed for BI Operations. This chapter is organized into two sections:
• Section 12A – Business Intelligence Operations
• Section 12B – Business Intelligence Tools
Section 12A – Business Intelligence Operations
After studying section you will be able to:
• Discuss applications that slice, dice, drill down, and roll up
• Document data exploration requirements
• Link data mart design to supported operations.
BI operations enable exploration and understanding of data. The BI operations slice, dice, drill down, roll up and pivot are summarized in Table 12-01.
Table 12-01: BI Operation Summary
|
Technique |
Action |
Description |
|
Slice |
Query a specific set of dimensions. |
Focus analysis by specifying values for one or more dimensions. |
|
Dice (like Pivot) |
Present data from a different perspective. |
Change the dimensions used in a query. |
|
Drill-down |
Seek the detailed data that supports summarized data. |
Shift analysis from an aggregated level to a detailed level. |
|
Roll-up |
View data about the current level of detail that is summarized. |
Zoom out from a detailed level to an aggregated level. |
|
Pivot (like Dice) |
Present data from a different perspective. |
Change the dimensions used in a query. |
Slice and Dice
Slice and dice are data warehousing operations that enable analysts to gain perspectives on the data stored in star schemas and cubes. The very words “slice and dice” give a picture of analyzing data from many levels and perspectives. Figure 12-01 provides an example of a cube with dimensions of location, product, and time.
Figure 12-01: Slice and Dice Operates on Cubes

Slicing is an operation used to analyze dimensional data where the number of dimensions is reduced in order to focus on a single area. In Figure 12-01 slicing could be performed by examining product sales over time, not considering the location dimension.
Dicing is another kind of analytic operation. Dicing is used to analyze dimension data by which the cube is rotated by looking at different dimensions to provide a different perspective.
Roll Up
The Roll Up analytical operation is performed by navigating up a dimensional hierarchy to a more summarized level. The data is aggregated by removing one or more dimensions or hierarchy levels. In other words, data is summarized.
Figure 12-02 shows a roll up example. In this case, web site visits are rolled up from the monthly level to the quarterly level. In the date hierarchy, quarters are at a higher level than months and contain months.
There are many possibilities for roll ups. For example, in a Geographic roll up, totals could be rolled up from city, to state, to region, to country. Organizational units such as team, department, division, and business unit are often rolled up.
Roll ups are useful for trend analysis and performance analysis. A roll up by product line along a time dimension can show trends in customer product preferences. A roll up by business responsibility area can identify performance “all stars”, as well as those who may need help in reaching objectives.
Figure 12-02: Roll Up Example

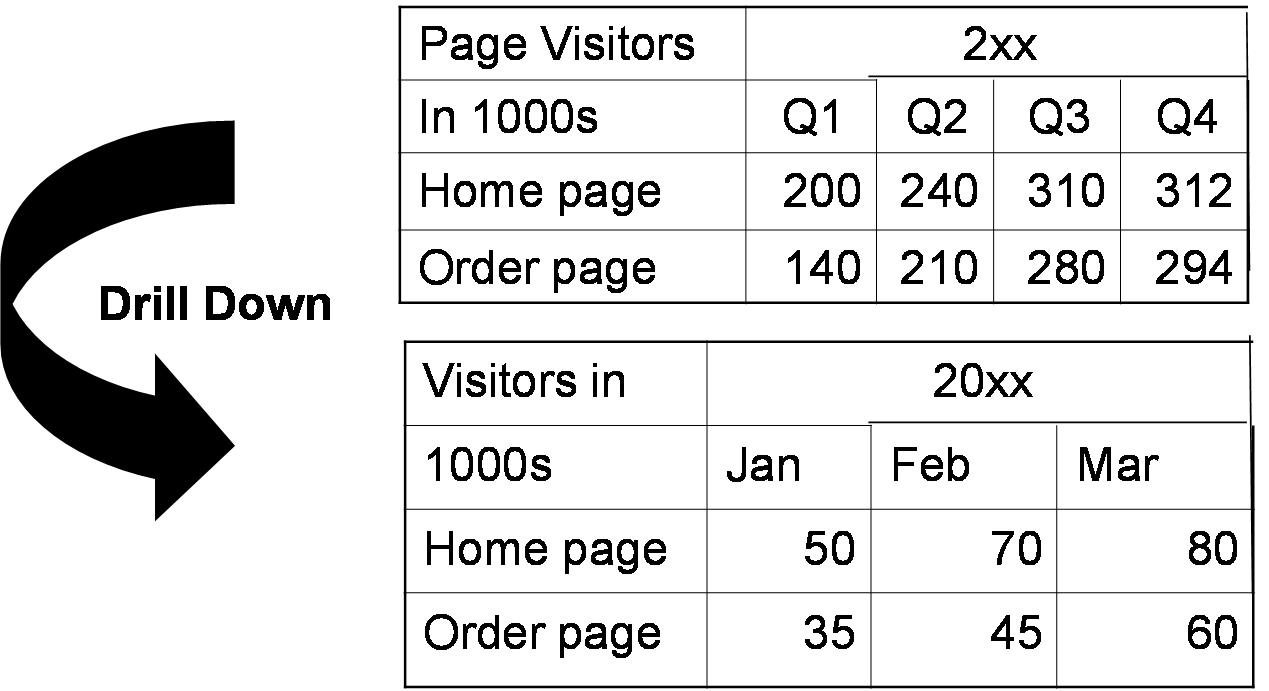
Drill Down
Drill down is the opposite of roll up. Drill down is an operation for navigating down a dimensional hierarchy to lower, more detailed levels. Finer grained data is obtained by adding a dimension or hierarchy levels.
An example of drill down is illustrated in Figure 12-03. In this example, the analyst starts by looking at web page visits totaled by quarter. Then the analyst drills down from quarters to months. Further drill downs could go to daily or hourly levels. Beyond hourly levels, drill down could include individual visits – a very granular level of detail.
Figure 12-03: Drill Down Example
Drill down tends to follow hierarchical levels, ending with detailed instances or events. Retail sales drill downs, for example, could start with country and then drill down to region, state, district, and store. Drill down from the store level could go to individual sales transactions.
Drill downs are useful for root cause analysis. By looking at finer levels of detail, the analyst seeks to determine why something is happening.
Pivot
Pivoting is another kind of analytic operation. Pivoting is used to analyze dimension data by which the cube is rotated by looking at different dimensions to provide a different perspective. It is like dicing, as depicted in Figure 12-04. The labels are supplied by data mart dimensions, while the quantities are supplied via a data mart fact.
Figure 12-04: Pivot Example

BI Operations Tips and Traps
The ability to query depends on the store of data provided in the data mart. This data is structured into dimensions and facts that contain both detailed (atomic) data as well as aggregated data. Use the Tips and Traps information in Table 12-02 to improve the success of BI operations for your data warehousing projects. These considerations are basic to creating a system that is responsive to data warehouse users who want to explore data and perform analytic functions in the data mart using query tools.
Table 12-02: BI Operations Tips and Traps
|
Tips (Do This) |
Traps (Don't Do This) |
|
|
• Design data mart and cubes to support basic analytic functions • Provide detailed data to support roll up • Provide rich hierarchies to support roll up • Obtain query tools that support basic analytic functions |
• Focus on fixed reports rather than data exploration • Fail to provide conformed dimensions • Fail to provide hierarchies |
|
|
Key Points • Core BI Operations are the building blocks of BI. • Slicing is an operation used to focus analysis on a specific area by reducing the number of dimensions. For example, slicing could be used to examine a geographic area or sales region. • Dicing is an operation that enables analysis from a different perspective by rotating a cube to access it by a different dimension. For example, the analysis perspective could be change from a product perspective to a customer segment perspective. • Drill-down is an operation for navigating down a dimensional hierarchy to a lower, more detailed level. For example, drill-down could provide greater detail by analyzing data at a sales transaction level instead of a customer sales total level. • Roll-up is an operation for navigating up a dimensional hierarchy to a more summarized level; data is aggregated by summarizing it at successively higher levels. For example, zip code sales could be rolled up to a state level, which could be rolled up to a country level. • Designing the data mart with the appropriate facts and dimensions makes a more effective BI environment. |
Section 12B – Business Intelligence Tools
How many times do I have to tell you, the right tool for the right job!
Montgomery Scott (“Scotty”)
Chief Operations Officer, Star Ship Enterprise
When you have completed the remainder of this chapter, you will be able to:
• Understand the types of business intelligence tools
• Explain the characteristics of BI tools
• Determine which type of BI tool fits the needs of your organization.
In the first part of this chapter, you learned about BI Operations including slice, dice, drill down, and roll up. Now it is time to learn about tools that can be used to carry out these operations so you can visually analyze and present data. This chapter will help you sort through numerous tools available for analyzing and presenting data. Business intelligence tools break down into these categories:
• Interactive Query and Analysis Tools
• Reporting Tools
• Data Visualization Tools
• OLAP Tools
• Data Mining Tools.
Interactive Query and Analysis Tools
Query tools enable the exploration of data through a user friendly exploration interface. These tools typically:
• Are interactive
• Are ad hoc
• Are driven by spontaneous user questions
• Display lower volumes of data.
They provide views of data that follow familiar patterns:
• Spreadsheet
• Drill down
• Roll up
• Pivot.
Examples of query tools include:
• Microsoft Access and Excel
• Microsoft ProClarity
• Business Objects BusinessQuery
• Cognos Report Studio and Query Studio
• SAS
These tools should display information graphically and enable production of scorecards and dashboards. See Chapter 18 for recommendations concerning the presentation of data.
Reporting Tools
Reporting tools produce outputs that can be stored and reviewed. Often reports are produced on a time schedule such as monthly. Reporting tools are typically:
• Less interactive
• Less ad hoc
• Reporting a view of data (header and detail)
• Driven by pre-established user questions
• Displaying moderate volumes of data.
Examples of reporting tools include:
• Microsoft Access
• SAP Crystal Reports
• SolutionsIQ Managed Reporting Environment
• Microsoft SQL Server Reporting Services.
Data Visualization Tools
This new and growing area enables users to better understand data through easy to use visualization tools. Examples of data visualization tools include:
• QlikTech Qlikview
• Tibco Spotfire
• Tableau.
Data Mining and Statistical Tools
Data mining and statistical tools are used by specialized analysts and driven by the search for patterns. Analytic methods are used such as:
• Associations and Clusters
• Decision Trees
• Fuzzy Logic
• Genetic Algorithm
• Naive Bayes
• Neural Networks
• Regression Models
• Sequential Clusters
• Time Series.
In addition to these methods, mathematical techniques such as linear regression, probability, and optimization algorithms are used. Examples of statistics and data mining tools include:
• R Foundation for Statistical Computing R Open Source Analytic System
• SAP/Business Objects BusinessMiner
• SAS Institute SAS and Enterprise Miner
• IBM Cognos SPSS.
The patterns and rules discovered through data mining and statistics can be used to improve decision-making and to forecast the results of those decisions. Chapters 13 and 14 describe statistical analysis and data mining, respectively.
Evaluating BI Tools
Selecting the right BI tool for the right purpose is an important element of BI success. First, review the requirements. Will the BI tool be used for reporting, data exploration or analytics? Who is the audience for the BI tool? Next, identify candidate tools that may satisfy the requirements using examples listed earlier in this chapter and through research. Determine which questions to ask about each BI tool. Table 12-03 presents BI tool evaluation topics.
Table 12-03: BI Tool Evaluation
|
Evaluation Area |
Feature |
|
Administration |
Performance monitoring tools Audit trail reports Report locking and check-out User management Metadata management Easy install and configuration |
|
Architecture |
Operating system platform Web based output viewer – reports, dashboards, ad hoc queries Web based designer Portlet support 64-bit processing support Multi-tier architecture Microsoft Office integration |
|
Development Environment |
‘Drag and drop' report, query and analytics design |
|
Reporting Capabilities |
Multi-level totals Built-in functions Ad Hoc query Prompted reports – users can specify criteria for reports |
|
Interactive Query Capabilities |
Basic operations: drill down, roll up, slice, dice and pivot |
|
Analytic Capabilities |
Scorecard analysis Trend discovery Predictive modeling |
|
Security |
Security groups with subject filters Data level security |
|
Data Sources |
Adapter for DB2 Adapter for flat files Adapter for JDBC and ODBC Adapter for Oracle Adapter for SQL Server 2005/2008/2012 Adapter for XML Native adapters versus generic adapters |
|
Costs |
Software licensing plans and costs Data source adapter costs Software maintenance costs Training costs Additional costs |
Finally, rate the tools using the criteria you have identified. You can learn about BI tool characteristics through analyst reports, discussion with BI tool users, Requests for Proposal (RFP) and hands on use of the tools. Invite members of your BI team to share their experiences with the tools.
|
Key Points • Selecting the right BI tool for the right purpose is an important element of BI success. • Interactive query and analysis tools enable exploration of data through a user friendly interface. These tools include support of core BI operations: slice, dice, pivot, drill down and roll up. • Reporting tools produce outputs that can be saved and reviewed. Often these tools are run on a scheduled basis. • Data mining tools are used to find patterns in data that support root cause analysis and improved decision-making. |
Learn More
Build your know-how in the area of business intelligence operations and tools using these resources.
|
Get Research! |
Search the web for research reports (filetype=pdf): • Aberdeen Business Intelligence • Forrester Wave Business Intelligence • Gartner Magic Quadrant Business Intelligence |
|
Read about it! |
This book provides insights into the use of Business Intelligence: Howson, Cindi. Successful Business Intelligence: Secrets to Making BI a Killer App. McGraw-Hill Companies, 2008. |